
0 ITEMS

How to Apply the Discounted Cash Flow Valuation Method

Understanding how to accurately value a business is essential for investors and entrepreneurs alike.
- The discounted cash flow (DCF) method estimates a company’s worth based on projected future cash flows discounted to today’s value.
- Building a reliable DCF model requires detailed financial forecasts, including historical data, assumptions, and key metrics like free cash flow, WACC, and terminal value.
- Accurate valuation depends on precise inputs from financial statements such as income, balance sheet, and cash flow statements.
- The method involves multiple steps: projecting cash flows, calculating terminal value, discounting everything to present value, and deriving enterprise and equity values.
- Using structured models and understanding the core components helps make informed investment decisions.
This article guides you through the practical process of implementing the DCF valuation method step-by-step.
What Is Discounted Cash Flow Valuation?
When valuing a company, experts often choose from three main methods:
- The income approach values a business based on the cash it expects to earn in the future.
- The market approach compares the business to similar ones recently sold or traded.
- The cost approach estimates how much it would cost to rebuild or replace the business today.
Each approach provides a unique angle to determine a company’s worth.
The discounted cash flow valuation, a type of income approach, is a strong way to see what drives business value. It calculates what future cash flows are worth today. The discounted cash flow valuation focuses on a business’s future cash flows. It’s a trusted way to find a company’s worth based on projected performance. This method works for valuing businesses, real estate, and intangible assets like brands or patents. It does require a solid business plan and at least five years of financial forecasts, which can involve some judgment.

You need a detailed DCF model of valuation, usually built in Excel, to perform a discounted cash flow valuation. It is because the method depends on precise numbers and clear logic. It calculates value by forecasting future cash flows and discounting them to today’s terms. Without a structured model, missing key steps or making errors is easy. Excel lets you organize inputs, test scenarios, and adjust assumptions quickly. This clarity helps investors trust your valuation.
What Are the Key Components of a DCF Model of Valuation?
A DCF model of valuation helps estimate the worth of a business or asset based on future cash flows. It’s a powerful tool that guides investment decisions by turning projections into present value. This model relies on careful assumptions and financial forecasts, making it insightful and complex. Before diving into the math, it’s important to understand the building blocks that drive its accuracy and reliability. The following are the key components of a DCF model of valuation:
- Business / Financial Plan – As a pre-requisite to a DCF valuation, financial projections with at least five forecast years are required
- Valuation Date – for every DCF valuation, analysts estimate the value of an asset on a specific date. From the valuation date onwards, expected future cash flows are determined.
- Free Cash Flow Calculation – Free Cash Flow to Firm (FCFF) is computed to calculate the discounted cash flow.
- Discount Rate – The discount rate is set equal to the opportunity cost of capital. It reflects the business risk by estimating how much return a business should generate by comparing it to the obtainable returns at the market when investing in similar risky businesses in the same industry.
- Terminal Value – The terminal value represents the value of a business generated from all the expected cash flows at the end of the forecast period (normally year 5).
- Discounting – The projected future free cash flows must be discounted to today’s valuation date using the company’s discount rate. Since these cash flows are expected to be obtained in the future, they carry a risk that must be accounted for when calculating their present value as of today or as per a specified valuation date.
- DCF Valuation Result – Knowing how to calculate Net Present Value, also known as the Enterprise value, using DCF, is important in valuing a business. This is computed simply by the summation of the discounted cash flows. When further deducting debt and adding the cash position as per the valuation date from the Enterprise value, we can also obtain the Equity Value.

Below you will find an example of a DCF Valuation Model.

The DCF valuation table above presents a 5-year forecast of free cash flow to the firm, helping estimate a company’s worth today. The valuation date is implicitly Year 0. The cash flow is calculated by adjusting EBIT for taxes, depreciation, changes in working capital, and capital expenditures. A 12% discount rate adjusts future cash to today’s value. The model adds a terminal value in Year 5 using a 5.0x EV/EBITDA multiple to account for value beyond the forecast. Each year’s cash flow is discounted to calculate its present value (NPV). The total NPV is $4.1M, representing the enterprise value. After adding cash and subtracting $2M in debt, the equity value is $ 2.2 M. This model shows how value is driven largely by long-term growth, with 87.4% of the firm’s value coming from the terminal year.
A Step-By-Step Guide to the DCF Method of Valuation
Understanding what a business is worth starts with solid numbers and clear thinking. The DCF method of valuation offers a reliable way to estimate a company’s value by focusing on future cash flows and the time value of money. This guide will walk you through each step so you can make smart, confident decisions based on real financial insight.
Step 1: Input Historical Financial Data
The first step in the DCF method of valuation is to input historical financial data. This includes past revenue, expenses, profits, and cash flows. These figures help identify trends and build a realistic forecast. Clean, accurate data gives a solid base for future projections. Without it, your valuation may rest on weak assumptions.
To build a DCF model, analyze at least five years of historical financial data using the three-statement model. Use numbers from the balance sheet, income statement, and cash flow statement to compare key data points. This helps you understand the business and gives a solid base for your forecast. Past numbers are real, not estimated, so they offer reliable insights. This includes projected income statements, balance sheets, and cash flow statements using the three-statement model. . You need this data to back up and test the assumptions in your future projections.
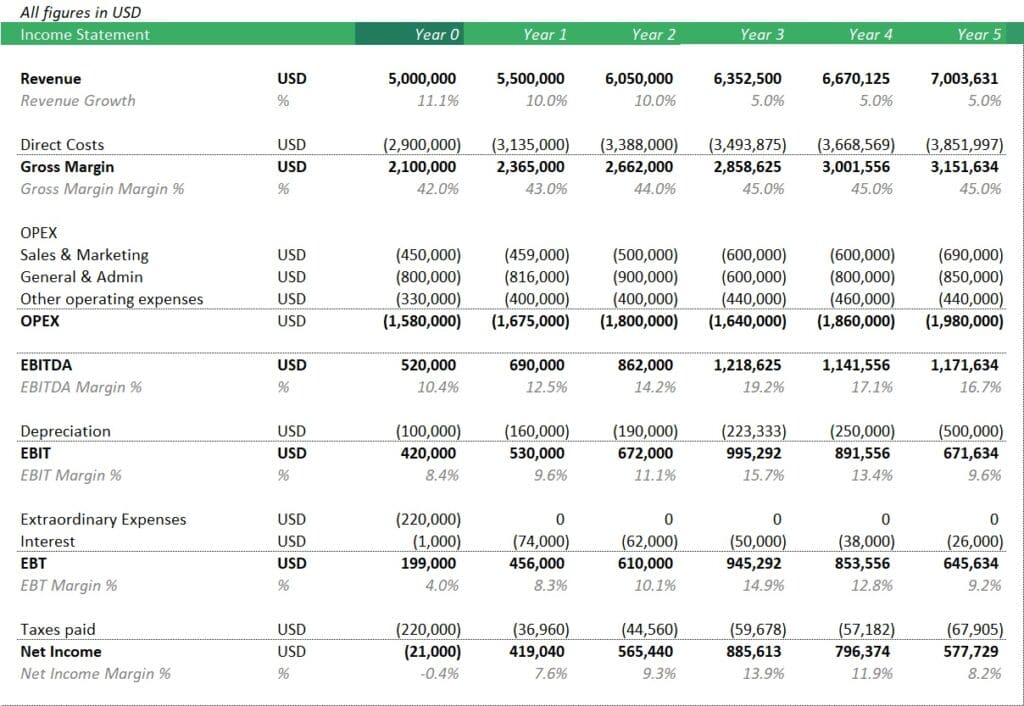
The income statement above records actual performance across key metrics like revenue, direct costs, operating expenses, EBITDA, and net income. These figures help you identify past growth trends, profit margins, and cost behavior, which are critical for building realistic financial projections.
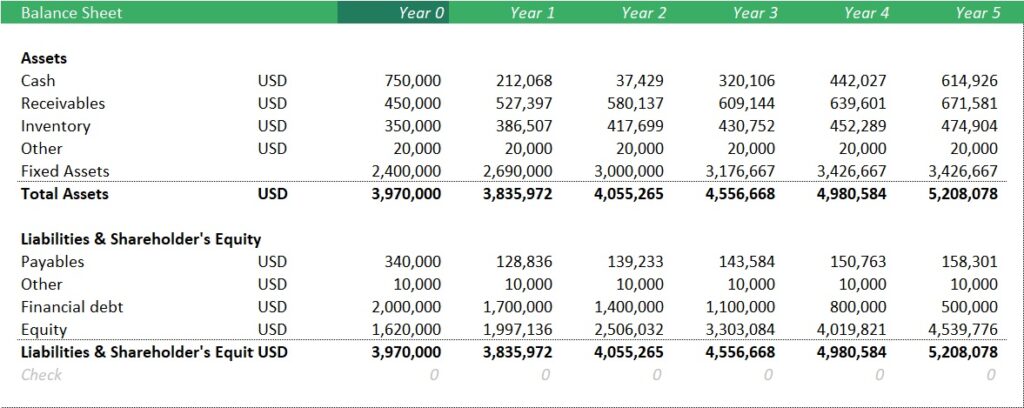
The balance sheet above helps build a solid base for Discounted Cash Flow (DCF) valuation by showing a company’s financial position over time. It details historical values for assets, liabilities, and equity, which are key to calculating working capital, capital expenditures, and net debt. These components directly impact free cash flow—DCF’s core input.
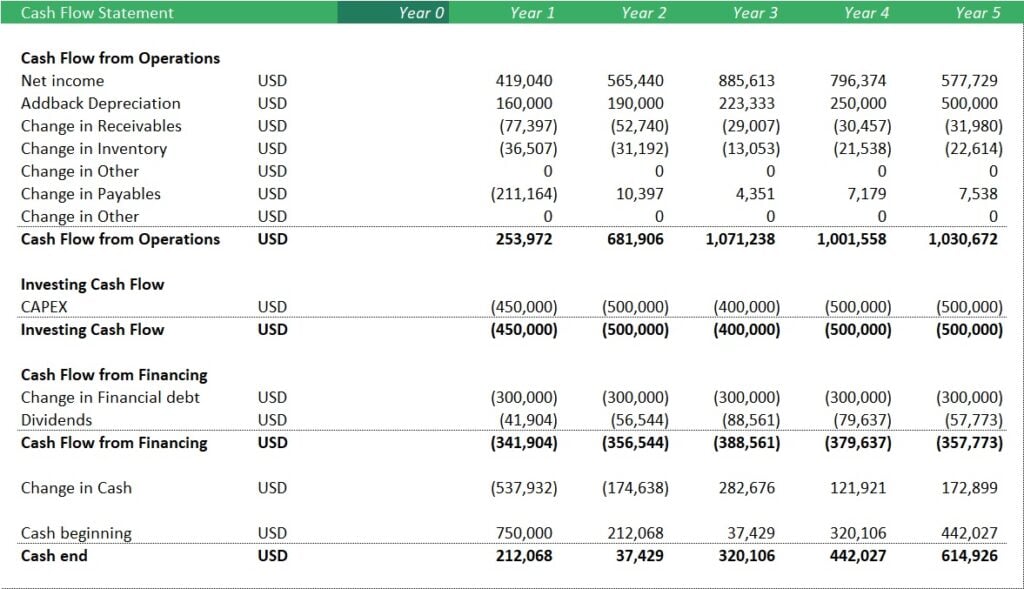
The cash flow statement above helps you build an accurate Discounted Cash Flow (DCF) model by showing the actual cash the business generated and spent. It highlights operating cash flow, capital expenditures (CAPEX), and changes in debt—all critical for calculating free cash flow. Free cash flow, which powers the DCF method, comes from operating cash flow minus CAPEX. This statement shows how profits turn into cash and where the money goes, helping you spot trends and make solid future projections. With this data, your DCF inputs stay realistic and grounded in real company performance.
Step 2: Forecast Key Assumptions and Build a Financial Forecast
The second step in the DCF method is to forecast key assumptions and build a financial forecast. This means estimating future revenue, expenses, profit margins, capital spending, and working capital needs. You base these on industry trends, company plans, and past performance. The goal is to create a clear picture of how much cash the business will generate over time. This forecast becomes the foundation for calculating the company’s value. Keep your assumptions realistic and consistent to ensure the model stays reliable. Financial ratio analysis helps you make smarter assumptions when building a DCF forecast. By studying past ratios, you can spot trends and set realistic targets. These ratios show how efficiently the company runs, handles costs, and uses capital. Use them to guide future projections for revenue growth, expenses, investment needs, and financing.
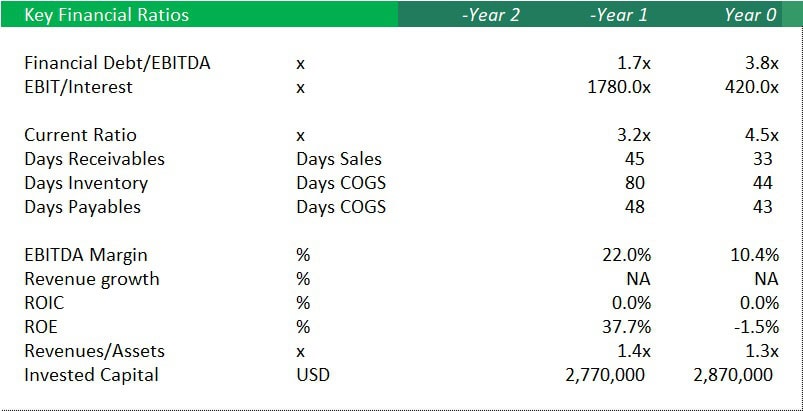
The financial ratio analysis above supports the DCF method of valuation by offering key insights into the company’s performance over time. The data reveals improving financial health, with EBIT/Interest climbing sharply from 420.0x in Year 0 to 1780.0x in Year 1, and a stronger current ratio moving from 3.2x to 4.5x, suggesting better liquidity. Operational efficiency is highlighted through improving Days Receivable and Days Inventory. The EBITDA margin more than doubled, signaling stronger profitability. ROE also jumped to 37.7%, reflecting better returns for shareholders. This snapshot helps validate forecasts and adjust assumptions in a DCF model with real trends.
It is important to analyze the key financial ratios to obtain a better understanding of the company’s financial situation.:
- Financial Debt/EBITDA: Is the company using an appropriate debt level or over-levered?
- EBIT/Interest: Is the company able to meet its interest obligation?
- Current Ratio: Does the company have sufficient liquidity to operate?
- Days Receivable, Inventory, and Payable: How fast do the company’s customers pay invoices, and how long do suppliers wait until they get paid? How much inventory does this company require? Are these metrics in line with industry benchmarks?
- EBITDA Margin and ROE: Is the company profitable and able to produce an appropriate return for its shareholders?
- Revenue/Assets: How capital-intensive is this company?
Answering questions like these before building a business plan offers better insights into the company’s financial situation. A thorough understanding will allow you to build a better-quality business and financial plan than skipping this important step.
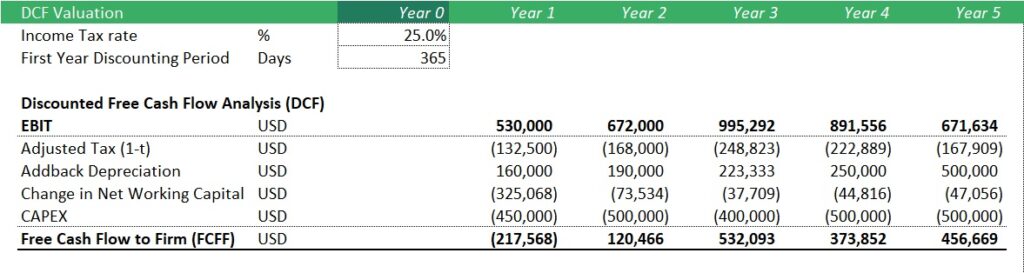
Step 3: Calculate Free Cash Flows to the Firm (FCFF)
The third step in the DCF method is calculating Free Cash Flows to the Firm (FCFF). This means estimating how much cash the business generates after covering operating expenses and reinvestments before paying debt or dividends. FCFF shows the money available to all investors—debt and equity holders—and is key to understanding the firm’s true value. The calculation of Free Cash Flows to Firm includes the following elements:
- EBIT (Earnings before Interest and Taxes): The operating profit generated by the company. Net Income is after tax and interest expenses. Therefore, it is changed by the company’s financing structure. Therefore, we cannot use it.
- Effective expected tax rate (T): We subtract a pro forma tax on EBIT by multiplying EBIT by (1-T) without deducting interest, as we want to have the taxes calculated before any effects of the financing structure.
- Depreciation and Amortization (D&A) are added because they are non-cash expenses.
- Changes in Net Working Capital: The change in accounts required to perform the business, such as changes in receivables, inventory, and payables, which affect the cash flow statement.
- CAPEX (Capital expenditures): The required capital investments, such as investments in tangible and intangible assets, for the years to come. Capital expenditures are important drivers of future revenue and profitability growth.
Adding these items results in a calculation like this:
Step 4: Determine the Discount Rate (WACC)
The fourth step in the DCF (Discounted Cash Flow) method is to determine the discount rate, often calculated using the Weighted Average Cost of Capital (WACC). WACC shows the average rate a company is expected to pay to finance its assets. It blends the cost of debt and the cost of equity, weighted by how much of each the company uses. This rate reflects the business’s risk and helps convert future cash flows into present value. Getting this step right is crucial because even small changes in WACC can lead to big differences in a valuation.
In the DCF method of valuation, analysts use the Weighted Average Cost of Capital (WACC) to discount forecasted unlevered free cash flows to their present value. Since each business faces different risks and operates in specific industries, calculating an accurate WACC is essential. The discount rate plays a big role in the final valuation—higher rates lower the present value of cash flows due to greater risk, while lower rates increase it because less risk means less required return.






















































Step 5: Estimate Terminal Value Using 10 Methods
The fifth step in the DCF method is to estimate the terminal value. This value captures the business’s worth beyond the forecast period. Since we can’t project cash flows forever, we use a formula to estimate future value after the detailed forecast ends. Most often, this involves assuming steady growth or using an exit multiple. The terminal value often makes up a large part of the total valuation, so choosing realistic assumptions is vital.
There are 10 ways to estimate terminal value, each offering a different approach based on the business type and data available. Some use steady growth models like the Gordon Growth method, while others rely on exit multiples based on market data. More advanced methods include value driver formulas, inflation-linked growth, or even liquidation value. Each method has pros and cons, so picking the right one depends on how predictable future cash flows are and how the business is expected to grow. Choosing wisely helps make the valuation more realistic and reliable. Using the EV/EBITDA multiple, we keep it simple to estimate the terminal value. This method applies a market-based multiple to the company’s EBITDA, often based on similar companies or recent deals in the same industry. Since EBITDA reflects earnings before interest and debt costs, it aligns with Enterprise Value (EV) and fits best using unlevered free cash flows.
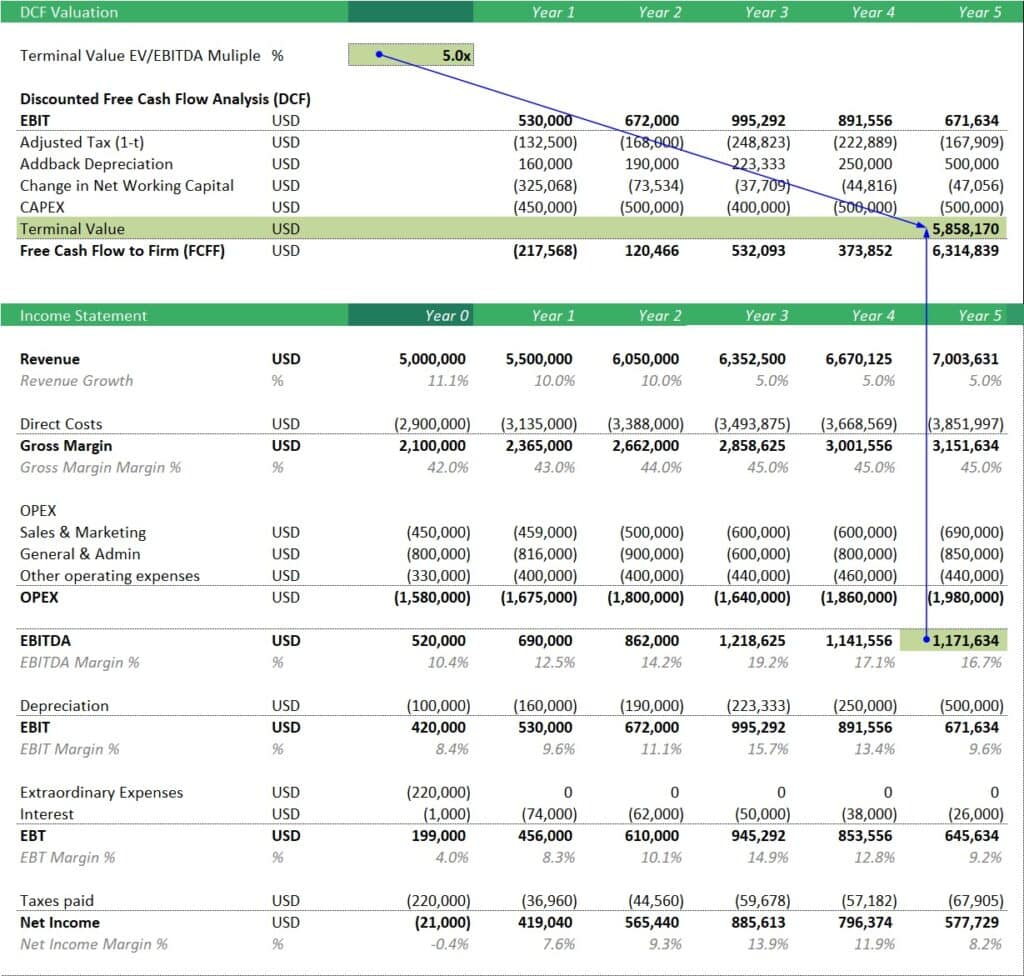
The table above calculates the terminal value using the Exit Multiple Method with a 5.0x EV/EBITDA multiple. It takes the Year 5 EBITDA, which is $1,171,634, and multiplies it by 5 to get the terminal value of $5,858,170. This figure estimates the business’s value beyond the forecast period, assuming it could be sold at five times its EBITDA, based on market benchmarks. This value is then added to the discounted cash flows to reflect the company’s total worth in the DCF analysis.
Step 6: Discounting Free Cash Flows and Terminal Value
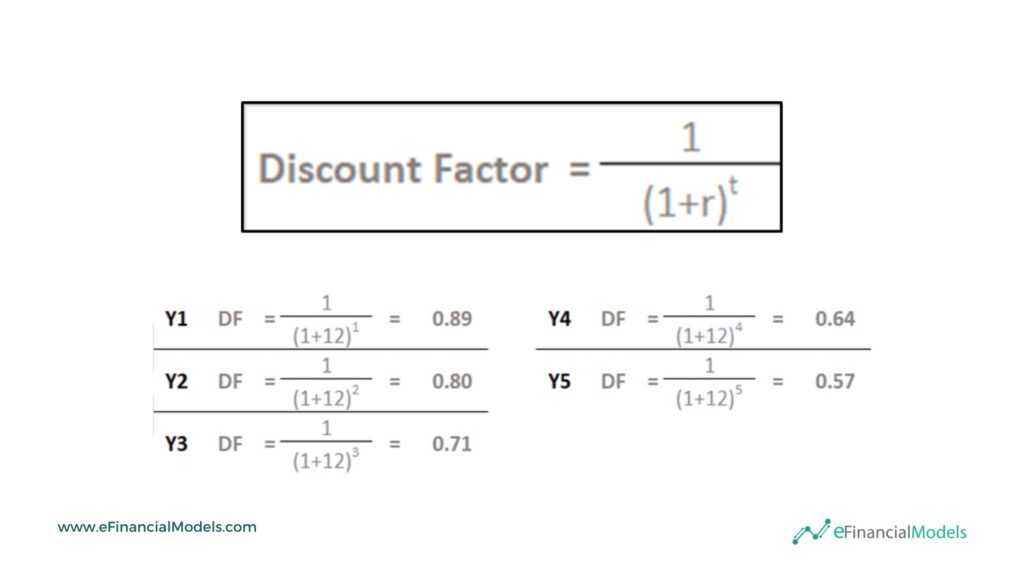
Step 6 of the DCF method of valuation is to discount both the free cash flows and the terminal value to present value. Future cash flows lose value over time, so we apply a discount rate—usually the Weighted Average Cost of Capital (WACC)—to reflect risk and time. This step converts all future values into today’s dollars, helping investors see what the business is worth based on expected performance. In this step, we use a 12% discount rate to reduce the projected free cash flows and terminal value to their present values, known as the Net Present Value (NPV). We apply discount factors each year to reflect how future cash flows are worth less over time. Here’s how the discount factors are calculated for Years 1 to 5.
Using the data from the three statement model illustrations, Present Value, also known as Discounted Free Cash Flows are computed as follows:
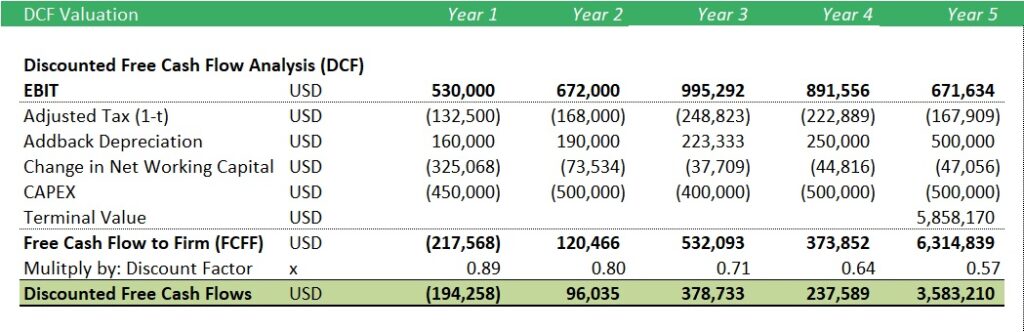
The DCF valuation above shows how to discount free cash flows and terminal value to find their present values. Each year’s Free Cash Flow to Firm (FCFF) is multiplied by a discount factor based on a 12% rate. For example, Year 1’s FCFF of -217,568 is multiplied by 0.89 to get a discounted value of -194,258. The same goes for the terminal value in Year 5. It’s added to the Year 5 FCFF, then multiplied by 0.57 to get 3,583,210. This process converts all future cash into today’s value, helping estimate what the business is worth now.
Step 7: Calculate Enterprise and Equity Value
In Step 7 of the DCF method of valuation, you calculate the enterprise and equity value of the business. First, add the present value of all future free cash flows and the terminal value to get the enterprise value. Then, subtract net debt and other non-operating liabilities to find the equity value. Based on its expected cash flows, this final number shows what the company is worth to shareholders today.
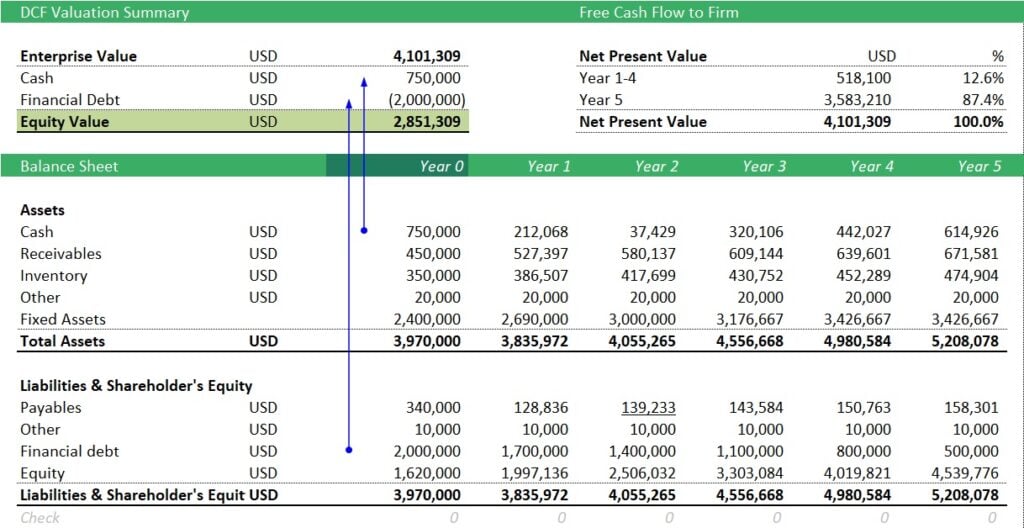
The Enterprise Value (also known as firm value or asset value) is the total value of the assets of a business (excluding cash). Using the discounted cash flow analysis example previously shown, Enterprise Value is simply the Net Present Value or the summation of discounted free cash flows:

The Equity Value (also known as net asset value) is the value that remains for the shareholders after any debts have been paid off. Using the DCF model, Equity Value is computed by adding back the beginning balance of cash to the enterprise value, and then deducting the beginning balance of the financial debt.
Simplify Valuation Using a Discounted Cash Flow Valuation Model
Applying the DCF valuation method is a clear, step-by-step process. Start by gathering past financials. Then, project future performance based on solid assumptions. Use these to calculate free cash flows. Apply a suitable discount rate, often the WACC, to value those cash flows. Estimate the terminal value with multiple methods for accuracy. Next, discount all values back to present terms. Finally, sum everything to find the enterprise value, and subtract debt to get equity value. This structured approach helps investors find a company’s worth based on future cash potential.

Simplify your valuation process with a Discounted Cash Flow (DCF) model. It breaks down future cash flows into clear, manageable steps. You estimate, forecast, and discount with a purpose—no guesswork—just a structured way to find what a business is worth. A DCF model helps you focus on key drivers and confidently make smart decisions.
Ready to put DCF into action? Download our Free Discounted Cash Flow (DCF) Valuation Model Template and start valuing businesses clearly and confidently. Get the template now!

















You might also like:
- 10 Main Elements of a Business Plan
- 10 Tips to Develop a First Class Business Valuation Report
- Finding a Valuation Model for Your Business
- How to Calculate Net Present Value (NPV)?
- Top 10 Mistakes in DCF Valuation Models
- Financial Modeling for Startups and Small Businesses
- How to Value a Business Using a Discounted Cash Flow Model
- Business Valuation
- Financial Model
- Discount Rate
- Valuation Services
- Business Valuation Service
- How to prepare a financial feasibility study?
- Key Financial Ratios
- How to Make Smart Decisions with 6 Key Financial Metrics?
- Financial Planning for Small Business Owners – Taking an SBA Loan
- How to Protect Confidential Information Through a Non-Disclosure Agreement
- How to Raise Series A Funding?
- Financial Statements – Definition, Uses, Contents and Templates
- Understanding the Debt Service Coverage Ratio: An Essential Metric for Financial Analysis