
0 ITEMS

How to Calculate Terminal Value in Excel?
Understanding how to calculate terminal value in Excel is crucial for long-term business valuation and investment analysis.
- The terminal value estimates a company’s worth beyond the forecast period, often comprising a large part of the total valuation.
- Different methods, such as the Gordon Growth Model, exit multiples, and value driver formulas, suit various business types and growth scenarios.
- Choosing the right approach depends on business stability, industry, and available data, ensuring realistic and balanced estimates.
- Advanced models blend multiple techniques for more accurate, scenario-based valuations, especially for complex or fast-changing companies.
Getting familiar with these methods helps you build more reliable financial models and make smarter valuation decisions.
What Does the Discounted Cash Flow Terminal Value Mean?
The terminal value definition refers to the estimated value of a business beyond the forecast period in a financial model. It represents the company’s expected cash flows far into the future, condensed into one number. This value helps investors understand the long-term worth of a business when detailed forecasts are no longer practical. It’s often used in discounted cash flow (DCF) models and calculated using multiple approaches.
The Discounted Cash Flow Terminal Value shows the value of a business after the forecast period ends. It captures all future cash flows beyond that point in one simple figure. This value matters because a company’s worth often comes from long-term performance. By including the Discounted Cash Flow Terminal Value, investors fully understand what the business is worth today.

Is Terminal Value the Same as Exit Value?
Terminal and exit values are related to estimating what a business is worth at the end of a forecast period. However, they are not the same.
Exit value is the price a buyer might pay to purchase a business at the end of a forecast. It reflects a potential sale, not continued operations. In contrast, the terminal value definition refers to the long-term value of a business, assuming it keeps running beyond the forecast. Exit value is deal-focused, while terminal value supports full business valuation. Both are future-looking, but they answer different questions. Terminal value shows the long-term worth of a business beyond the forecast, assuming it keeps running. It includes all future cash flows in one number. The discounted cash flow terminal value helps investors see what the business is truly worth today. Terminal value focuses on ongoing operations, while exit value looks at a potential sale.
What Is a Good Terminal Value?
A good terminal value reflects a fair, realistic estimate of a business’s long-term worth. It should be based on steady growth, not overly optimistic forecasts. A strong terminal value uses sound assumptions, like modest growth rates and reasonable profit margins. It avoids extreme numbers that could mislead investors. In short, a good terminal value balances future potential with practical expectations.
The average terminal value varies by business stage. Startups often have low or unstable terminal values due to high risk and uncertain cash flow. Growing businesses show higher terminal values, driven by strong revenue growth and scaling potential. Mature companies tend to have steady, predictable terminal values based on stable earnings and slower growth. There’s no universal average figure for terminal value because it depends heavily on the company’s size, industry, and growth outlook. However, in practice, discounted cash flow terminal value often makes up 60% to 80% of the total valuation, especially for growth-stage and mature companies. For startups, it may be lower or highly speculative due to uncertainty. Instead of focusing on a fixed number, analysts look at reasonable assumptions like long-term growth rates (often 1% to 3%) and valuation multiples based on comparable companies.



















































The Role of Discounted Cash Flow Terminal Value
When building a financial model, future cash flows only tell part of the story. We must look beyond the forecast period to understand a company’s worth. That’s where the discounted cash flow terminal value comes in. Since companies are assumed to operate indefinitely, the discounted cash flow terminal value captures the value of all expected cash flows as a bridge to long-term value. Without it, the model would leave out a major piece of the picture.
- Captures the Majority of a Firm’s Value: The terminal value often constitutes more than half of the total DCF valuation. Since detailed cash flow projections are typically only feasible for a few years, calculating the terminal value ensures that long-term growth expectations are reflected in the model. Ignoring it would severely understate a company’s worth.
- Ensures Continuity Beyond Forecast Period: Forecasting detailed financials for decades isn’t practical. The discounted cash flow terminal value helps by applying long-term assumptions to estimate the ongoing value. This bridges the gap between the finite projection period and the going concern assumption, thus offering a more complete picture of enterprise valuation.
- Supports Strategic Decision-Making: Terminal value offers insights into long-term sustainability and profitability. Whether you’re an investor evaluating an acquisition or a manager making capital expenditure budgeting decisions, calculating terminal value helps you understand how much of the firm’s value is tied to long-term prospects. It also plays a key role in sensitivity analysis to gauge how different assumptions affect the valuation outcome.

Terminal Value Calculation Methods in Excel
Understanding how to calculate terminal value in Excel is key for anyone building long-term financial projections. Terminal value estimates the worth of a business beyond the forecast period, often making up a large portion of a company’s total valuation. Excel provides a simple way to apply different methods and see how changes in assumptions affect results.
There are several ways to calculate terminal value in Excel. Popular methods include the following:

Each approach has a unique logic, but all aim to capture a business’s continuing value after detailed forecasts end.
Gordon Growth Model
The Gordon Growth Model is a simple way to estimate terminal value based on future dividends. It assumes dividends will grow at a steady rate forever. It gives the business value beyond the forecast period, assuming steady growth forever.
The Gordon Growth Model formula to calculate terminal value is:

Where:
- FCF is the free cash flow a company expects to generate in the last year of its forecast period.
- g is the steady rate at which free cash flow is expected to grow forever after the forecast period.
- r is the rate investors use to discount future cash flows back to their present value.
The Gordon Growth Model makes terminal value easy to calculate in Excel. It saves time and works well for stable businesses with predictable cash flows. However, it has limits. The model assumes constant growth forever, which may not match reality. It’s also sensitive to small discount or growth rate changes, which can skew results. Use it with care and only for mature companies.
Capitalized Earnings Method
The Capitalized Earnings Method estimates a business’s value based on its expected earnings and a capitalization rate. It assumes that the company will generate steady profits in the future. You divide the expected annual earnings by the capitalization rate to get the value. This method works best for mature businesses with stable income and low growth.
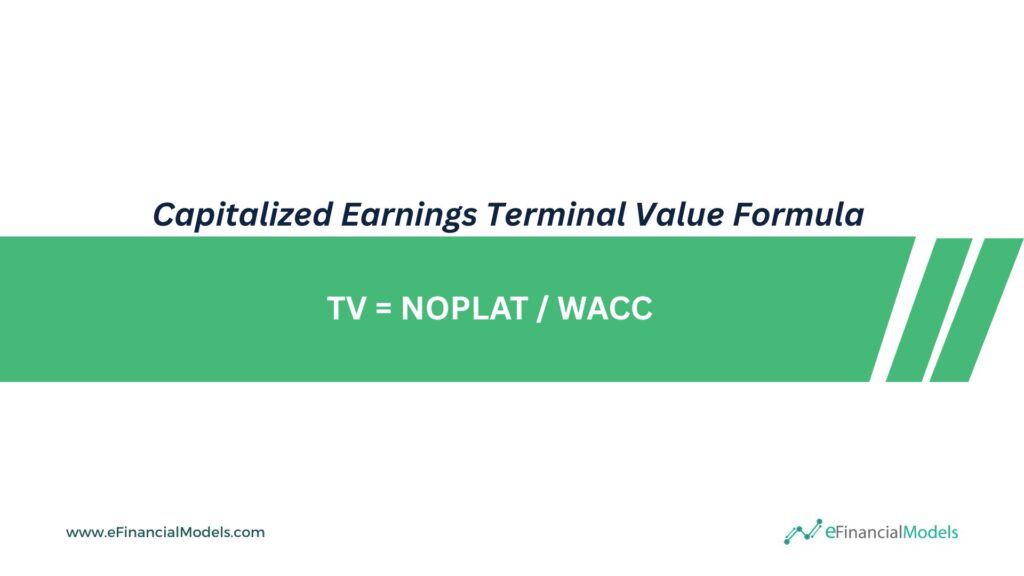
To calculate terminal value in Excel using the Capitalized Earnings Method, we use the formula:
Where:
- NOPLAT stands for Net Operating Profit Less Adjusted Taxes and shows the company’s after-tax profit from core operations.
- WACC, or Weighted Average Cost of Capital, is the average rate a company must pay to finance its assets through debt and equity.
This gives you the terminal value based on steady, no-growth cash flows and the company’s cost of capital. The Capitalized Earnings Method is quick and easy to use in Excel. It works best for stable businesses with steady earnings. You only need final year earnings and a cap rate to find terminal value. This keeps the math simple and the inputs clear. But it doesn’t account for growth so that it may undervalue fast-growing companies. It also assumes earnings stay flat, which may not fit all businesses.
Using Exit Multiples
Exit multiples help estimate a business’s future value at the end of a forecast period. Based on a financial metric like EBITDA or revenue, they reflect how much buyers will pay. For example, if similar companies sell for 8x EBITDA, you can apply that multiple to your business’s final-year EBITDA. It’s a fast way to guess what the business might sell for later.
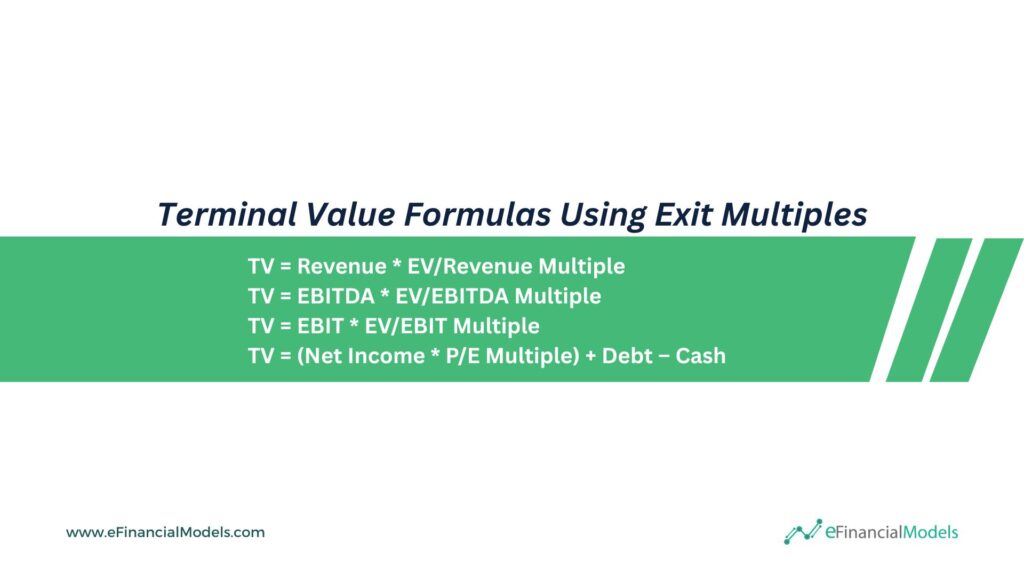
To calculate terminal value in Excel using exit multiples, choose a financial metric like Revenue, EBITDA, EBIT, or Net Income. Then apply a market-based multiple. Use these simple formulas:

Where:
- Revenue: The Total income a company earns from sales before any costs.
- EV/Revenue Multiple: Compares a company’s enterprise value to its revenue to show how much the market values each sales dollar.
- EBITDA: Earnings before interest, taxes, depreciation, and amortization—shows core profitability.
- EV/EBITDA Multiple: Measures how much investors pay for each dollar of EBITDA.
- EBIT: Earnings before interest and taxes—shows operating profit.
- EV/EBIT Multiple: Reflects enterprise value as a multiple of EBIT to value operations.
- Net Income: Profit left after all expenses, interest, and taxes.
- P/E Multiple: Price-to-earnings ratio showing how much investors pay per dollar of net income.
- Debt: The Total borrowed money the company must repay.
- Cash: Liquid funds the company holds and can use immediately.
Pick the metric that best fits your model. Using exit multiples in Excel to calculate terminal value is quick and simple. It reflects real market trends and is easy to update. But it also has limits. The result depends on the multiple you choose, which can be subjective or based on short-term data. It may not reflect long-term growth or risk. While fast, it can oversimplify the business’s true future value.
H-Model
The H-Model estimates terminal value by assuming growth slows over time. It starts with a high growth rate that fades to a stable, lower rate. This gradual shift happens over a set number of years. The model blends both rates to find a more realistic value. It’s useful when a company won’t stay in high growth forever. The H-Model gives a smoother and more balanced view of future cash flows.
To calculate terminal value using the H-Model in Excel, start with this formula:

Where:
- FCF is the free cash flow expected at the end of the forecast period, serving as the base for future value.
- gS is the short-term growth rate that reflects how fast cash flows grow right after the forecast period.
- gL is the stable, long-term growth rate the company is expected to reach.
- H is half the years for growth to decline from gS to gL.
- WACC is the discount rate to return future cash flows to their present value.
In Excel, enter each variable in separate cells, then plug the formula using cell references. This method captures gradual growth decline, blending realism into your valuation. Using the H-Model in Excel offers clear pros and cons. On the plus side, blending high and stable growth gives a more realistic view. It’s easy to set up with simple formulas and lets you tweak inputs fast. But it also has downsides. It assumes a steady fade in growth, which may not match real market shifts. Also, the model needs many inputs so that errors can pile up. Still, it’s a smart pick when growth is expected to slow gradually.
Value Driver Formulas
Value driver formulas help estimate a company’s value by linking it to key financial factors. The one-stage version assumes steady growth forever. This works well for stable businesses. The two-stage version splits growth into two periods: a high-growth phase and a stable phase. This approach suits companies expected to grow fast before leveling off. Both methods make valuation clearer by focusing on what drives value.
To calculate terminal value in Excel using value driver formulas, pick the one-stage or two-stage method depending on your case.
Where:
- NOPLAT stands for Net Operating Profit Less Adjusted Taxes and shows the company’s after-tax profit from core operations.
- g: The long-term growth rate is the expected constant rate at which the company’s cash flows or profits will grow beyond the forecast period.
- ROIC: Return on Invested Capital measures how efficiently the company generates returns from its capital investments.
- WACC: Weighted Average Cost of Capital is the average rate the company must pay to finance its operations through equity and debt.
Using value driver formulas in Excel makes terminal value easy to calculate and update. The one-stage version is fast and clear—ideal for stable companies. The two-stage version adds detail by modeling early growth before steady performance, giving more accurate results for fast-growing firms. However, both rely on long-term guesses, which can lead to big changes in value from small input changes. The two-stage version also needs more data and time to build. Still, both methods help focus on key drivers like growth, return, and discount rate—all easy to tweak in Excel.
How Advanced DCF Models Calculate Terminal Value with Precision
You can choose from several practical methods to calculate terminal value in Excel. Use the Gordon Growth Model if your business has steady growth and needs a simple, fast solution. Try Capitalized Earnings when earnings are stable and you want a clear, no-frills approach. If you’re using real market data, Exit Multiples work well and are easy to update. The H-Model is helpful when your company transitions from high to stable growth, offering flexibility and realism. Value Driver Formulas tie your assumptions to key business metrics for a more detailed analysis and help you model growth in stages. Each method serves a different need—pick the one that best fits your financial forecast.

Advanced DCF models calculate terminal value more precisely by tailoring the method to a company’s growth path and industry specifics. Instead of basic shortcuts, they blend detailed assumptions, real-time market data, and key value drivers. These models adjust for shifting growth rates, margins, and business cycles. They often combine multiple methods, like exit multiples and driver-based projections, to test scenarios and fine-tune results. This approach reduces guesswork and sharpens accuracy, making the valuation more reliable for long-term planning or investment decisions.
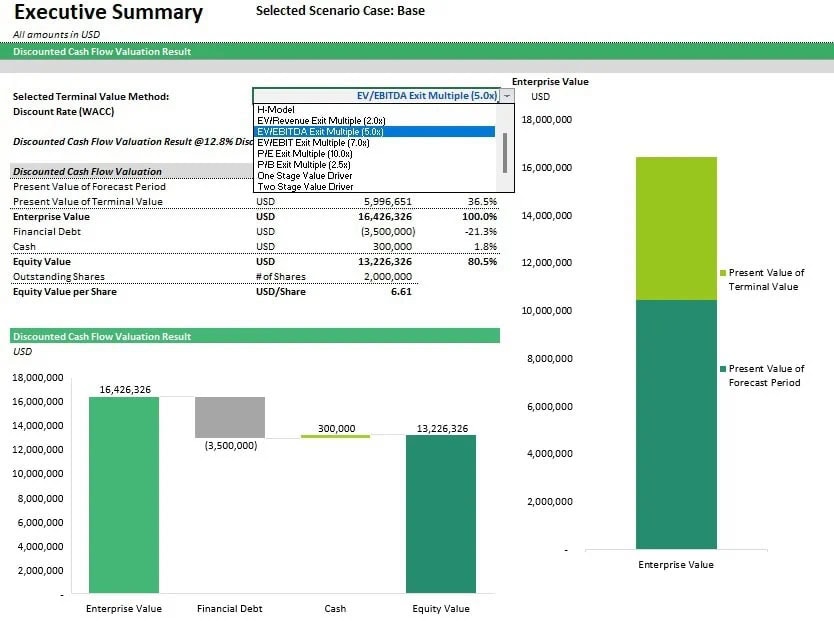
Our Advanced Discounted Cash Flow (DCF) Valuation Model Template calculates terminal value precisely by letting you choose from multiple, built-in methods—like exit multiples, H-Model, and value driver formulas. You can instantly switch between options to see how each affects the valuation. It uses clear inputs, live charts, and structured logic to handle everything from steady growth to complex, multi-stage forecasts. Whether you’re valuing a startup or a mature business, this model adapts to your assumptions and delivers results you can trust. It’s fast, flexible, and built to support sharp, data-driven decisions. Explore the model here.
































You might also like:
- Ten Ways to Estimate Terminal Value in DCF
- Understanding the Key Components of DCF Valuation
- How to Calculate Net Present Value (NPV)?
- Master the Free Cash Flow Formula for Smarter Financial Decisions
- How to Make Smart Decisions with 6 Key Financial Metrics?
- Top 10 Mistakes in DCF Valuation Models
- Financial Modeling with Excel: Fundraising Plan Tactics
- Why Financial Forecasting Models Are Vital for Your Business
- Financial Services
- Real Estate
- Hospitality
- 5-year Financial Projections
- Cash Flow Analysis
- Business Valuation
- Discounted Cash Flow Valuation Model: Free Excel Template
- How to Value a Business Using a Discounted Cash Flow Model
- The Purpose of a Financial Model
- Achieve Financial Success By Knowing Your Business Plan Model
- Financial Modeling for Startups and Small Businesses
Tags: Terminal Value