
0 ITEMS

Price-To-Earnings Multiple: Spot Undervalued Stocks Fast

The price-to-earnings (P/E) multiple is a key metric for valuing stocks and identifying investment opportunities.
- A low P/E ratio can signal undervalued stocks with growth potential, while a high ratio often reflects strong market expectations.
- Trailing P/E looks at past earnings, whereas forward P/E estimates future earnings, helping assess growth prospects.
- High-profile companies like Apple and Microsoft trade at higher P/E multiples due to their market dominance and innovation.
- Comparing P/E with industry averages and other metrics like PEG or ROE improves valuation accuracy.
- Understanding the limitations of the P/E ratio, such as earnings volatility and industry differences, is crucial for effective use.
This overview offers a practical approach to interpreting P/E multiples and making smarter investment decisions.
Unlocking Valuation Insights with the P/E Multiple
The Price-to-Earnings Multiple or P/E Multiple is a key equity valuation metric. It measures the relationship between a company’s market capitalization and its earnings. While technically a ratio, finance professionals treat it as a multiplier to estimate the value of a business or asset. Why? Because it shows how many times investors are willing to pay for each unit of earnings. Essentially, the P/E multiple answers the question: How much am I paying for every dollar of earnings the company generates?
The P/E Multiple is most commonly used when valuing companies with stable earnings. Unlike the Price-to-Book (P/B) Ratio or enterprise valuation metrics like EV/Revenue, EV/EBIT, or EV/EBITDA, it focuses directly on earnings, which often drive shareholder value. It’s preferred when earnings are reliable and provide a clearer profitability picture. Other metrics may be better for companies with negative earnings or high depreciation costs, but the P/E Multiple remains the go-to tool for quick comparisons and market insights.
Comparing the Two Types of P/E Multiples
Investors use P/E multiples to measure a company’s value. Trailing P/E and forward P/E are the two main types. Both offer unique insights into a company’s performance and growth potential. Comparing these two helps investors make smarter decisions.
Trailing Price-to-Earnings
Trailing price-to-earnings looks at a company’s past performance. It uses earnings from the last 12 months to calculate the ratio. This makes it a reliable metric since it’s based on actual results. Investors use trailing price-to-earnings to assess how the market values a company based on its historical earnings. It’s especially useful for companies with consistent earnings history.
Forward Price-to-Earnings
Forward price-to-earning focuses on future expectations. It uses projected earnings for the next 12 months. This ratio helps investors understand how the market values a company’s growth potential. Forward price-to-earnings can be helpful when assessing high-growth companies or businesses undergoing significant changes. However, it relies on estimates, which may only sometimes be accurate.
Use trailing price-to-earnings to evaluate a company’s current performance and compare it to competitors. It’s ideal for established companies with steady earnings. Forward price-to-earnings is better for analyzing growth potential or future profitability. It’s particularly useful in industries where rapid changes or innovation drive earnings. Combining both can give a fuller picture of a company’s value.
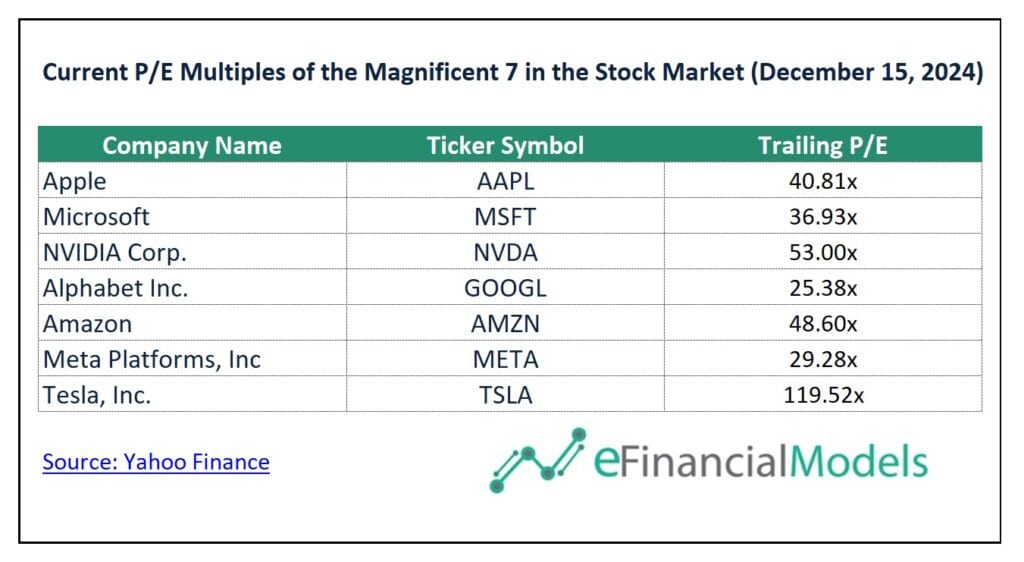
The chart shows the Magnificent 7 – the most influential companies in the global stock market. These companies include Apple, Microsoft, NVIDIA, Alphabet, Amazon, Meta, and Tesla. They dominate due to their massive market capitalization, innovation, and global reach. Notice that trailing P/E is often higher than forward P/E because it reflects past earnings, which can lag behind expected growth. Forward P/E assumes earnings will increase, lowering the ratio.
What is a Good Price-to-Earnings Multiple?
The Price-to-Earnings (P/E) multiple shows how much investors will pay for $1 of a company’s earnings. A “good” P/E multiple depends on the company’s market conditions, industry, and growth potential. Typically, high-growth industries have higher P/E multiples, while mature sectors have lower ones.
A good price-to-earnings multiple for investing depends on balancing value and growth. Low price-to-earnings multiples might signal undervalued companies with solid fundamentals. However, those extremely low could also indicate trouble, so research is key. Growth investors may prefer higher price-to-earnings multiples if the company shows strong future earnings potential.
When buying an entire company, a good P/E multiple reflects the expected return on investment. Buyers usually seek lower multiples to maximize profitability, especially in acquisitions where cash flow matters most. However, paying a slightly higher P/E may make sense for businesses with strong growth prospects or unique advantages. When setting a fair multiple, the focus shifts to the potential for earnings growth, cost synergies, and long-term value creation.
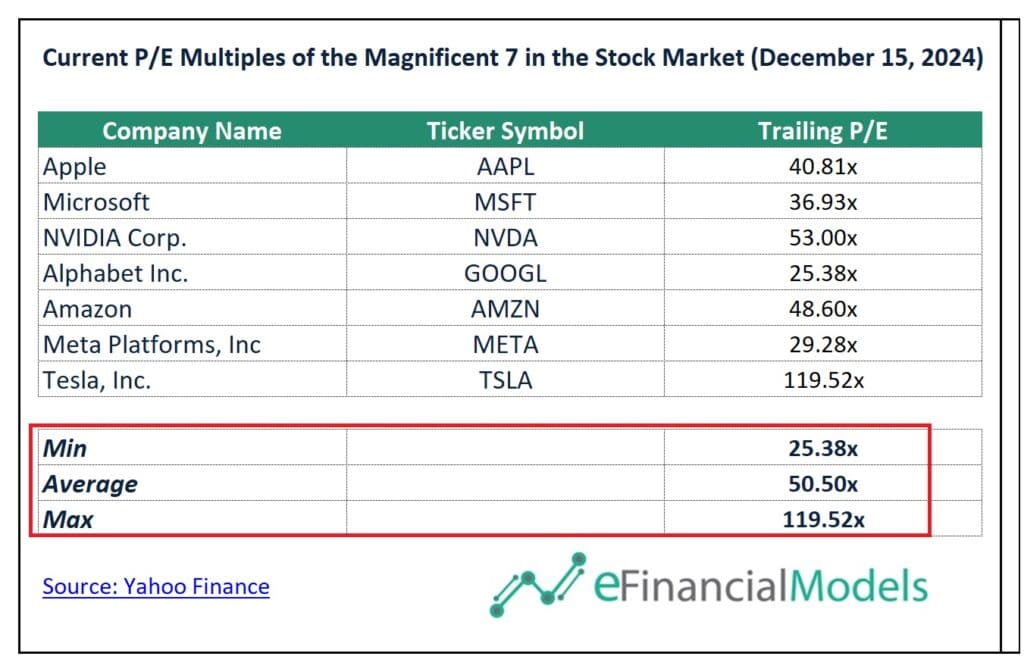
A good P/E multiple depends on context, but the Magnificent 7 shows much higher P/E multiples than market averages. The chart highlights a minimum trailing P/E of 25.38x, an average of 50.50x, and a maximum of 119.52x. These tech giants trade at high valuations because investors expect strong earnings growth and innovation. Higher multiples reflect their dominant market positions, superior revenue growth, and future potential. Compared to mature industries, these companies justify elevated price-to-earnings multiples due to their consistent performance and ability to scale globally.
General benchmarks for a “good” price-to-earnings multiple is an average between 15x to 20x. It often reflects fair valuation in stable markets. A low P/E multiple, typically under 15, may indicate undervaluation or limited growth potential. On the other hand, a high P/E multiple, above 20, suggests strong growth expectations, though it could also point to potential overvaluation, a factor that should be approached with caution.
Pro-tips: Comparing a company’s P/E with its peers provides valuable insights into whether it’s overvalued or undervalued. Always compare the P/E to industry averages and historical trends to identify whether the valuation makes sense for your goals.
The P/E Multiple Calculation
The price-to-earnings multiple compares the price investors pay for a stock to the company’s earnings. There are two ways to calculate it: comparing the stock price to earnings per share or the market capitalization to the net income. The standard formula for the P/E Multiple calculation measures how much investors will pay for each dollar of earnings. It is calculated as:
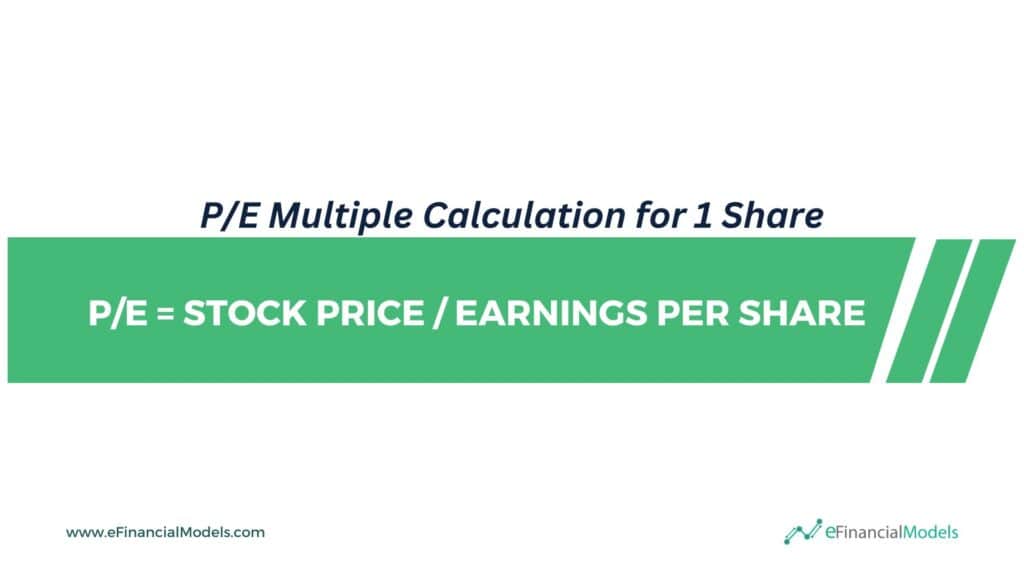
Where:
- Stock Price represents the market’s valuation of a single share
- Earnings Per Share (EPS) reflects the company’s profit allocated to each outstanding share. It is calculated by dividing a company’s net earnings by its number of outstanding shares.
For example, if a stock costs $50 and its EPS is $5, its P/E Multiple is $50/$10 or 5x. This means the stock trades five times its earnings, showing what investors expect from its growth. Alternatively, for the entire company, the P/E Multiple calculation is:

Where:
- Market Cap is the total value of the company’s shares. Multiply the share price by the number of shares. It shows what the market thinks the company is worth.
- Net Earnings is the profit the company makes after all expenses. It’s the “bottom line” on the income statement.
We use this formula to find the P/E Exit Multiple. It helps value the entire company, especially for exit strategies or when selling.
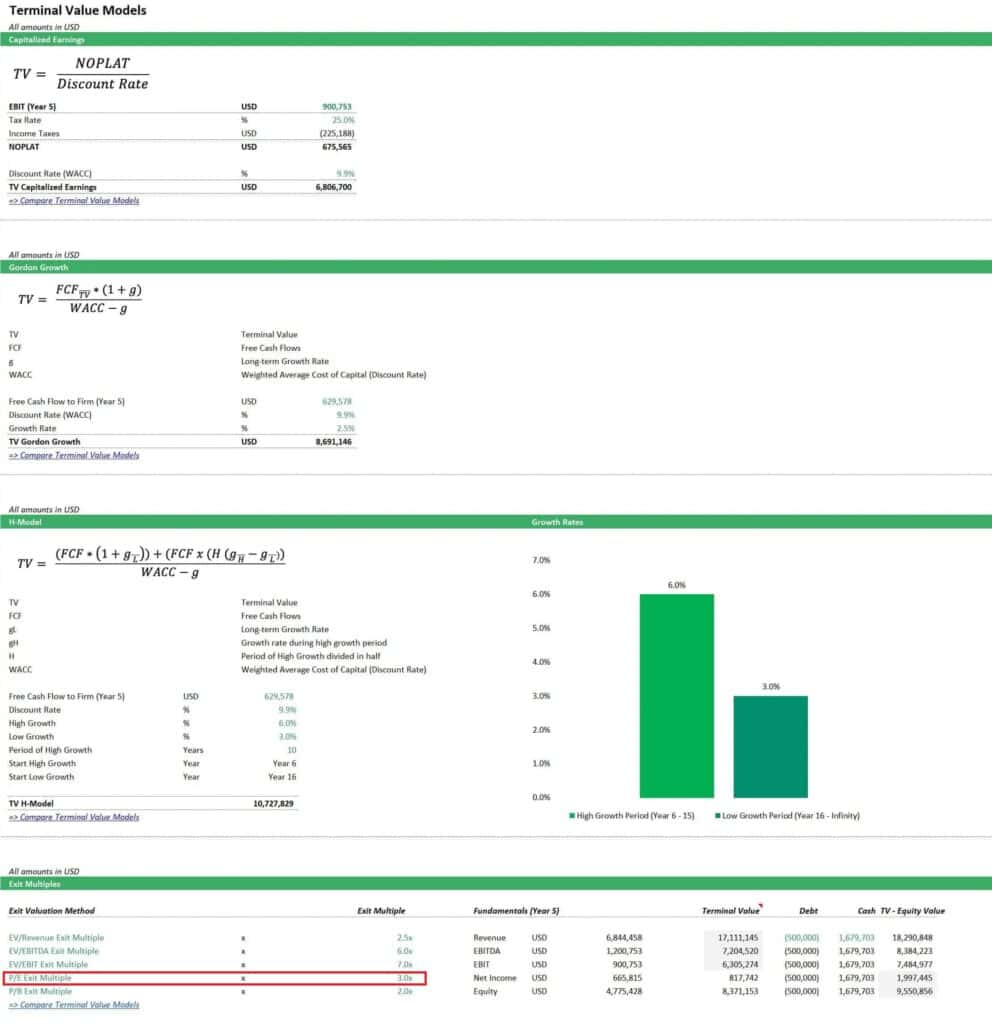
This Discounted Cash Flow (DCF) Valuation Model uses multiple methods to calculate the terminal and final equity values (market cap). The equity value is $9,558,385 under the P/E Exit Multiple row. The net earnings (net income) for the year are $603,213. The P/E Exit Multiple is 3.0x, which means the equity value is three times the net income in the final year. This multiple is lower than general market P/E benchmarks because it likely reflects slower long-term growth expectations or specific company risks, reducing valuation. A lower P/E suggests investors are less willing to pay a premium for future earnings, often due to lower profitability or uncertain market prospects.























































Benefits of the Price-To-Earnings Multiple
The Price-To-Earnings (P/E) multiple is widely used for evaluating stocks. It helps investors quickly compare a company’s market price to its earnings. This ratio shows how much investors will pay for each dollar of earnings. Its simplicity and usefulness make it a go-to metric in financial analysis.
- Broad Applicability: The price-to-earnings multiple works across many industries. Whether you analyze tech firms, consumer goods, or financial institutions, this metric provides valuable insights. Its versatility allows investors to compare companies of different sizes and sectors. This broad scope makes it essential for building a diversified portfolio.
- Easy to Calculate: You can calculate the price-to-earnings multiple with just two numbers. Its straightforward formula means you don’t need advanced tools to use it. This simplicity makes it accessible to both new and experienced investors.
- Quick Insights: The price-to-earnings multiple delivers insights at a glance. A high P/E suggests growth potential, while a low price-to-earnings may indicate undervaluation. Investors can quickly identify opportunities or risks using this ratio. It serves as a starting point for deeper analysis, saving time in the decision-making process.

Limitations of the Price-To-Earnings Multiple
The price-to-earnings multiple is helpful but not perfect. It only shows part of the picture. Relying on it alone can lead to poor investment decisions. Understanding its limitations is crucial for making better financial choices.
- Earnings Volatility: If a company’s earnings are negative, the price-to-earnings multiple becomes meaningless. Earnings can fluctuate. Companies with unstable profits may show misleading price-to-earnings multiples. Seasonal businesses or firms in volatile industries often produce distorted results. This makes it harder to evaluate their true value.
- Industry Variations: Price-to-earnings multiple vary widely across industries. A high price-to-earnings multiple in one sector may be normal, while it signals overvaluation in another. Comparing companies must consider their industry context to avoid inaccurate conclusions. Always analyze within the right framework.
- Subject to Manipulation: Companies can manipulate earnings to influence their price-to-earnings multiple. They can adjust depreciation expenses to influence net income. Differences in debt and equity financing can distort earnings. For example, highly leveraged companies may have higher interest expenses, reducing net income and inflating the price-to-earnings multiple. Furthermore, companies with effective tax strategies might report higher net income than those with less optimized structures, creating an illusion of lower P/E multiples. All these create a false sense of value for investors. It’s important to look beyond the numbers for a clearer picture.

How to Use the P/E Multiple Effectively
The P/E multiple is a simple yet powerful tool. It compares a company’s stock price to its earnings per share. A lower P/E can indicate an undervalued stock, but context matters. To spot undervalued opportunities, use the P/E multiple alongside other factors to avoid common pitfalls.
- Analyze Earnings Growth Potential: Evaluate the company’s growth to gauge future potential. A stock with a low P/E but strong earnings growth may be undervalued. Look at past trends and projections to assess whether the company can sustain or improve earnings. Growth prospects are key to making informed decisions.
- Cross-Check with Other Metrics: Never rely on the P/E multiple alone. Compare it with other financial metrics like the PEG ratio or return on equity (ROE). These additional metrics provide a clearer picture of the company’s performance and value. This approach minimizes the risk of misjudging a stock.
- Compare with Industry Averages: Place the P/E multiple in context by comparing it to industry averages. A low P/E in a growing industry might signal an opportunity, while a high P/E could be justified in certain sectors. Industry benchmarks help refine your analysis and avoid misleading conclusions.
- Consider Market Conditions: Market conditions significantly influence P/E multiples. They tend to rise in a bullish market, while bearish trends may push them lower. Assess broader economic trends to understand whether the stock’s valuation aligns with the current environment.
- Understand the Business: Go beyond numbers to understand the company’s operations, competitive edge, and risks. A company with a low P/E might face challenges that explain its valuation. Understanding the business ensures your investment aligns with your strategy and risk tolerance.

Elevate P/E Analysis with Advanced Financial Models
The price-to-earnings multiple is a straightforward and essential tool for investors to identify undervalued stocks quickly. By comparing a stock’s market price to its earnings per share, it offers instant insights into valuation, growth potential, and market expectations. A low P/E often indicates hidden opportunities, while a high P/E can signal overvaluation. However, its effectiveness improves with metrics like the PEG ratio or industry benchmarks.
While easy to calculate and versatile, the P/E multiple has limitations, such as earnings volatility and susceptibility to manipulation. To overcome these challenges, consider using financial model templates. A well-designed template allows you to incorporate multiple metrics, forecast future performance, and account for nuances like tax strategies and capital structure. By combining the P/E multiple with robust financial modeling, you can make informed investment decisions more confidently. Start your journey to smarter investing today by leveraging professional financial model templates to fine-tune your stock valuation strategy.












































You might also like:
- 10 Tips to Develop a First Class Business Valuation Report
- 12 BUSINESS VALUATION METHODS
- How to Value a Business Using a Discounted Cash Flow Model
- Finding a Valuation Model for Your Business
- Real Estate Financial Modeling in Excel
- Recent Transaction Multiples Analysis for Distilleries
- Free eBook: How to Prepare a Financial Feasibility Study for Coffee Farming?
- Business Valuation Service
- How to Prepare a Financial Feasibility Study?
- How Contribution Margin Analysis Can Drive Your Business to Financial Success
- Calculating Revenue Growth Rate: A Key Metric for Business Success
- 10 Ideas to Increase Average Revenue Per User
- Understanding the Levelized Cost of Energy Formula
- Detailed Guide to Understanding the Costs of Equity Financing
- Fundraising Project Plan Template in Excel
- Financial Modeling using Excel
- Key Financial Ratios
- How to Build a Capitalization Table
- Understanding Debt Sizing & Project Finance Ratios
- Top 10 Mistakes in DCF Valuation Models
Tags: Investment Analysis