
0 ITEMS

Why Does Price-To-Book Value Matter for Banks?

The Price-to-Book Value is a key metric for evaluating bank valuation and financial health.
- It compares a bank’s market price per share to its book value, indicating whether it is over- or undervalued.
- Banks with high P/B multiples usually have strong asset quality and profitability, while low multiples may signal risks or market concerns.
- The ratio helps investors assess asset quality, market confidence, and operational efficiency.
- Limitations include differences in accounting standards and the exclusion of intangible assets.
- Using financial models alongside P/B analysis offers a deeper, more accurate view of bank performance.
This article provides practical insights on how to leverage the P/B ratio for better investment decisions.
The Basics of Price-To-Book Value
The price-to-book value measures a company’s market value relative to its book value. It divides a company’s market price per share by its book value per share. The market price per share is the current price at which a single share of a company’s stock is traded on the stock market. At the same time, book value per share represents the value of a company’s net assets allocated to each outstanding share of stock.
The price-to-book value is also called the price-to-book multiple. This valuation multiple highlights the comparison between the market price and the book value. It shows how often the book value investors are willing to pay for each share. The “multiple” aspect makes it easier for investors to compare across companies and industries, as it expresses valuation as a relative factor, not just a standalone number. It helps investors determine if a stock is overvalued or undervalued compared to its actual worth on paper.

Price-to-Book Multiple: How are Banks Valued?
The Price-to-Book Multiple (P/B Multiple) is a common metric to value banks. It compares a bank’s market value to its book value. The P/B Multiple helps investors determine if a bank is undervalued or overvalued. Since banks hold significant assets and liabilities on their balance sheets, the P/B multiple provides a clear picture of their intrinsic worth relative to their market price.
The Price-to-Book Multiple has two main components: the market price per share and the book value per share. It is calculated by dividing the market price per share by the book value per share. These values provide insight into a bank’s valuation and are essential to understanding the P/B multiple.

Market Price Per Share
The market price per share is the current trading price of a single share of a bank’s stock. It reflects the market’s willingness to pay for one share based on supply, demand, and investor sentiment. Investors can find this price on stock exchanges (NYSE or NASDAQ), financial news platforms, or the bank’s investor relations page. To understand its relation to market value, market price per share equals market capitalization divided by outstanding shares.

Where:
- Market Capitalization is the company’s total value in the market.
- Outstanding Shares are the total shares currently held by investors.
For example, if a company’s market cap is $1 billion and it has 10 million shares outstanding, the market value per share is $100.

Book Value Per Share
Book value per share shows the value of a share based on the bank’s net assets. It represents the equity value of the bank divided by the number of outstanding shares. This value indicates what each share would be worth if the bank liquidated its assets and paid its debts.

Where:
- Total Shareholders’ Equity can be found on the company’s balance sheet. It is calculated by subtracting total liabilities from total assets.
- Number of Outstanding Shares is the total number of shares currently held by shareholders.
For example, if a company has a total shareholders’ equity of $500 million and its outstanding shares are 50 million, the book value per share is $10.

Price-to-Book Multiple is particularly useful to how are banks valued because their balance sheets are largely made of tangible assets like loans and securities, making book value a reliable measure of their intrinsic worth. A larger asset base enables banks to manage withdrawals and maintain trust among depositors. Regulatory frameworks also require banks to maintain sufficient capital relative to their assets to absorb potential losses.

The chart highlights how are banks valued using the price-to-book multiple. Among the top 10 banks globally, JP Morgan Chase leads with a P/B of 2.08x, followed by Morgan Stanley (2.19x) and Charles Schwab (3.83x), reflecting their stronger market valuations relative to their book value. In contrast, Chinese banks like the Industrial and Commercial Bank of China (0.42x) and Bank of China Ltd (0.40x) show lower P/Bs, indicating undervaluation or market concerns. U.S. banks, including Bank of America (1.29x) and Wells Fargo (1.42x), maintain mid-range P/B multiples. This comparison provides a clear snapshot of investor confidence and bank performance across key financial institutions worldwide.























































What Is a Good Price-to-Book Value?
A good price-to-book value depends on the industry and the company’s financial health. Generally, a multiple below 1.0x could signal undervaluation. In contrast, a ratio above 1.0 suggests investors see growth potential. However, context matters—consider profitability, debt levels, and industry trends when evaluating the P/B Multiple.
A P/B Multiple between 1.0x and 1.5x is often considered good for banks. Banks rely on tangible assets, making their book value a reliable measure of worth. A lower multiple (below 1.0x) may indicate financial troubles, while a higher multiple (above 1.0x) can signal strong profitability or growth expectations. Investors also assess a bank’s loan quality, earnings consistency, and economic conditions when interpreting its P/B Multiple.
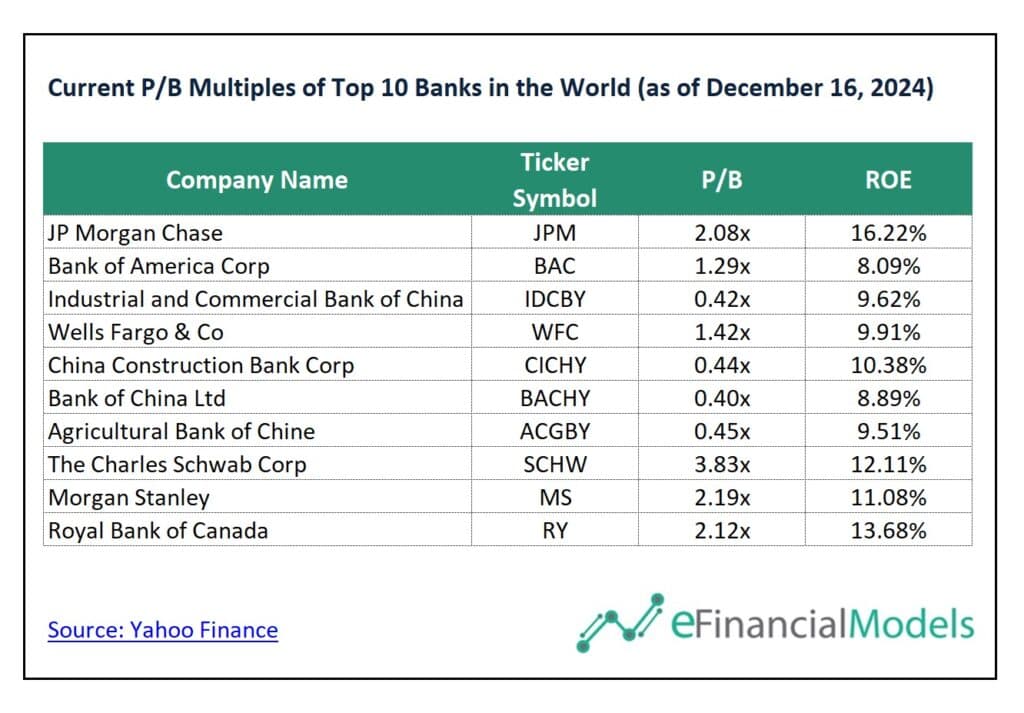
The chart shows the P/B Multiples for the top 10 banks worldwide as of December 16, 2024. Banks like Bank of China Ltd (0.40x) and Industrial and Commercial Bank of China (0.42x) have low P/B values, showing they may be undervalued. Meanwhile, The Charles Schwab Corp (3.83x) and Morgan Stanley (2.19x) have high P/B ratios, signaling they are priced at a premium. The average P/B across all these banks is 1.46x, with a minimum of 0.40x and a maximum of 3.83x.
Why Is the Price-to-Book Multiple Critical for Banks?
Investors use the P/B multiple to evaluate whether a bank provides a strong return on equity (ROE) relative to its book value, identifying risk-adjusted opportunities. A higher ROE typically results in a higher P/B multiple, signaling that the bank is generating superior returns on its equity compared to its book value. This connection helps investors assess the bank’s financial health and growth potential, guiding their decisions on whether the investment offers adequate returns for the associated risks.
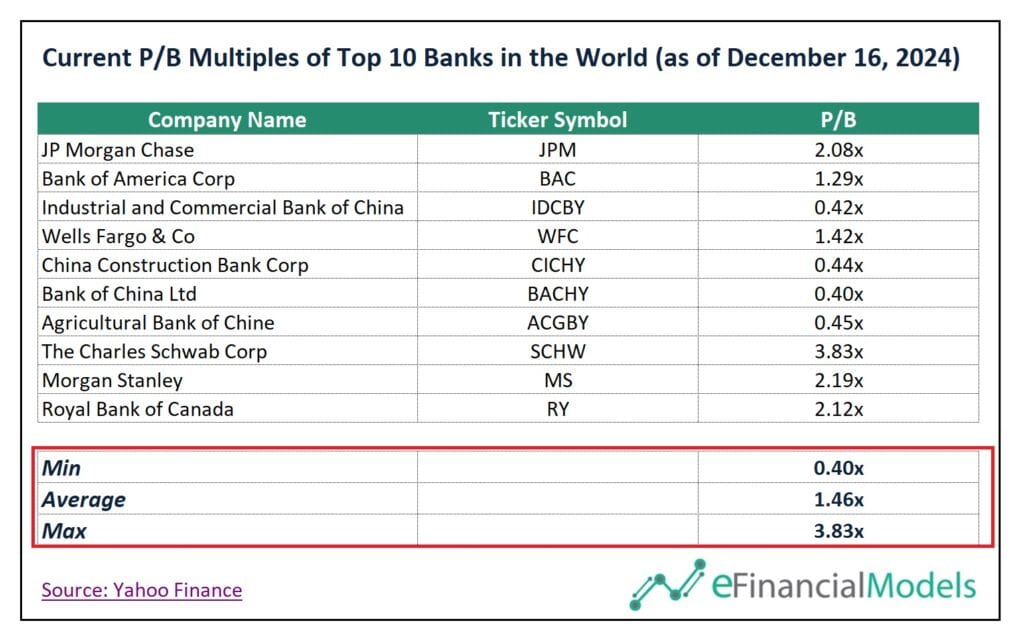
The chart above shows that P/B multiples typically react to ROE. For instance, JP Morgan Chase has a high P/B multiple (2.08x), which aligns with its strong ROE (16.22%). It reflects that the bank is delivering strong returns on equity, justifying its higher market valuation. A higher ROE often leads to a higher P/B multiple, signaling a bank’s strong ability to generate returns relative to its book value. In some cases, the P/B multiple and ROE values differ in proportion because each bank has unique market expectations and risk profiles.
Indicates Financial Health
The P/B Multiple helps gauge a bank’s financial health. Banks with strong balance sheets and fewer bad loans often have higher P/B multiples. Investors rely on this measure to assess whether the bank is fundamentally strong or struggling with underlying issues that could erode shareholder value.
For example, a bank with a P/B Multiple of 1.5x compared to its peers at 1.0x might reflect stronger asset quality, fewer non-performing loans, and consistent profitability. This indicates the market’s confidence in the bank’s ability to generate shareholder value. Conversely, a bank with a P/B multiple of 0.6x might grapple with significant financial issues, such as declining revenues or regulatory penalties, raising concerns about its long-term viability. Investors use this metric to differentiate between fundamentally sound banks and those facing potential challenges.
Measures Market Confidence
The P/B Multiple captures investor confidence in a bank’s future. A ratio above 1 indicates that the market expects the bank to generate high returns. If it’s below 1, it might show pessimism about growth or efficiency. This insight is essential for understanding market sentiment.
A bank trading at a P/B Multiple of 1.8x suggests that investors believe it will outperform in profitability, innovation, or operational efficiency compared to its peers. On the other hand, a bank with a P/B Multiple of 0.7x might indicate skepticism about its ability to grow or efficiently manage its resources, potentially due to high non-performing loans or limited market presence. This metric helps investors align their expectations with market sentiment, offering a snapshot of perceived future performance.
Reflects Asset Quality
The P/B Multiple reveals the market’s perception of a bank’s asset quality. Banks hold significant tangible assets like loans, real estate, and securities. A high P/B multiple suggests confidence in the value and performance of these assets. Conversely, a low multiple may signal doubts about asset stability or potential risks, making it a critical metric to evaluate.
For instance, a bank with a P/B Multiple of 1.4x suggests that investors have strong confidence in its tangible assets, such as loans and real estate, performing well and holding their value. This could reflect low default rates and effective risk management. On the other hand, a bank with a P/B Multiple of 0.6x might signal concerns about poor-quality assets, such as a high proportion of non-performing loans or depreciating real estate holdings, raising doubts about the bank’s financial stability. This insight helps investors gauge the reliability and strength of a bank’s underlying assets.
Simplifies Peer Comparisons
The P/B Multiple is widely used to compare banks. Since banks operate in a highly regulated and asset-heavy industry, the metric offers a standardized way to benchmark performance. It allows investors to quickly identify which banks are outperforming or underperforming in their sector.
For example, if Bank A has a P/B Multiple of 1.3x and Bank B has a P/B Multiple of 0.9x, investors can infer that the market values Bank A’s equity and asset management more favorably. This might be due to Bank A’s higher return on equity or lower default rates compared to Bank B. On the other hand, Bank B’s lower P/B Multiple might indicate potential issues like higher risk exposure or weaker profitability. This standardized metric helps investors quickly compare banks in the same sector and prioritize further analysis.

Limitations of Price-To-Book Value for Banks
The price-to-book multiple is often used to evaluate bank stocks but has key limitations.
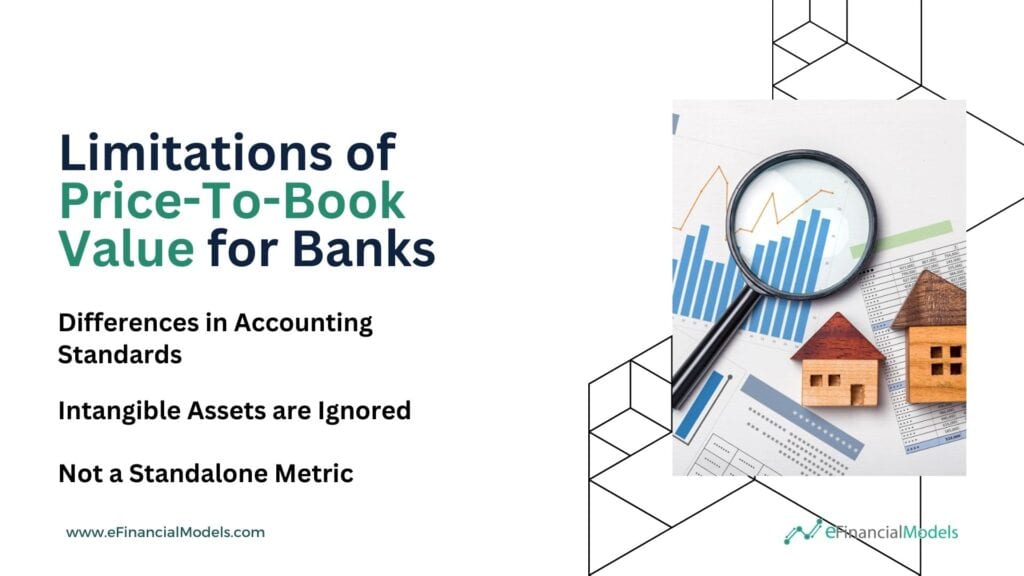
- Differences in Accounting Standards: Book value can be affected by accounting practices. For instance, banks using conservative accounting methods may report lower book values, artificially inflating their P/B Multiple.
- Intangible Assets are Ignored: P/B ratios don’t account for intangible assets like brand value or customer relationships. This can lead to undervaluation for banks with significant goodwill or intellectual property.
- Not a Standalone Metric: While valuable, the price-to-book multiple shouldn’t be the sole basis for investment decisions. It’s most effective alongside other metrics like ROE, P/E Multiple, and risk assessments.
Leverage Financial Models to Elevate Price-to-Book Value Analysis
The Price-to-Book Value is a key metric for assessing a bank’s financial health and market valuation. It compares a bank’s market price per share to its book value per share, helping investors determine if its stock is overvalued or undervalued. The P/B Multiple is critical because banks’ balance sheets are asset-heavy, making book value a reliable indicator of worth. High P/B Multiples suggest market confidence in a bank’s profitability and asset quality, while low values indicate potential risks or undervaluation.
Though valuable for comparisons and gauging market sentiment, Price-to-Book Value should be used alongside other indicators like ROE and P/E ratios to ensure comprehensive analysis. For instance, mega-banks with enormous asset sizes often have lower P/B Multiples due to their diversified operations and reduced growth prospects. These institutions are viewed as safer investments but lack the agility of smaller banks.
Leverage financial models to enhance your Price-to-Book Value analysis and make informed decisions. These models provide deeper insights into a bank’s financial health, profitability, and asset quality. Use them to compare P/B Multiples across banks, assess risks, and identify undervalued opportunities. Financial models simplify complex data and improve investment strategies by integrating key metrics like ROE and P/E ratios. Take advantage of these tools to unlock the full potential of the P/B value and gain a competitive edge in the financial sector.
You might also like:
- 10 Tips to Develop a First Class Business Valuation Report
- 10 Main Elements of a Business Plan
- 12 Funding Sources for Businesses and Startups
- 5 Steps to Create a Drop Down List Using Data Validation in Excel
- How to Value a Business Using a Discounted Cash Flow Model
- Financial Ratios Analysis and Its Importance
- Finding Fair Market Value: A Quick Guide to Real Estate Valuation
- Why Should You Use Excel for Financial Modeling?
- Understanding the Debt Service Coverage Ratio: An Essential Metric for Financial Analysis
- How to Prepare a Financial Plan for a Chicken Egg Farm?
- Financial Modeling for Startups and Small Businesses
- Cash Flow Analysis in Excel
- Price Sensitivity Analysis: Get More Revenue by Changing Your Prices
- How to Raise Series A Funding?
- 10 Ideas to Increase Average Revenue Per User
- Achieve Financial Success By Knowing Your Business Plan Model
- Creating a Budget Plan – Using the Best Excel Budget Template
- How to Write a Killer Mobile App Business Plan
- Understanding What is Yield to Maturity and Why It Matters
- Tourism Project Financial Model Template