
0 ITEMS

Fintech Financial Model Excel Template
The Fintech Startup Financial Model helps founders, analysts, consultants, and business planners turn a fintech lending concept into a structured five-year financial forecast. Instead of relying on scattered assumptions or a generic spreadsheet, users can organize the key drivers of a fintech business in one editable model, including loan origination volumes, interest income, funding costs, revenue streams, operating expenses, payroll, capital needs, cash flow, profitability, and investor return metrics. It is designed to support business planning, funding preparation, internal budgeting, and strategic decision-making. This financial model template is especially useful for entrepreneurs building a digital lending platform, neobank-style credit product, embedded finance solution, or other fintech business that depends on loan growth, customer acquisition, interest rate spreads, fee income, and disciplined cash management. The model helps users estimate startup costs, technology setup expenses, compliance-related investments, fixed overhead, variable costs, and staffing requirements while connecting those assumptions to projected financial statements and performance outputs. It gives users a more practical way to understand whether the business can scale sustainably. The template also supports investor and lender communication by presenting financial planning outputs in a clear, professional format. Users can review revenue assumptions, test low, base, and high scenarios, assess profitability timing, evaluate break-even analysis, and understand how changes in loan volume, pricing, payroll, acquisition costs, and funding structure affect the overall business case. This makes it easier to prepare pitch materials, business plans, funding documents, board updates, and internal financial reviews without building a model from scratch. Fully customizable and ready to use in Excel or Google Sheets, the Fintech Startup Financial Model gives users control over the assumptions while keeping the structure organized and investor-ready. It helps replace guesswork with a connected planning framework, allowing founders and finance teams to review cash flow, operating performance, projected financial statements, key fintech metrics, and long-term profitability before making major decisions about launch, fundraising, hiring, product expansion, or growth strategy.
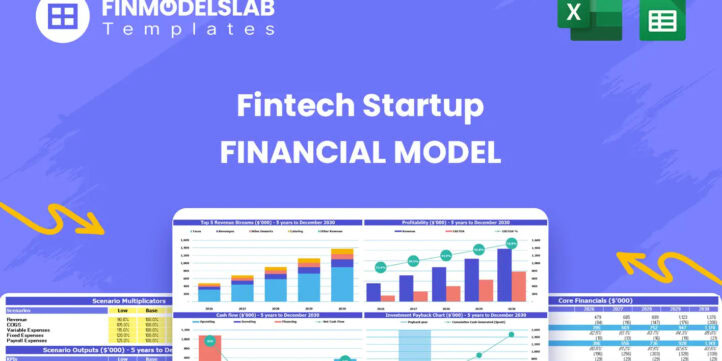


Financial Model Overview
The Fintech Startup Financial Model is a ready-to-use financial model template built for founders, entrepreneurs, consultants, analysts, and business owners planning a fintech lending business. It gives users a structured way to forecast the financial performance of a startup that depends on loan originations, interest rate spreads, deposit or debt funding, fee income, technology investment, regulatory readiness, operating expenses, payroll, cash flow management, and investor returns. Instead of starting with a blank spreadsheet, users can work from a pre-built model designed around the realities of a growing fintech lender. The template helps translate business assumptions into five-year financial projections, monthly and annual outputs, profitability analysis, bank-ready reports, and decision-ready dashboards. It is fully editable, compatible with Excel and Google Sheets, and useful for business plans, pitch decks, funding discussions, lender reviews, budgeting, and internal strategy meetings.
All-in-One Dashboard
The all-in-one dashboard brings the most important inputs and outputs of the Fintech Startup Financial Model into one central view, helping users move quickly from assumptions to financial insight. This section is designed to summarize the key drivers of the business, such as loan origination growth, interest income, funding costs, operating expenses, payroll, cash balance, EBITDA, net income, and investor return indicators. Users can adjust core assumptions in the model and immediately see how those changes flow into the forecast. For a fintech startup, this is especially useful because the business can be sensitive to relatively small changes in loan volume, net interest margin, customer acquisition cost, default assumptions, and staffing plans. The dashboard helps founders and advisors review the overall business case without getting lost in individual tabs, making it easier to identify whether the company has a credible path to scale, sufficient liquidity, and a realistic profitability timeline.
Low, Base, and High Scenario Analysis
The low, base, and high scenario analysis component helps users test how the fintech startup may perform under different market and execution conditions. Rather than building a single forecast that assumes everything goes exactly as planned, this section allows users to compare conservative, expected, and optimistic cases. Inputs may include loan origination volumes, approval rates, interest rate spreads, customer adoption, fee income, operating costs, hiring pace, funding costs, and capital expenditure timing. The outputs help show how revenue, cash flow, EBITDA, profitability, funding needs, and investor returns change across scenarios. This is valuable for fundraising because investors often want to understand downside protection as well as upside potential. It is also useful for internal decision-making, allowing the leadership team to assess whether the business can remain viable if growth is slower, costs are higher, or funding is more expensive than expected.
Professional Charts
The professional charts section turns the financial forecast into visual outputs that are easier to review, discuss, and present. Fintech models can include complex relationships between loan portfolio growth, net interest income, fee revenue, deposits, operating expenses, payroll, capital needs, and cash flow, so charts help make those relationships more understandable. This component may display trends such as revenue growth, EBITDA progression, cash balance movement, loan book expansion, cost structure, profitability improvement, and key performance metrics over the forecast period. These visual reports are useful for investor meetings, lender presentations, board updates, internal planning sessions, and monthly performance reviews. They help users communicate the story behind the numbers, showing how the fintech startup moves from initial investment and early losses toward scale, stronger margins, and improved profitability. Instead of exporting raw tables only, users can present polished charts that support a more professional financial narrative.
ROE Components and DuPont Analysis
The ROE components and DuPont analysis section helps users understand what is driving return on equity in the fintech startup. Return on equity is an important metric for financial services businesses because it shows how effectively the company uses shareholder capital to generate profit. This component breaks ROE into underlying drivers, which may include profit margin, asset utilization, and leverage. For a fintech lender, those drivers can be influenced by net interest margin, loan portfolio growth, fee income, credit performance, operating efficiency, deposit or debt funding, and retained earnings. The outputs help users see whether returns are being created through healthy profitability, efficient asset growth, or higher leverage. This is useful for strategic planning because a fintech startup must balance growth with risk, capital requirements, and funding structure. Investors and lenders can also use the analysis to assess whether the business model has the potential to produce attractive, sustainable returns as it scales.
Revenue Inputs
The revenue inputs section is where users define the assumptions that drive the fintech startup’s income forecast. For a lending-focused fintech business, revenue may be built around net interest income, loan origination volume, average loan size, interest rates earned on assets, interest paid on funding sources, origination fees, servicing fees, account fees, transaction fees, and other non-interest income. This component helps users document and adjust the commercial assumptions behind the forecast instead of relying on a single top-line growth percentage. It can include assumptions for personal loans, small business loans, secured credit lines, or other financial products that the company plans to offer. By connecting revenue assumptions to operational drivers, the model helps users understand what level of customer demand, product adoption, loan growth, and pricing is needed to support the business plan. This is important for both planning and fundraising because revenue credibility often depends on clearly explaining where income comes from and how it scales over time.
Bank-Ready Reports
The bank-ready reports section provides structured financial outputs that can be shared with lenders, financing partners, investors, advisors, and other stakeholders. These reports may include projected income statements, cash flow forecasts, balance sheets, financing summaries, profitability outputs, and key financial metrics over the forecast period. For a fintech startup, bank-ready reporting is especially important because the business may need warehouse lines, debt facilities, customer deposit strategies, investor capital, or other financing arrangements to support loan growth. This component helps present the company’s financial position in a format that is easier for professional stakeholders to evaluate. Users can review whether the business generates enough revenue to cover expenses, how cash balances evolve, how assets and liabilities grow, and how funding requirements develop as loan originations increase. The reports support more credible funding conversations by showing that assumptions are organized, linked, and translated into complete financial statements.
Revenue Breakdown
The revenue breakdown section gives users a detailed view of how different income streams contribute to total revenue. Instead of treating revenue as one broad line item, this component separates the sources of income that may matter most for a fintech startup, such as interest income from personal loans, small business loans, secured credit lines, origination fees, servicing revenue, subscription fees, transaction fees, interchange-style income, or other platform-based earnings. Inputs can be tailored to match the specific business model, allowing users to adjust pricing, product mix, customer volume, loan size, utilization, and growth assumptions. The outputs help show which products or revenue streams create the largest financial impact and how the revenue mix changes over time. This is useful for strategy and decision-making because a fintech founder may need to prioritize the products that generate the best margins, scale efficiently, reduce concentration risk, or strengthen the investor story. It also helps identify whether the company is overly dependent on one revenue source.
KPI Dashboard
The KPI dashboard tracks the performance indicators that matter most for a fintech startup and helps users compare projected performance against internal targets or market expectations. Depending on the business model, KPIs may include loan origination volume, active customers, average loan size, net interest margin, revenue per customer, customer acquisition cost, operating expense ratio, EBITDA margin, cash runway, default or loss assumptions, payback period, return on equity, and other fintech-specific metrics. This component is useful because financial statements alone may not explain whether the business is operating efficiently or scaling in a healthy way. The KPI dashboard helps founders, finance teams, and advisors monitor the drivers behind revenue, profitability, liquidity, and growth. It can support investor updates, management reviews, and strategic planning by showing whether the business is moving toward sustainable performance. For decision-making, it helps users identify pressure points early, such as rising acquisition costs, weak margins, slower loan growth, or insufficient cash runway.
Startup Costs and CAPEX
The startup costs and CAPEX section organizes the upfront investment required to launch and prepare the fintech business for operations. A fintech startup often faces significant early costs before meaningful revenue begins, including core banking or lending system integration, server infrastructure, data analytics tools, compliance setup, legal work, licensing, cybersecurity, office setup, initial marketing, product development, and other technology-related capital expenditures. This component allows users to separate one-time launch costs from recurring operating expenses, which helps create a clearer view of initial funding needs. The outputs can support use-of-funds planning, fundraising targets, and cash flow forecasting by showing how much capital must be available before and during launch. It is also valuable for avoiding early-stage cash shortfalls, because founders can see whether their planned equity raise, debt facility, or startup budget is sufficient to cover setup costs, initial payroll, technology implementation, and working capital while the business ramps up.
Break-Even Analysis
The break-even analysis section helps users identify when the fintech startup may become profitable and what level of revenue, loan growth, margin, and cost control is required to reach that point. This component can use assumptions from the revenue forecast, operating expense plan, payroll schedule, funding costs, fee income, and gross margin or contribution structure to estimate the timing of break-even on an EBITDA or net income basis. For a fintech lender, break-even timing is important because the business may experience early losses while building technology, hiring staff, acquiring customers, and funding loan growth. The outputs help users understand how long the company may need external capital, how much cash runway is required, and which variables most affect the path to profitability. This is useful for investors, lenders, and founders because it connects operational strategy to financial sustainability. It also supports practical decision-making around hiring pace, marketing spend, pricing, product mix, and fundraising timelines.
File types:
Excel – Single-User: .xlsx
Excel – Multi-User: .xlsx
Similar ProductsOther customers were also interested in...


 HenrySheykin
Budget vs Actual Excel Template
The Personal Budgeting App Financial Model Financial Model Template helps founders, entrepreneurs, c... Read more
Inventory Control Software Financial Model Excel T...
The Inventory Management Software Financial Model helps entrepreneurs, founders, consultants, analys... Read more

Business Valuation Expert Financial Model Excel Te...
The Business Valuation for Divorce Financial Model helps users build a structured financial forecast... Read more
Financial Model Excel Template to fight COVID-19
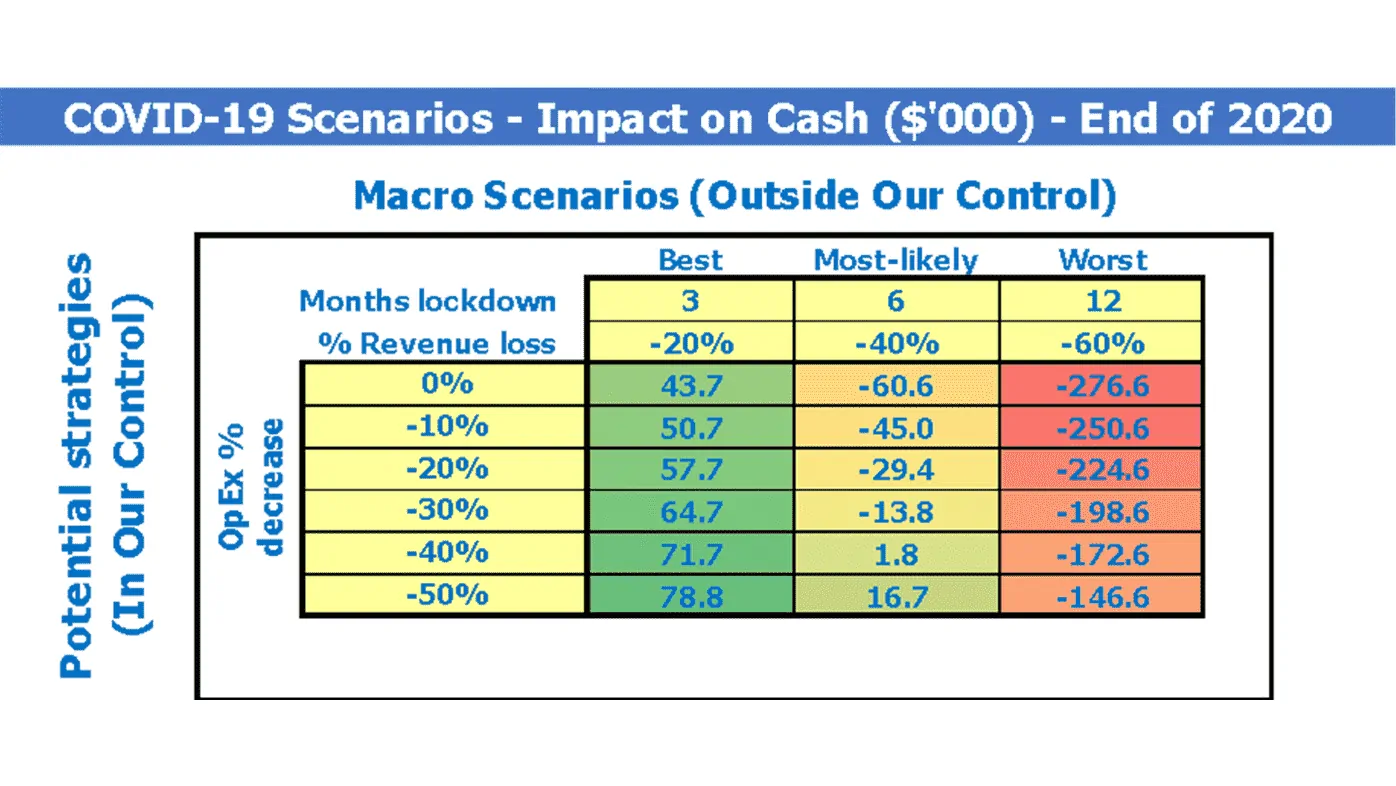
The coronavirus has turned many small and big companies upside down. The decrease in sales, problems... Read more

 Anuj
Anuj
Private Equity Fund Model (Investor Cashflows)
The Private Equity Fund Cashflows Model helps LPs and GPs analyze fund cash flows, returns, and dist... Read more

 Jason Varner
All My Financial Models, Spreadsheets, Templates, ...
Lifetime access to all future templates as well! Here is a set of spreadsheets that have some of the... Read more

 Giorgos
Startup Company Financial Model – 5 Year Fin...
Highly-sophisticated and user-friendly financial model for Startup Companies providing a 5-Year adva... Read more

Advanced Financial Model with DCF and Valuation
Dynamic 10-Year Financial Model, suitable for any type of business, supporting strategic planning, i... Read more

Crowdlending (P2P) Platform – 5 Year Financi...
Financial Model providing an advanced 5-year financial plan for a startup Crowdlending (Peer-to-Peer... Read more

Small Business Playbook (Financial / Tracking Temp...
About the Template Bundle: https://youtu.be/FPj9x-Ahajs These templates were built with the ... Read more
Reviews
 Pharmacy Manager
Business Plan Financial Model Template: This template helps you create projections for up to five years out, with year 1 by months, years 2-3 by quarters, and years 1-5 by entire years.
573 of 1344 people found this review helpful.
Help other customers find the most helpful reviews
Did you find this review helpful?
You must log in to submit a review.