
0 ITEMS

Inventory Control Software Financial Model Excel Template
The Inventory Management Software Financial Model helps entrepreneurs, founders, consultants, analysts, and business owners turn a SaaS inventory platform idea into a structured five-year financial forecast. Instead of starting with a blank spreadsheet, users can work from a ready-to-use model designed around the economics of an inventory management software business, including recurring subscriptions, setup fees, usage-based revenue, cloud infrastructure costs, customer acquisition, payroll, and capital investment. It provides a practical planning framework for estimating revenue assumptions, startup costs, operating expenses, cash flow, profitability, and the funding needed to launch or scale with more confidence. This financial model template is especially useful for anyone preparing a business plan, investor pitch, loan application, internal budget, or strategic growth plan for inventory control, stock optimization, warehouse software, or supply chain management solutions. The model connects key operating assumptions to financial outputs, allowing users to see how pricing, customer growth, conversion rates, churn, marketing spend, staffing, and software development costs affect the overall business outlook. With editable inputs and automated calculations, it helps users test whether their business model can support sustainable growth, reach profitability, and maintain enough liquidity through the early stages. The template supports professional financial planning by organizing the most important numbers into a clear and investor-ready structure. Users can review revenue potential, startup investment, ongoing operating expenses, payroll needs, cash flow movements, projected profit and loss, and balance sheet impact over time. It also helps evaluate break-even analysis, payback period, return metrics, and scenario outcomes, making it easier to compare a conservative plan against a stronger growth case. This is valuable for decision-making because it shows not only what the business could earn, but also what it may cost to acquire customers, support operations, and finance growth. Built to be customizable, the Inventory Management Software Financial Model can be adjusted for different pricing tiers, target markets, customer volumes, product strategies, and funding plans. Whether you are launching a new SaaS company, expanding an existing inventory software product, advising a client, or building financial projections for stakeholders, the template provides a structured way to organize assumptions and communicate the financial story clearly. It saves time, improves forecasting discipline, and gives users a practical basis for evaluating profitability, cash needs, investment timing, and strategic decisions before committing resources.
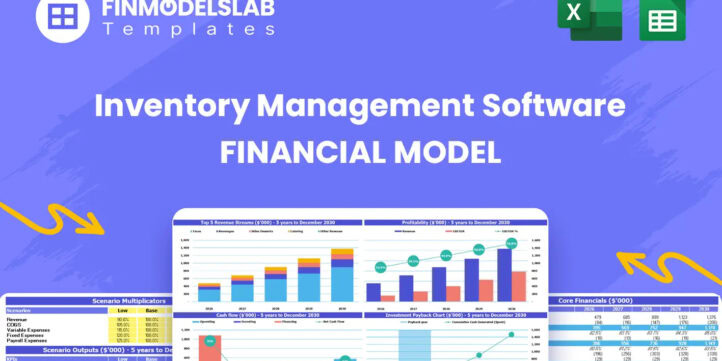


Financial Model Overview
The Inventory Management Software Financial Model is a ready-to-use financial model template built for planning, funding, and managing a SaaS business focused on inventory control, stock optimization, warehouse visibility, and supply chain management. It gives users a structured way to estimate how the business may perform over a five-year period by connecting revenue assumptions, operating expenses, payroll, startup costs, cash flow, profitability, and investment returns in one editable model. For founders and business planners, this is useful because inventory management software businesses often rely on multiple revenue streams, recurring subscription income, customer acquisition efficiency, product development investment, and scalable infrastructure costs. The template helps replace rough estimates with a practical forecasting framework that can be customized for a new launch, an expansion plan, a funding presentation, or an internal budget. Users can update assumptions, review outputs, test different growth cases, and prepare professional financial statements without building a model from scratch.
All-in-One Dashboard
The all-in-one dashboard brings the core inputs and core outputs of the Inventory Management Software Financial Model into one central view, making it easier to understand the overall forecast without moving through every worksheet. This section is designed to summarize the most important assumptions, such as customer growth, pricing tiers, acquisition costs, revenue mix, operating cost levels, payroll plans, and investment needs, then connect those assumptions to key outputs such as revenue, EBITDA, cash balance, profitability, break-even timing, and return metrics. For an inventory management software company, this is especially valuable because the business may include subscription plans, onboarding fees, and transaction-based fees that all influence performance differently. The dashboard helps founders, consultants, analysts, and stakeholders quickly see whether the model supports the business case, whether cash remains sufficient during early growth, and whether the company can scale efficiently. It is useful for management reviews, investor discussions, loan preparation, and fast decision-making because it turns a detailed forecast into a concise financial snapshot.
Low, Base, and High Scenario Analysis
The Low, Base, and High scenario analysis section helps users compare different versions of the forecast under changing market, pricing, and operating assumptions. In the Inventory Management Software Financial Model, scenarios may be built around variations in customer acquisition, conversion rates, churn, average subscription price, enterprise adoption, marketing efficiency, cloud hosting costs, payroll growth, or development spending. The low case can help estimate minimum cash needs and downside risk if sales ramp more slowly than expected, while the base case can represent the most realistic operating plan. The high case can show the financial upside if customer growth, retention, pricing, or upselling performs better than expected. This component is useful because software businesses can be sensitive to a few key drivers, especially customer acquisition cost, recurring revenue growth, and churn. By comparing scenarios, users can identify the assumptions that matter most, prepare more credible funding conversations, set realistic operating targets, and build contingency plans before committing to hiring, marketing, or product development decisions.
Professional Charts
The professional charts section converts financial projections into clear visual reports that are easier to interpret and present to stakeholders. Instead of relying only on rows of numbers, this component helps display trends in revenue, expenses, EBITDA, net profit, cash flow, customer growth, funding requirements, or return performance over time. For an inventory management software business, charts are useful because they can show how recurring revenue builds as the customer base grows, how profitability improves as fixed costs are spread across more users, and how cash flow changes as the company moves through development, launch, and scale-up phases. Inputs from the revenue forecast, expense plan, payroll schedule, capital investment assumptions, and financial statements feed into these visuals, helping users communicate the model in a more accessible way. This component is valuable for investor decks, lender discussions, board updates, and internal strategy meetings because it highlights the financial story behind the business. It also helps users spot trends, compare scenarios, and quickly identify whether the plan is moving toward sustainable profitability.
ROE Components and DuPont Analysis
The ROE components and DuPont analysis section helps users evaluate the quality and drivers of return on equity rather than looking only at final profit numbers. In this part of the Inventory Management Software Financial Model, return on equity may be broken into key components such as profitability, asset efficiency, and leverage, allowing users to understand what is influencing shareholder returns over time. For a SaaS inventory management business, this is useful because returns can be affected by early software development investment, customer acquisition spending, recurring revenue growth, asset-light operations, and financing structure. The model can help show whether improved returns are coming from stronger margins, better use of assets, or higher leverage, which gives founders and investors a more complete view of performance. Inputs may include net income, equity, total assets, revenue, and balance sheet assumptions, while outputs help assess financial efficiency and investment attractiveness. This component supports planning and decision-making by helping users understand whether the business is generating returns through operational strength or relying too heavily on financing assumptions.
Revenue Inputs
The revenue inputs section is where users define the commercial assumptions that drive the financial forecast. For the Inventory Management Software Financial Model, this may include monthly subscription pricing across multiple plan tiers, expected customer counts, customer acquisition cost, marketing spend, conversion rates, churn, one-time setup or onboarding fees, and usage-based transaction fees. These assumptions are essential because inventory software revenue often comes from a combination of recurring subscriptions and additional customer activity, such as implementation support or transaction volume. Users can adjust pricing for basic, professional, or enterprise-level plans, test different customer growth rates, and model how improvements in acquisition efficiency affect long-term revenue. The outputs from this section help generate monthly and annual sales forecasts, recurring revenue projections, and customer-related metrics that flow into profit and cash flow calculations. This component is useful for business planning because it connects strategy to numbers, allowing users to evaluate whether their target market, pricing model, and growth plan can generate enough revenue to support development, support, marketing, and staffing costs.
Bank-Ready Reports
The bank-ready reports section organizes the financial outputs into a professional format suitable for lenders, investors, advisors, and other stakeholders who need to review the business in a structured way. This component of the Inventory Management Software Financial Model may include projected profit and loss statements, cash flow statements, balance sheets, annual summaries, monthly detail, and key financial metrics. For a lender or investor, the ability to see revenue, operating expenses, EBITDA, cash position, assets, liabilities, and equity in a consistent format is essential for evaluating risk and repayment capacity. Inputs from the revenue plan, cost assumptions, payroll, capital expenditures, financing assumptions, and tax calculations flow into these statements automatically, reducing the need for manual report preparation. This is useful for founders preparing a loan application, seed funding discussion, grant submission, or internal financial review. The reports help demonstrate how the inventory management software business expects to grow, when it may become profitable, how much cash it may require, and whether the financial plan is credible enough to support funding or expansion decisions.
Revenue Breakdown
The revenue breakdown section gives users a more detailed view of how total income is generated across the different revenue streams in the inventory management software business. Rather than showing only one total sales figure, this component can separate recurring subscription revenue, onboarding or setup fees, usage-based transaction fees, tier upgrades, and potentially enterprise-level contracts. This level of detail is important because each revenue stream may have different growth behavior, margins, timing, and strategic implications. For example, subscription revenue may create predictable monthly recurring income, setup fees may improve early cash flow, and usage-based fees may grow as customer transaction volume increases. Users can input assumptions for customer volume, pricing by tier, adoption rates, usage levels, and fee structures, then review how each stream contributes to total revenue over time. This component is valuable for decision-making because it helps identify which products, customer segments, or pricing strategies create the strongest financial results. It also supports investor conversations by showing that revenue projections are built from specific drivers rather than a single unsupported growth estimate.
KPI Dashboard
The KPI dashboard tracks the performance metrics that matter most for evaluating an inventory management software business. This section may include SaaS-focused indicators such as monthly recurring revenue, annual recurring revenue, customer acquisition cost, customer lifetime value, churn, gross margin, EBITDA margin, payback period, cash runway, conversion rates, and revenue per customer. It may also include broader financial metrics such as net profit margin, operating expense ratio, cash flow trends, and return measures. The inputs come from customer assumptions, pricing, cost of goods sold, payroll, marketing spend, and financial statement outputs, while the dashboard translates them into key indicators that can be monitored over time. This is useful because SaaS businesses are often judged not only by revenue, but also by the efficiency and sustainability of that revenue. A growing customer base may look attractive, but the KPI dashboard helps show whether customers are being acquired profitably, retained successfully, and supported at a scalable cost. For founders, analysts, consultants, and stakeholders, this section supports better performance tracking, benchmarking, and ongoing operational decision-making.
Startup Cost and Capital Investment Plan
The startup cost and capital investment plan helps users estimate the funding required before and during the early operating period of the inventory management software business. This section may include initial software development, platform buildout, cloud architecture, office equipment, workstations, security audits, compliance work, legal setup, branding, initial marketing, product testing, and working capital reserves. For a SaaS inventory platform, startup costs can be significant because the product must be built, secured, tested, and positioned in the market before meaningful recurring revenue begins. The model allows users to separate one-time capital expenditures from recurring operating costs, making it easier to understand the true launch budget and avoid underestimating early funding needs. Outputs from this section can flow into the cash flow statement, balance sheet, depreciation assumptions, and funding requirement calculations. This component is valuable for planning and funding because it helps users determine how much capital may be needed to launch properly, how that money will be used, and how long the business can operate before recurring revenue becomes strong enough to support ongoing expenses.
Break-Even and Payback Analysis
The break-even and payback analysis section helps users understand when the Inventory Management Software Financial Model projects the business to cover its costs and recover the initial investment. This component may use revenue projections, gross margins, operating expenses, payroll, startup costs, capital expenditures, and cash flow assumptions to calculate the point at which cumulative revenue offsets cumulative costs or when monthly operating performance becomes profitable. It may also estimate the payback period for investors or founders by showing how many months it takes to recover the initial capital invested. For an inventory management software business, this analysis is important because early losses are common while the company invests in product development, marketing, customer acquisition, and support. The break-even output helps users assess whether the growth plan is realistic, whether funding is sufficient, and which levers can accelerate profitability. Users can test how higher pricing, better conversion rates, lower churn, improved cloud cost efficiency, or slower hiring may change the break-even month. This section supports investor conversations, budgeting decisions, and strategic planning by making the path to sustainability clear and measurable.
File types:
Excel – Single-User: .xlsx
Excel – Multi-User: .xlsx
Similar ProductsOther customers were also interested in...



 HenrySheykin
Business Valuation Expert Financial Model Excel Te...
The Business Valuation for Divorce Financial Model helps users build a structured financial forecast... Read more
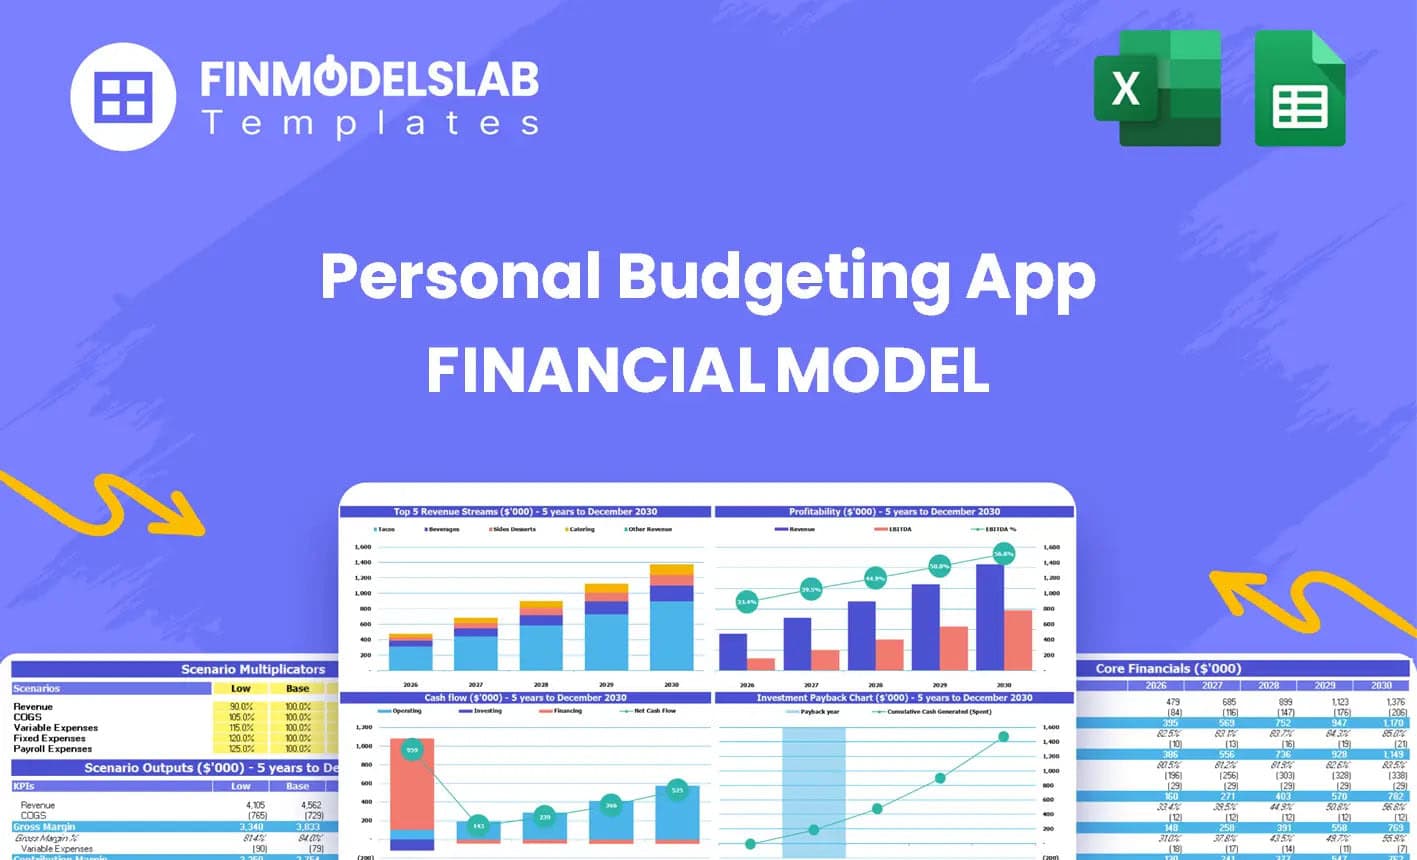
Budget vs Actual Excel Template
The Personal Budgeting App Financial Model Financial Model Template helps founders, entrepreneurs, c... Read more
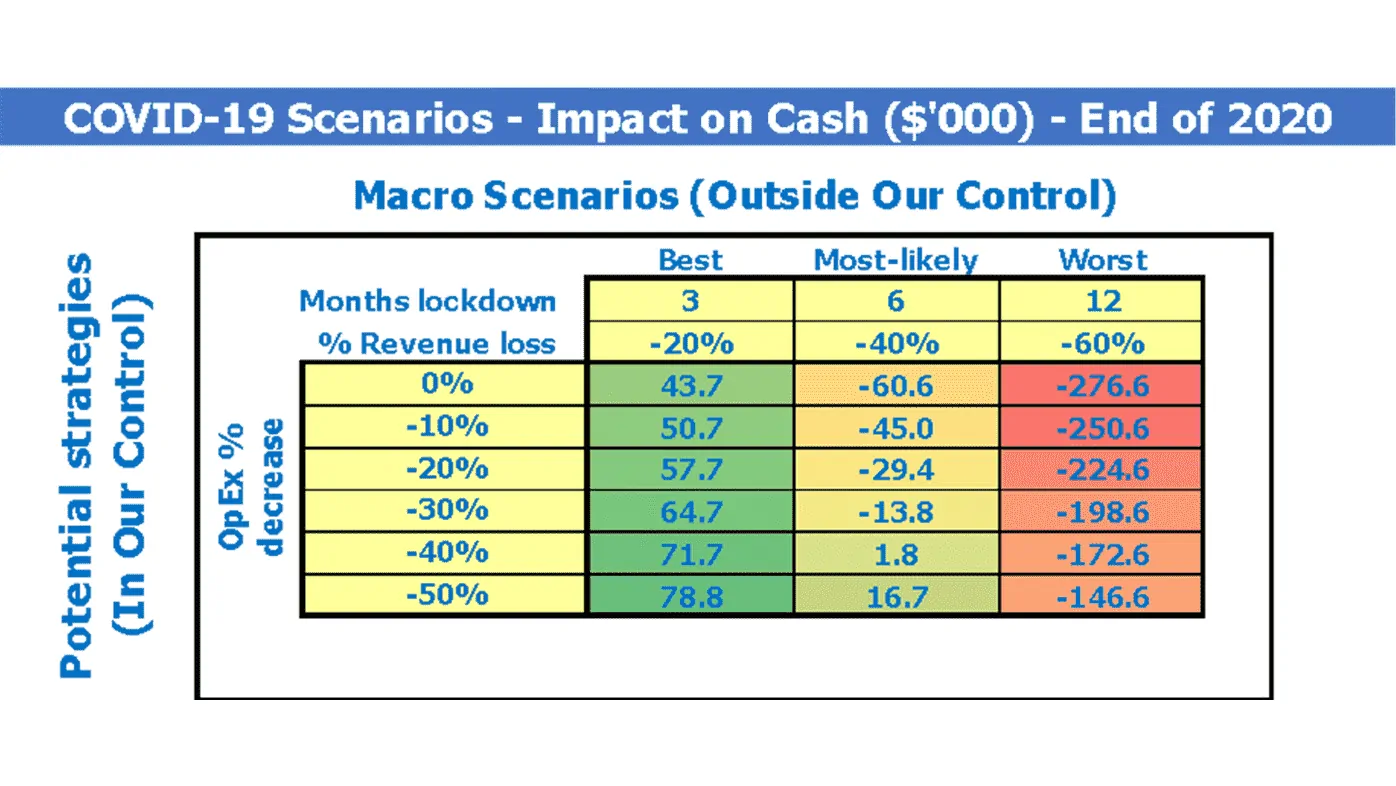
Financial Model Excel Template to fight COVID-19
The coronavirus has turned many small and big companies upside down. The decrease in sales, problems... Read more

 Anuj
Anuj
Private Equity Fund Model (Investor Cashflows)
The Private Equity Fund Cashflows Model helps LPs and GPs analyze fund cash flows, returns, and dist... Read more

 Giorgos
Advanced Financial Model with DCF and Valuation
Dynamic 10-Year Financial Model, suitable for any type of business, supporting strategic planning, i... Read more

Startup Company Financial Model – 5 Year Fin...
Highly-sophisticated and user-friendly financial model for Startup Companies providing a 5-Year adva... Read more
General Financial Models – All-in-One Bundle
A collection of templates suitable for various types of businesses/industries, covering major accoun... Read more
 Pierre-AlexandreHeur...
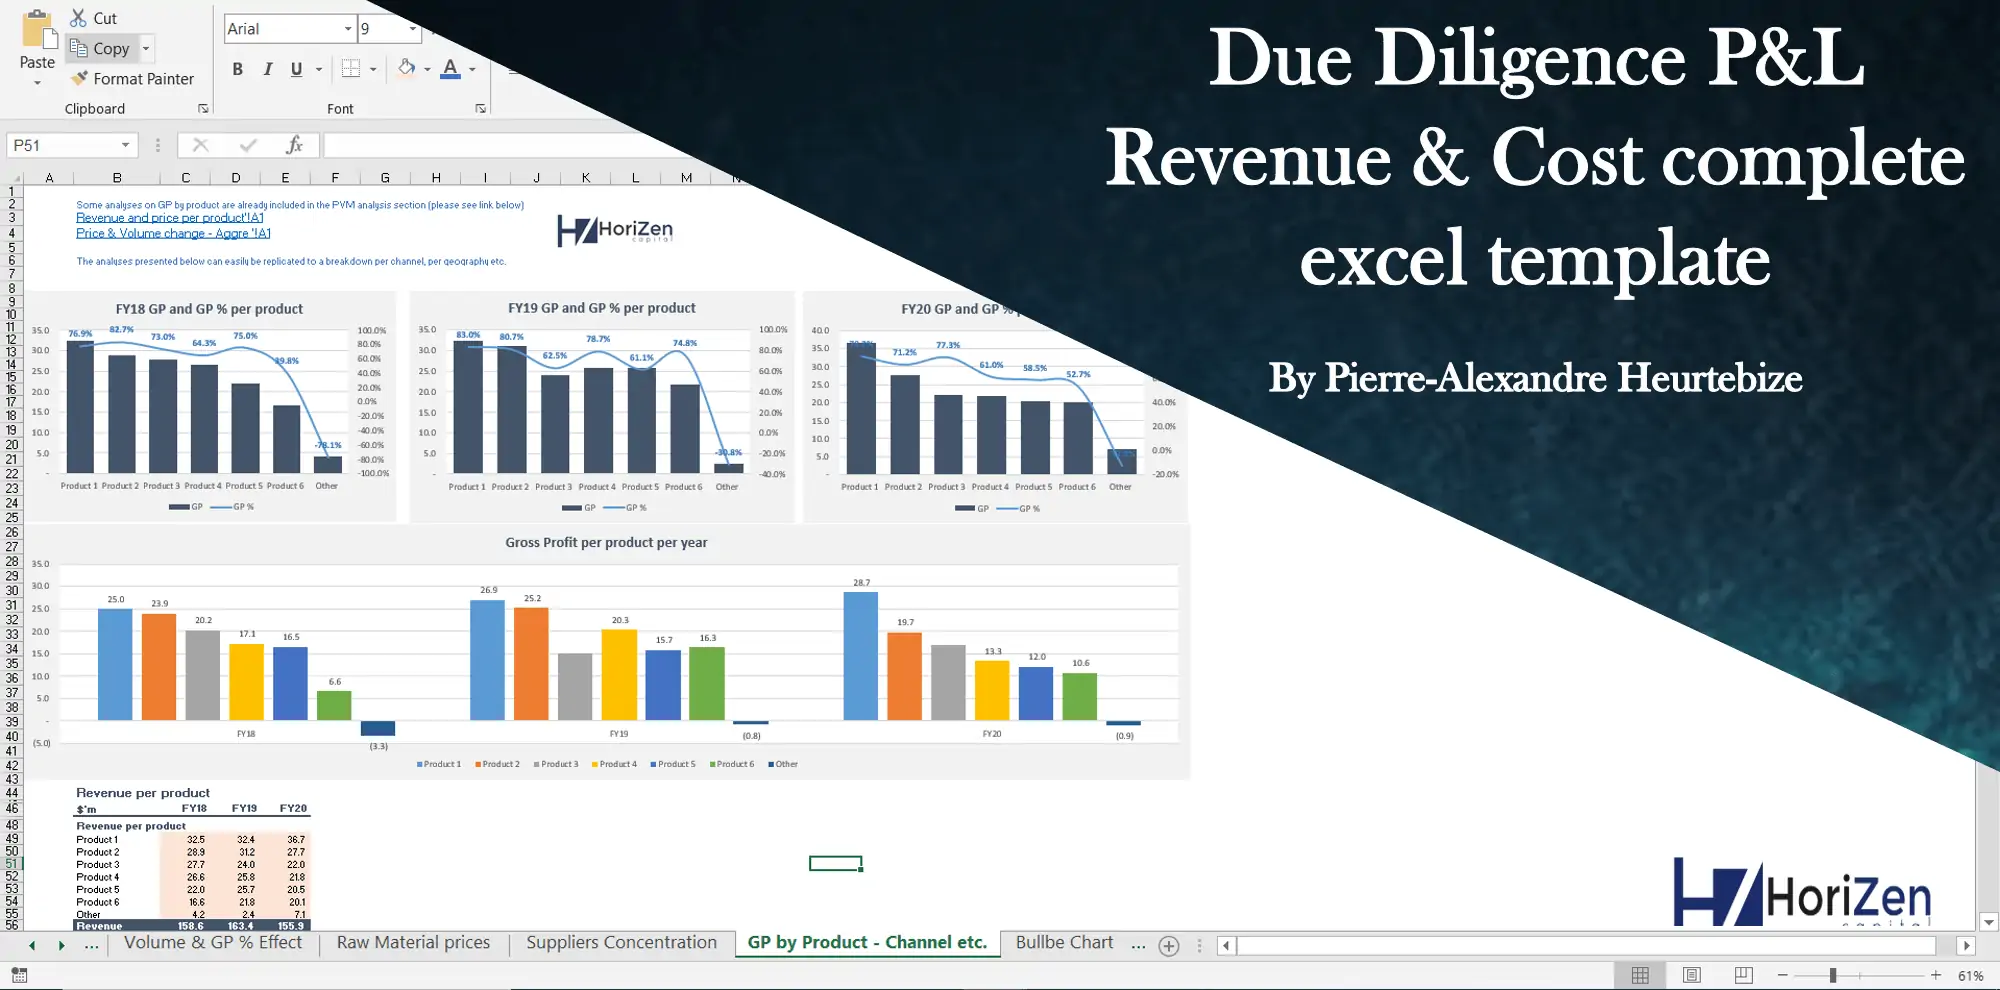
Due Diligence P&L – Exhaustive Revenue a...
Model for in depth understanding of high level profit and loss and revenue analysis. Big-4 like chec... Read more
You must log in to submit a review.