
0 ITEMS

Clothing Manufacturing Business Plan Financial Model Excel Template
The Clothing Manufacturing Financial Model helps users turn a garment production concept into a structured, editable financial forecast. It is built for planning a clothing factory, apparel production operation, or fashion manufacturing business where revenue depends on product mix, unit volume, pricing, production capacity, material costs, and labor efficiency. Instead of starting from a blank spreadsheet, users can work from a ready-to-use model designed around the realities of apparel manufacturing, including multiple product lines, cost of goods sold, operating expenses, payroll, startup costs, cash flow, profitability, and investor-focused outputs. This financial model template is useful for entrepreneurs, founders, business owners, consultants, analysts, and anyone preparing a business plan, loan application, investor deck, or internal budget for a clothing manufacturing business. The model gives users a practical way to document revenue assumptions, estimate production volumes, calculate expected sales, and connect those assumptions to direct costs, staffing, overhead, and profit margins. It can be customized for a small apparel workshop, a scalable garment factory, a private-label manufacturing operation, or an established clothing production company planning expansion. The template supports financial planning by organizing the key questions behind a manufacturing launch or growth plan. Users can estimate initial investment needs, evaluate operating expenses, model payroll, review cash flow timing, and assess whether the business can reach sustainable profitability. Built-in projections help show how changes in unit sales, average selling price, fabric costs, labor costs, fixed overhead, and production growth can affect financial performance over time. This makes the model especially valuable for decision-making before committing to equipment purchases, hiring plans, supplier agreements, or external funding. With editable assumptions, professional formatting, and outputs designed for stakeholder review, the Clothing Manufacturing Financial Model helps users create a more credible financial plan. It can be used to compare scenarios, review profitability, assess break-even timing, prepare lender-friendly reports, and communicate the economics of the business clearly. Whether the goal is to launch a new factory, expand production capacity, raise capital, or improve internal budgeting, this template provides a structured foundation for evaluating the financial potential of a clothing manufacturing business.
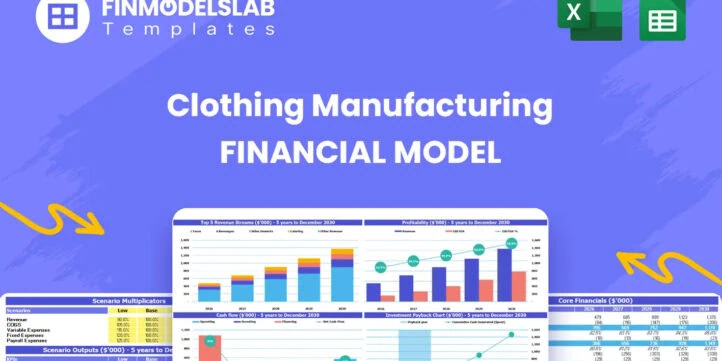


Financial Model Overview
The Clothing Manufacturing Financial Model is a ready-to-use financial model template designed to help entrepreneurs, founders, business owners, consultants, and analysts plan the economics of an apparel production business. Clothing manufacturing has many moving parts, including product mix, unit pricing, production volume, raw material costs, direct labor, factory overhead, equipment investment, staffing, working capital, and customer payment timing. This template brings those assumptions into one structured model so users can forecast revenue, costs, cash flow, profitability, and funding needs without building a complex spreadsheet from scratch. It is especially useful for a garment factory, private-label apparel producer, small scale clothing manufacturer, or fashion manufacturing startup that needs to present a clear financial case to investors, banks, partners, or internal decision-makers. The model is fully customizable, compatible with Excel and Google Sheets, and built to support business planning, budgeting, scenario testing, and financial presentations over a multi-year forecast period.
All-in-One Dashboard
The all-in-one dashboard gives users a central view of the most important inputs and outputs in the Clothing Manufacturing Financial Model. Rather than forcing the user to search through multiple worksheets to understand how the business is performing, the dashboard brings together the core drivers of the model, such as production assumptions, revenue totals, cost behavior, cash position, profitability, and key financial results. In a clothing manufacturing business, this is especially useful because management decisions often depend on the interaction between unit volume, average selling price, material cost, labor efficiency, and fixed factory overhead. The dashboard helps users see how these assumptions translate into projected sales, gross profit, EBITDA, net income, and cash flow. It can also support funding discussions by presenting high-level results in a clear, professional format that stakeholders can understand quickly. For founders and business owners, the dashboard acts as a practical control panel for reviewing whether the plan is financially realistic, whether the company has enough cash to operate, and whether production growth is creating sustainable profit instead of simply increasing workload and inventory requirements.
Low, Base, and High Scenario Analysis
The low, base, and high scenario analysis section helps users evaluate how the clothing manufacturing business could perform under different market and operating conditions. A single forecast can be useful, but apparel production is affected by uncertain factors such as order volume, customer demand, pricing pressure, supplier costs, production delays, labor productivity, and utilization of factory capacity. This component allows users to compare a conservative case, a realistic base case, and an upside case so they can understand the possible range of outcomes before making major commitments. Inputs may include unit sales by product line, annual growth rates, selling prices, fabric and trim costs, direct labor assumptions, overhead levels, and capital expenditure timing. Outputs may show how revenue, gross margin, EBITDA, net profit, cash flow, and funding requirements change across scenarios. This is valuable for decision-making because it helps users identify whether the business remains viable if sales ramp more slowly than expected or if costs rise faster than planned. It also strengthens investor and lender conversations by showing that the user has considered risk, not just the most optimistic version of the business plan.
Professional Charts
The professional charts component turns the financial forecast into visual outputs that are easier to review, present, and discuss with stakeholders. Clothing manufacturing forecasts can become detailed very quickly because they may include several product categories, multiple cost types, month-by-month projections, capital investments, payroll, and cash flow movements. Charts help simplify that information by showing trends in revenue, profit, margins, cash balance, operating expenses, and growth over time. Inputs come from the underlying assumptions and calculations in the model, while outputs are displayed as visual summaries that can be used in business plans, investor decks, management meetings, or loan discussions. This is useful because many stakeholders do not want to review every formula or worksheet in detail; they need to understand the direction and strength of the business. For example, a revenue chart can show whether growth is driven by higher production volume or higher pricing, while a profitability chart can show whether margins improve as the factory scales. The charting section also helps users identify unusual trends, such as rising costs that outpace sales growth or cash balances that decline despite positive accounting profit.
ROE Components and DuPont Analysis
The ROE components section uses a DuPont-style analysis to break down return on equity into the underlying drivers of business performance. For a clothing manufacturing company, return on equity is influenced not only by profit margins but also by how efficiently assets are used and how the business is financed. This section helps users understand whether projected returns are coming from strong operating performance, efficient use of factory assets, leverage, or a combination of these factors. Inputs may include net income, revenue, total assets, equity, debt balances, and related financial statement outputs. The model can then calculate metrics such as profit margin, asset turnover, equity multiplier, and overall return on equity. This is useful for investors and owners because it provides a deeper view of financial performance than revenue or profit alone. A garment factory may show strong sales growth, but if it requires heavy investment in machinery, inventory, and working capital, the return on equity may be lower than expected. By separating the components of ROE, the model helps users identify whether they should focus on improving margins, increasing asset utilization, controlling inventory, reducing idle capacity, or optimizing the capital structure.
Revenue Inputs
The revenue inputs component is where users define the assumptions that drive sales in the Clothing Manufacturing Financial Model. Apparel manufacturing revenue is typically based on the number of units produced and sold, the mix of product categories, average selling prices, annual price increases, and growth in production capacity or customer demand. This template is designed around multiple clothing product lines, such as basic t-shirts, fleece hoodies, denim jeans, casual dresses, and puffer jackets, while remaining editable for other garment categories or private-label production arrangements. Users can adjust unit volumes, pricing, growth rates, and product mix assumptions to reflect their own factory plan, customer contracts, wholesale channels, or brand partnerships. The outputs from this section feed directly into the revenue forecast, gross profit calculations, cash flow projections, and overall profitability analysis. This is one of the most important parts of the model because small changes in price, volume, or mix can materially affect margin and break-even timing. By organizing revenue assumptions clearly, the template helps users build a more defensible sales forecast and test whether the planned production volume can support staffing, equipment, rent, utilities, and other operating costs.
Bank-Ready Reports
The bank-ready reports component provides structured financial outputs that can support lender discussions, funding applications, and stakeholder review. Banks and financing partners typically want to see more than a basic sales estimate; they need to understand projected income, operating expenses, cash flow, debt capacity, startup costs, and the ability of the business to meet its obligations. This section helps convert the assumptions in the clothing manufacturing forecast into organized reports that are easier for lenders to evaluate. Inputs may include revenue projections, cost of goods sold, payroll, overhead, startup investment, capital expenditures, loan assumptions, repayment schedules, and working capital needs. Outputs may include profit and loss summaries, cash flow forecasts, balance sheet views, and key financing metrics. For a garment production company seeking equipment financing, working capital funding, or a startup loan, this component can help show how the business expects to generate enough operating cash to cover expenses and repayments. It also helps business owners prepare for lender questions about seasonality, inventory buildup, customer payment terms, production ramp-up, and the financial cushion needed during the early months of operation.
Revenue Breakdown
The revenue breakdown component gives users a detailed view of how each apparel product line contributes to total sales. In clothing manufacturing, total revenue can hide important differences between products. A puffer jacket may have a higher selling price but also higher material and labor costs, while a basic t-shirt may sell at a lower price but benefit from larger production runs and simpler operations. This section allows users to analyze revenue by stream, product type, unit volume, price, and growth pattern. Inputs may include planned production units, expected sales volume, average selling price, product-specific growth rates, and the share of each product in the overall mix. Outputs help users see which categories generate the most revenue, how the mix evolves over time, and where the business may be most exposed to changes in demand or pricing. This is useful for budgeting and decision-making because the product mix affects purchasing, staffing, machinery usage, working capital, and profitability. It can also help users decide whether to prioritize high-volume basics, higher-margin fashion items, seasonal outerwear, or a balanced mix that supports more stable factory utilization throughout the year.
KPI Dashboard
The KPI dashboard component tracks performance metrics and benchmarks that help users evaluate the health of the clothing manufacturing business. While financial statements are important, operators also need practical indicators that show whether the factory is performing efficiently. This section may track metrics such as revenue growth, gross margin, EBITDA margin, net margin, return on equity, cash balance, cost of goods sold as a percentage of revenue, labor cost ratios, operating expense ratios, and other performance indicators relevant to apparel production. Inputs come from the model’s revenue, expense, cash flow, and balance sheet calculations, while outputs are displayed in a concise dashboard format for quick review. The KPI dashboard is useful because it helps users move beyond raw numbers and understand performance quality. For example, revenue growth may look positive, but if gross margin declines due to fabric price increases or inefficient labor usage, the business may need operational adjustments. Benchmarks and KPI tracking can also support investor updates, monthly management reviews, and internal decision-making. By monitoring key metrics consistently, users can identify trends early, improve planning discipline, and make better decisions about pricing, staffing, purchasing, and production capacity.
Startup Cost Breakdown
The startup cost breakdown component organizes the initial investment required to launch or expand a clothing manufacturing operation. A garment factory often requires significant upfront spending before it can generate revenue, including industrial sewing machines, cutting equipment, finishing tools, factory fit-out, software systems, licenses, deposits, initial inventory, raw materials, quality control equipment, training, and pre-opening marketing or sales expenses. This section allows users to enter and customize one-time setup costs so they can estimate the total funding required before operations begin. Outputs may include total startup investment, capital expenditure categories, pre-opening expense totals, and the amount of cash needed to cover launch costs and early working capital. This is useful for business planning because underestimating startup costs can create cash shortages at the exact moment when the business needs to stabilize production, hire staff, and fulfill early orders. For investors and lenders, a clear startup cost schedule shows that the funding request is based on specific operational needs rather than a vague estimate. It also helps founders decide whether to lease or purchase equipment, phase capacity over time, negotiate supplier terms, or raise additional capital before launch.
Break-Even Analysis
The break-even analysis component helps users understand when the clothing manufacturing business is expected to become profitable and what operating conditions are required to reach that point. In apparel production, break-even depends on several connected assumptions, including unit sales volume, average selling price, product mix, fabric and trim costs, direct labor, packaging, freight, fixed factory overhead, payroll, rent, utilities, and administrative expenses. This section uses the model’s revenue and cost assumptions to estimate the level of sales or time period needed for the business to cover its costs. Outputs may include break-even month, break-even revenue, break-even unit volume, margin of safety, and the impact of changes in price or cost on profitability. This is valuable for planning because it shows whether the factory must operate near full capacity to be viable or whether it can remain profitable at more moderate utilization. It also supports pricing decisions by showing how discounting or cost increases affect the path to profitability. For funding documents, break-even analysis gives stakeholders a clear milestone for evaluating business risk. For management, it provides a practical target that can guide sales planning, production scheduling, staffing levels, and cost control.
File types:
Excel – Single-User: .xlsx
Excel – Multi-User: .xlsx
Similar ProductsOther customers were also interested in...

 Excel Business Resou...
CBD Personal Care Financial Model and Valuation Te...
CBD Personal Care Financial Model and Valuation Template, a comprehensive solution tailored for entr... Read more
 HenrySheykin
Grocery Store Financial Model Excel Template
The Grocery Store Financial Model helps entrepreneurs, founders, consultants, analysts, and retail b... Read more
Bakery Financial Model Excel Template
The Bakery Financial Model helps entrepreneurs, bakery owners, consultants, analysts, and business p... Read more
Candy Store Financial Model Excel Template
The Candy Store Financial Model helps entrepreneurs and planners turn a retail confectionery concept... Read more
Liquor Store Financial Model Excel Template
The Liquor Store Financial Model helps entrepreneurs, store owners, consultants, analysts, and busin... Read more
Clothing Store Financial Model Excel Template
The Clothing Store Financial Model helps turn a retail apparel concept into a structured financial f... Read more
Diaper Manufacturing Business Plan Financial Model...
The Diaper Manufacturing Financial Model helps users turn a disposable diaper factory concept into a... Read more
Coffee Roasting Business Plan Financial Model Exce...
The Coffee Roasting Financial Model helps entrepreneurs, founders, business owners, consultants, and... Read more
Clothing Line Business Financial Model Excel Templ...
The Clothing Line Financial Model helps founders, apparel entrepreneurs, consultants, analysts, and ... Read more
Candle Making Business Plan Financial Model Excel ...
The Candle Making Business Financial Model helps entrepreneurs, founders, business owners, consultan... Read more
Reviews
 The Clothing Manufacturing Business Plans
Free Clothing Manufacturing Business Plan Financial Model Excel & pdf, word
1961 of 3719 people found this review helpful.
Help other customers find the most helpful reviews
Did you find this review helpful?
You must log in to submit a review.