Why Sensitivity Analysis Matters
Table of Content

In the business world, there are many variables that are uncertain and will affect the financial performance of a business. Key decision-makers such as CEOs, CFOs, investors, business owners, entrepreneurs but also financial analysts and consultants will, therefore, want to understand the risks involved and the magnitude of their financial impact through sensitivity analysis. Therefore, when building a financial model, it is important to properly identify and understand the risks which can affect the financial performance of a business.
Sensitivity analysis is a method used in financial modeling to analyze the dependencies of assumptions on the financial modeling result. Sensitivity analysis finance seeks to find out how changes in key assumptions affect the target output of a financial model. How will the model change when an assumption changes?
Many times the main output of a financial model is the calculation of a key financial metric such as e.g. the Internal Rate of Return (IRR) or the Net Present Value (NPV). These key metrics form the basis for financial decision-making. Therefore, it is important to obtain comfort on the assumptions and on the reliability of the model. In this article, we want to show how this can be achieved when looking at various sensitivity analysis examples.
Sensitivity Analysis Finance exposes Risks and Opportunities
Conducting a sensitivity analysis consists of preparing data tables such as below. Sensitivity tables demonstrate how the output of a financial model is affected when key assumptions are changed. Below sensitivity table, illustrates how the modeled property price changes when assumptions such as the occupancy rate or the average lease rate change as well.

If the occupancy rate of a property decreases from 95% to 85.5% then the property value drops from $36.0m to $32.9m. If the average lease rate increases from $15/sq ft to $18/sq ft, the property value increases from $36m to $39.9m. This shows that these assumptions pose a risk and can affect the property value significantly on the downside but also on the upside. Many times investors will be interested to understand the downside and such sensitivity tables form an important tool to do this.
Sensitivity analysis does not only help to assess the risks but is also essential in identifying opportunities which levers need to be moved to increase the business value. This is done by identifying the key assumptions which have the biggest effect on the valuation and deserve the most attention (see also Tornado Diagram below). Once you know which key assumption poses the highest risk you also know where potentially lies an opportunity. By looking for ways how to influence these key assumptions the business value can now be influenced. That’s why these key assumptions are called key value drivers.
Typical key value drivers used in building financial models are the following:
- Growth rates related to sales, volumes, prices, customers, subscribers, etc.
- Profit margins such as EBITDA Margin, Gross Profit margin, etc.
- Cost assumptions, especially if a business is very dependent on raw materials prices
These are just a few to name. Whether you are planning for the next 3, 5 or 10 years of the whole company or the next month for your small business, a thorough understanding of how value is created can be very helpful to ensure your business prospers and you can identify risks and mitigation strategies early on. Therefore understanding sensitivity analysis finance matters and is essential for financial decision-making.
Sensitivity Analysis Examples in Financial Modeling
A financial model itself consists of a series of assumptions and calculations defined in the financial model. Sensitivity analysis can be very helpful to better understand how the model works, how value is created, how any change in assumptions affects key financial metrics. Running extensive scenario analysis very often leads to a more solid understanding of the model itself and offers comfort on the robustness of the model.
Impact on key financial metrics
Typical questions sensitivity analysis can answer are questions such as:
- Manufacturing Company: What is the impact on profits if the price of a key raw material goes up?
- SaaS Company: If we increase our budget for paid ads, what will be the effect on monthly recurring revenues (MRR)?
- Retail Chain: How do investor returns change if a retail chain rolls out its stores faster/slower?
- Manufacturing Company: What is the impact on the Discounted Cash Flow valuation if profit margins increase?
- Real estate: How would a cost overrun affect investor returns for a real estate project?
- Price optimizations: If the company raises sales prices by 5%, how would this impact Gross Profit?
- Volume impacts: What would happen if sales volumes drop by 10%? How would that impact the EBITDA margin?
Sensitivity Analysis uncovers the modeled Business Logic
Sensitivity analysis exposes how key financial metrics are affected by changes in important assumptions of the model. The outcome of the sensitivity analysis heavily depends on the way calculations are performed in the model. E.g. when you calculate a profit margin there are two if not more ways how to do this:
- As a % of Sales (variable)
- As a profit margin per ton (fixed amount)
- As per detailed revenue and cost breakdowns (variable and fixed amounts)
Now the sensitivities of the three different ways of calculating the same – profit margins – will be different as well since they follow their own calculation logic. Once you check the sensitivity tables, often it also can be mean to discover that some assumptions affect the financial outcome in a non-intended way. The financial modeler, therefore, will go back, check his calculations and many times will discover new ways so that the model better reflects the business reality. t Sensitivity analysis is a tool to check the financial modeling logic.
Sensitivity analysis, therefore, can be very helpful to find cause and effect relationships within the financial model – intended and unintended ones. The conclusions drawn from a financial model are only as solid as the model and assumptions itself. Therefore many times it is necessary to run sensitivity analysis but also scenario analysis to obtain comfort that the model behaves in a logical way. This is especially relevant as the model will be used for making financial decisions and sensitivity analysis can be an essential tool in making your model more robust.
Scenario analysis vs. Sensitivity Analysis?
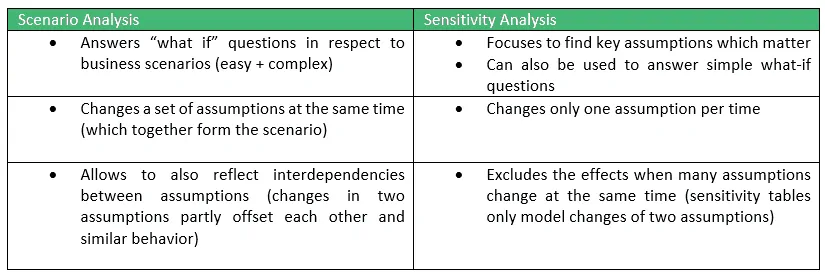
One question which often comes up is what exactly is the difference between sensitivity analysis and scenario analysis? The following table compares the scenario vs. sensitivity analysis in financial modeling:

In financial modeling – as well as in business – it is important to focus on what really matters. Therefore, sensitivity analysis in finance is essential to identify the assumptions which are the most important drive value and which deserve to better understood.
On the other hand, understanding what-if-scenarios with scenario analysis, helps managers prepare and effectively plan for specific scenarios.
While nobody can predict the future financial planning does not hurt and leads to more intelligent decision-making. When running the above analyses, managers, business owners, entrepreneurs and investors can better prepare themselves how to deal with anticipated financial scenarios and come up with solutions in due time.
Sensitivity Analysis Example: A Gold Mining Project
Preparing Sensitivity Tables
We look at the example of a financial model for a Gold Mining project. A gold mine operation basically extracts ore which then will be processed by a mill to extract the sellable minerals.
In our model the key value drivers in our gold mine example are the following:
- Mine operating costs per ton
- Mill operating costs per ton
- Gold price ($/g)
- Annual cost inflation rate (%)
- The Ore Grade (grams of metal per ton)
- Number of production days (either first year or all years)
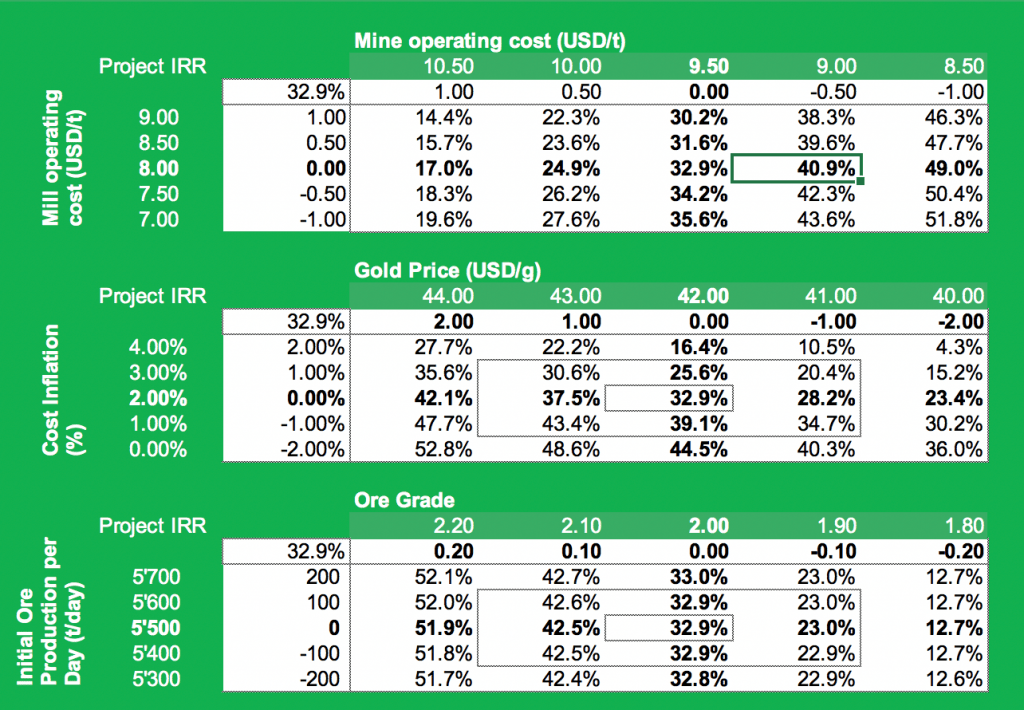
We now prepare sensitivity tables to understand how changes in any of these assumptions will affect the Project IRR of our Gold Mining project.

See the video below which explains how to build such sensitivity tables.
The Tornado Diagram
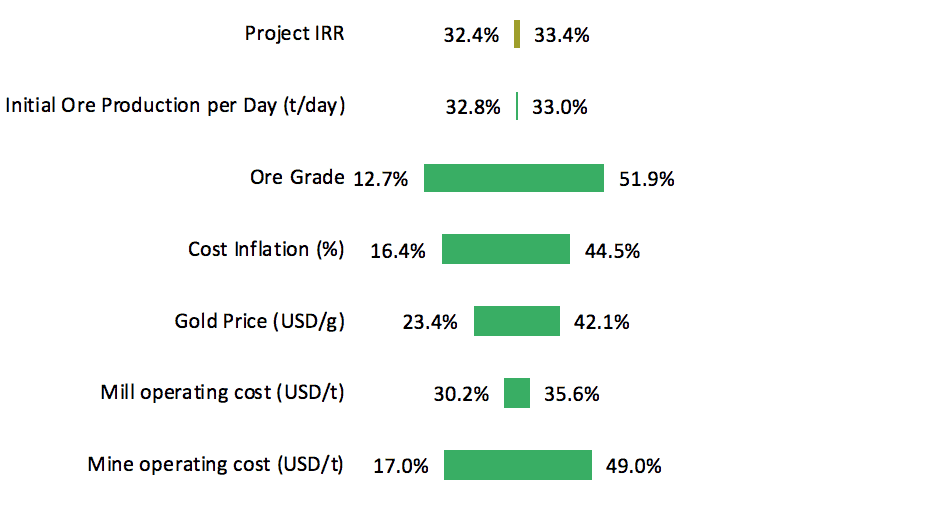
Once the sensitivities are calculated, often a graphical presentation of the sensitivity analysis can be helpful to understand the conclusions. A good way to do this is to build a Tornado Diagram.
A Tornado Diagram essentially is a two-sided bar chart with each bar representing the range of data values when each independent variable is set to Lower Bound and Upper Bound. The chart got its name from the tornado-like shape formed from the sorted data values. Interpreting the chart is simple and straightforward: Big bars have a larger effect on a key financial metric such as the Project IRR compared to small bars.
See below Tornado Diagram for our gold mine example.

In this graph, we can see that a +/- 20% change in ore grade will have the biggest effect on the financial outcome in the form of IRR. This tells us that management needs to pay a lot of attention to geological exploration to find the best spots where to dig for the richest ore.
Another conclusion is that a +/- 1$ change in mine operating costs has the second biggest effect on the financial result. This means one needs to pay a lot of attention to managing costs.
Finally, the gold price plays an important role. As this is a factor determined by the market, one could eventually consider using hedging instruments to protect against a negative market drop.
So overall the Tornado Diagram offers a simple way to read the outcome of a sensitivity analysis.
Conclusion: Sensitivity Analysis enhances the quality of your Financial Model
As our sensitivity analysis example shows, sensitivity analysis cannot only identify risks but also discover actionable items that can be executed by business managers to influence the key value drivers of a business. They offer real insights into how a business works and how financial performance is affected. We, therefore, can sum up the benefits and limitations of performing sensitivity analysis as follows;
Benefits of Sensitivity Analysis
- Enhances the understanding of financial risks and identifies the key value drivers
- Allows to prioritize which assumptions need to be better investigated
- Leads to actionable tasks on how to influence those value drivers
- Allows to check the logic of the financial model
- Makes your financial model more robust by uncovering dependencies
- Adds an additional quality to financial decision-making
- Easy to read when using a tornado diagram
Limitations of Sensitivity Analysis
- Is a simplified model of reality
- Can neglect complex interdependencies between assumption (better captured through scenario analysis)
- The conclusions of sensitivity analysis are only as good as your financial model is
- Does not make any statement in terms of how probable it is that the assumptions will change in any direction
- Makes your model more complex
So overall, sensitivity analysis finance considerations can offer tremendous help in making your next financial model more robust and becoming more clear on which factors to focus on to drive value but at the same time also to uncover the inherent risks of a business. At the same time the complexity of the model increases as well, therefore a sensitivity analysis should be only used in cases where a simple model won’t do it. Best to refer to the many sensitivity analysis examples to obtain a better feel of how sensitivity analysis can be used in your next financial modeling tasks.


