Gasoline and Charging Station Financial Model
Investors can assess the viability of setting up and investing in gasoline stations with a charging station by downloading a financial model for their business. With the aid of this comprehensive 5- or 10-year monthly tool, investors may forecast revenue, costs, cash flows and evaluate potential risks and returns. Additionally, using this financial model will help investors to make well-informed decisions and increase their chances of success in the fiercely competitive gasoline station industry.
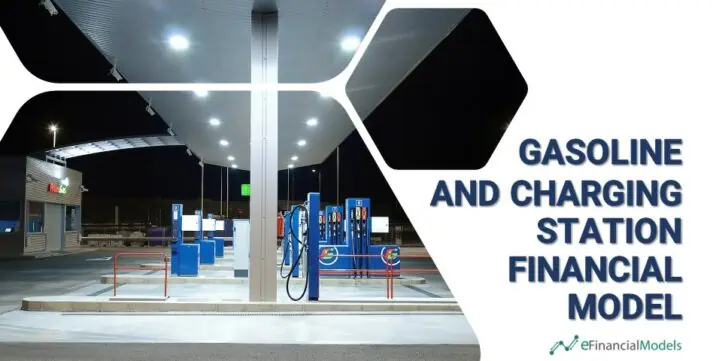
Gasoline is still the primary fuel source for vehicles. Although the market may shift towards new fuel sources such as hydrogen and also to hybrid or electric vehicles, gasoline will still be needed for the foreseeable future.
Considering that there is an evolving transition of fuel sources from gasoline to renewable energy or electricity and a growing infrastructure to support them, investors could consider establishing a gasoline station with a charging station for electric vehicles (EV). With this gasoline and charging station financial model, investors can comprehensively project the financial feasibility of catering to a wider range of customers and protect their company against the transition to electric vehicles by offering both refueling and charging services.
Furthermore, gasoline stations can generate additional revenue through convenience stores, repair stations, car washes, rental of billboards and spaces, and other services. With the right location, marketing, and management, a gasoline station can be a profitable investment that serves the community’s needs.
The model also enables the determination of key performance indicators such as daily and monthly vehicles, average gross profit per income source, and key relevant financial metrics, including internal rate of return (IRR), minimum funding required, and the funding period. By understanding the financial implications of a gasoline and charging station business, investors can optimize their pricing strategy and identify areas for cost savings.
Unique Features of this Gasoline and Charging Station Financial Model
- Units and Labels: Vehicles could be identified into four types, and the units, such as Gasoline and Renewable Energy, can either be gallons (gal) or liters.
- Land and Building: Users have the option to select whether land and building are owned (invested in the months of preparation) or rented (recognizes monthly rent expense)
- Forecasted Valuation: The valuation is broken down into Business and Property values. This approach enables investors to analyze better the effect of potential sale and leaseback transactions at the exit.
- Owned Scenario – Recognizes the Business value through an exit multiple (EV EBITDA), and the Property value by applying a capitalized rate to the rental value.
- Rent Scenario – Recognizes only the Business Value
- Detailed Monthly and Yearly Financial Plans: The spreadsheet is designed logically, outlining the calculations of revenues and costs, which adds to the transparency and understanding of the model.
Gasoline and Charging Station Template Structure
This Excel template has instructions and formulas that are simple and easy to follow, which allows users to run simulations by varying the input assumptions. The elements of this financial model template are enumerated below:
Instructions and Terms contain the cell color codes, instructions guiding the user on how to work around the workbook, and the terms and abbreviations used.
Assumptions that are necessary and applicable in the business plan of starting a Gasoline and Charging Station are presented in this worksheet.
- General Settings
- Currency
- Income Tax Rate
- Investment Period
- Price and Cost Inflation Rates
- Net Working Capital
- Gasoline and Charging Station Business Assumptions
- Project Details
- Gasoline and Charging Station Time plan – Selected start year and month
- Preparation Period – Number of Months
- Opening Hours per Day
- Operating Days per Year
- Project Details
- No. of Vehicles
- Location
- Vehicle Traffic per Day
- Traffic Growth per annum
- Initial and Target No. of Vehicles – Avg. number per day
- Ramp Up Period – Number of months to reach Target
This financial model template comes pre-filled and if programmed with the following types of vehicles:
- Gasoline Vehicles
- Gasoline Sales Volume – Average Refuel (gallon or liter per vehicle)
- Gasoline Types and Volume Allocation – Up to five types of gasoline for cars
- Direct Costs – Average Fuel Cost, Transport Cost and Tax on Fuel
- Profit Markup
- Gasoline Fuel Prices
- Electric Vehicles
- Avg. Charging per Vehicle
- Charger Types and Allocation
- Pricing and Direct Cost Assumptions
- Hybrid Vehicles
- Avg. Refuel and Charging per Vehicle
- Source of Fuel – Gasoline or Renewable Gas and Fuel
- Source Allocation – Fuel and Electricity
- Direct Cost and Markup Pricing Calculations
- Renewable Gas and Fuel Vehicles
- Avg. Refuel per Vehicle (gallon or liter per vehicle)
- Fuel Types and Volume Allocation – Up to three types
- Fuel and Electricity Prices
- Direct Costs
Other Assumptions include:
- Other Income
- Income Source
- Utilization Rate – Percentage of Vehicles
- Average Income per Vehicle
- Rental of Billboards and Spaces
- Monthly income
- Income Source
- Direct Costs
- Operating Expenses
- Rent Expense (Recognized if land and building is rented)
- Employee Costs
- Supplies Expense
- Other OPEX
- Land and Building Option – Owned or Rented
- Purchase Costs if Owned
- Monthly Rent Expense
- Leasable Area
- Capital Expenditures (CAPEX) Assumptions
- CAPEX Items
- Depreciation Periods
- Initial CAPEX Investment Amount and Schedule
- Maintenance CAPEX – Annually or Semi-annually
Users have the option to determine when CAPEX will be initially invested:
- First Month – At the beginning of the preparation period only
- Equally Monthly – Equally throughout the preparation months
- Debt Financing
- Debt Amount – Percentage (%) of CAPEX
- Sources of Debt and Allocation
- Drawdown Schedule – First Month, Equally Monthly or Investment of CAPEX Basis
- Debt Period
- Payment Term – Annually, Monthly or Quarterly
- Interest Rate
- Grace Period – Repayment starts at specified month/s after preparation period.
- Equity Financing
- Injection Schedule – First Month, Equally Monthly or Investment of CAPEX Basis
- Uses and Sources of Funds
- Net Working Capital
- Cash Reserve
- Exit and Valuation
- Discount Rate
- Business Valuation
- Exit Multiple – EV EBITDA
- Property Valuation
- Capitalization Rate
- Shareholders’ Cash Flows (only in Premium Version)
- Shareholders – Up to two
- Funding and Equity Stake
- Selected Cash Flow – Levered Cash Flows or Cash In/Cash Out
- Drawdown Schedule – First Month, Equally Monthly or Investment of CAPEX Basis
- Dividend Policy
- Schedule – Start year and month
- Dividend Model – Profit Distribution or Cash Sweep
Executive Summary includes charts for a better understanding of the financial prospects of a Gasoline and Charging Station business model and to provide answers to the following questions:
- Is a gasoline and charging station business profitable?
- How much revenue does a gasoline and charging station generate?
- How many types of vehicles are there?
This spreadsheet includes a 10-year summary of the following:
- Projected Financial Statements overview – Income Statement, Balance Sheet, and Cash Flows Statement.
- Levered and Unlevered Free Cash Flows calculating key financial feasibility metrics such as the Internal Rate of Return IRR), Payback Period, Net Present Value (NPV)
- Uses and Sources of Funds and Debt Financing
- Gross Profit Margin Analysis
- Forecasted Business and Property Valuation
- Shareholders’ Summary (only in Premium Version)
- Break-Even Analysis (only in Premium Version)
- This feature calculates the required average daily or yearly number of vehicles at the selected year to break even at an EBIT level.
- Sensitivity Analysis (only in Premium Version)
Yearly and Monthly Detailed Summaries present the yearly and monthly selected year overview of the Gasoline and Charging Station business plan in charts and tables.
Financials worksheet contains a comprehensive and detailed monthly 10 or 5-year (depending on the model version) forecast of the Gasoline and Charging Station business plan:
- Gasoline and Charging Station Financial Statements – Income Statement, Balance Sheet, Cash Flow Statement
- Forecasted Business and Property Valuation
- Unlevered and Levered Free Cash Flow
- Shareholders’ Cash Flows (only in Premium Version)
- This is prepared to show the calculations of the Equity Multiple and Investors’ IRR, which helps determine if their funding and equity stake percentages would result in a profit on their end.
- Funding Required
- CAPEX Schedule
- Debt Schedule
- of Vehicles
- Revenue Calculation per Vehicle Type
- Gasoline Volume Sales and Income
- Other Vehicle Types – Electric, Hybrid, and Renewable Gas and Fuel Vehicle
- Other Income
- Direct Costs
- Operating Expenses
- Financial Metrics
Competitively Prepared with this Gasoline and Charging Station Template
This Gasoline and Electric Vehicle Charging Station financial template offers potential investors features that will help them analyze the effects of various scenarios of catering to the current demand for gasoline and the transition to renewable gas, hybrid, and electric vehicles.
Potential business owners will be able to decide whether investing in a gasoline station will be successful with the help of financial analysis and key KPIs. Get your copy today and begin making data-driven decisions with ease.
This financial model template comes pre-filled with an example forecast of a Gasoline and Charging station business. The forecast can be easily changed by altering the blue and light blue assumptions.
The models, current version at 2.1, are available in two fully editable Excel versions:
- Premium Version (Excel file, fully editable) – 10-Year forecast consisting of all features
- Basic Version (Excel file, fully editable) – 5-Year forecast consisting of all features except for the Break-Even Analysis, Shareholder’s Cash Flow, and Sensitivity Analysis
Both versions are available in three files:
- Excel Version – pre-filled with an example forecast.
- Excel Null Version – no values in the assumption sheet.
- PDF Versions – which outline the details of the model structure.
File types:
.xlsx (MS Excel)
.pdf (Adobe Acrobat Reader)
Similar Products
Other customers were also interested in...
Electric Vehicle (EV) Charging Station Financial M...
With this comprehensive 5- or 10-year monthly tool, investors can assess the viability of setting up... Read more
Electric Vehicle (EV) Charging Station Financial M...
Electric Vehicle (EV) charging Station FM helps user asses financial viability of setting up and ope... Read more
Car Wash Financial Model – Dynamic 10 Year B...
Financial Model providing a dynamic up to 10-year financial forecast for a startup or existing Car W... Read more
Gas Station Financial Model – Dynamic 10 Year Fo...
Financial model presenting a business scenario of a Gas Station, which is either purchased or leased... Read more
Car Wash Development Model
The Car Wash Development model projects annual future cash flows from a car wash facility from the p... Read more
Services Industry Financial Model Bundle
Bundle of financial model templates for Service Industry businesses and its related sectors such as ... Read more
Green Ammonia from Renewable Energy Financial Mode...
This comprehensive 40-year tool aid investors in evaluating potential risks and returns and assess t... Read more
Green Hydrogen (Electrolysis) Production Financial...
This green hydrogen financial model template builds a multi-year financial plan to analyze the finan... Read more
Business Plan for a Biodiesel Manufacturing Plant
Setting up a biodiesel manufacturing plant requires a comprehensive and executed business strategy. ... Read more
Blue Hydrogen Production Financial Model
The objective of this financial model is to develop a comprehensive business plan of 40 years foreca... Read more
Reviews
I need help in making this South Africa relevant. Also to understand some of the logic. The instructions are too light
292 of 608 people found this review helpful.
Help other customers find the most helpful reviews
Did you find this review helpful?
-
Hi Derrick, many thanks for your review! Sure, point taken. We will work on improving the documentation for this template. In the meantime, we invite you to forward us your questions by email and we will be happy to address them. – eFinancialModels
298 of 577 people found this review helpful.
Help other customers find the most helpful reviews
Did you find this review helpful?
You must log in to submit a review.


