
0 ITEMS

Advanced Discounted Cash Flow (DCF) Valuation Model Template
Determining a business’s intrinsic value is paramount in today’s competitive landscape. This Advanced Discounted Cash Flow (DCF) Valuation Model Template in Excel offers a sophisticated yet accessible solution, providing a structured approach to in-depth DCF analysis. The model features a detailed 10-year monthly forecast, enabling precise projection of future free cash flows, and offers the flexibility of utilizing ten terminal value methods to ensure a comprehensive valuation. Beyond these core functionalities, the template includes a robust WACC calculator, comprehensive scenario and sensitivity analysis, and pitchbook-ready outputs. Designed for entrepreneurs, investors, and finance professionals, it empowers users to confidently assess intrinsic value, stress-test assumptions, and gain insights into valuation drivers for informed investment decisions, strategic planning, and effective business management. Download this powerful tool today to transform the way you value businesses.


Discounted Cash Flow (DCF) valuation remains one of the most reliable and widely used methods for assessing a business’s intrinsic value, which is crucial for sound investment decisions, strategic planning, and effective business management by analyzing the present value of future free cash flows.
This 10-year monthly Advanced Discounted Cash Flow (DCF) Valuation Model Excel Template is designed to offer a powerful, user-friendly solution for conducting in-depth DCF analysis. Designed for entrepreneurs, owners, and investors alike, this template empowers you to confidently navigate the intricacies of discounted cash flow for valuation, offering a clear and transparent framework to understand the true economic worth of a business. Whether you’re an established firm analyzing acquisition opportunities, an investor evaluating risk-adjusted returns, or an early-stage startup seeking funding, understanding future cash flows and discounting them properly is critical. It provides a clear and transparent framework for understanding a business’s economic worth by enabling tailored industry-specific assumptions and flexible scenario testing.
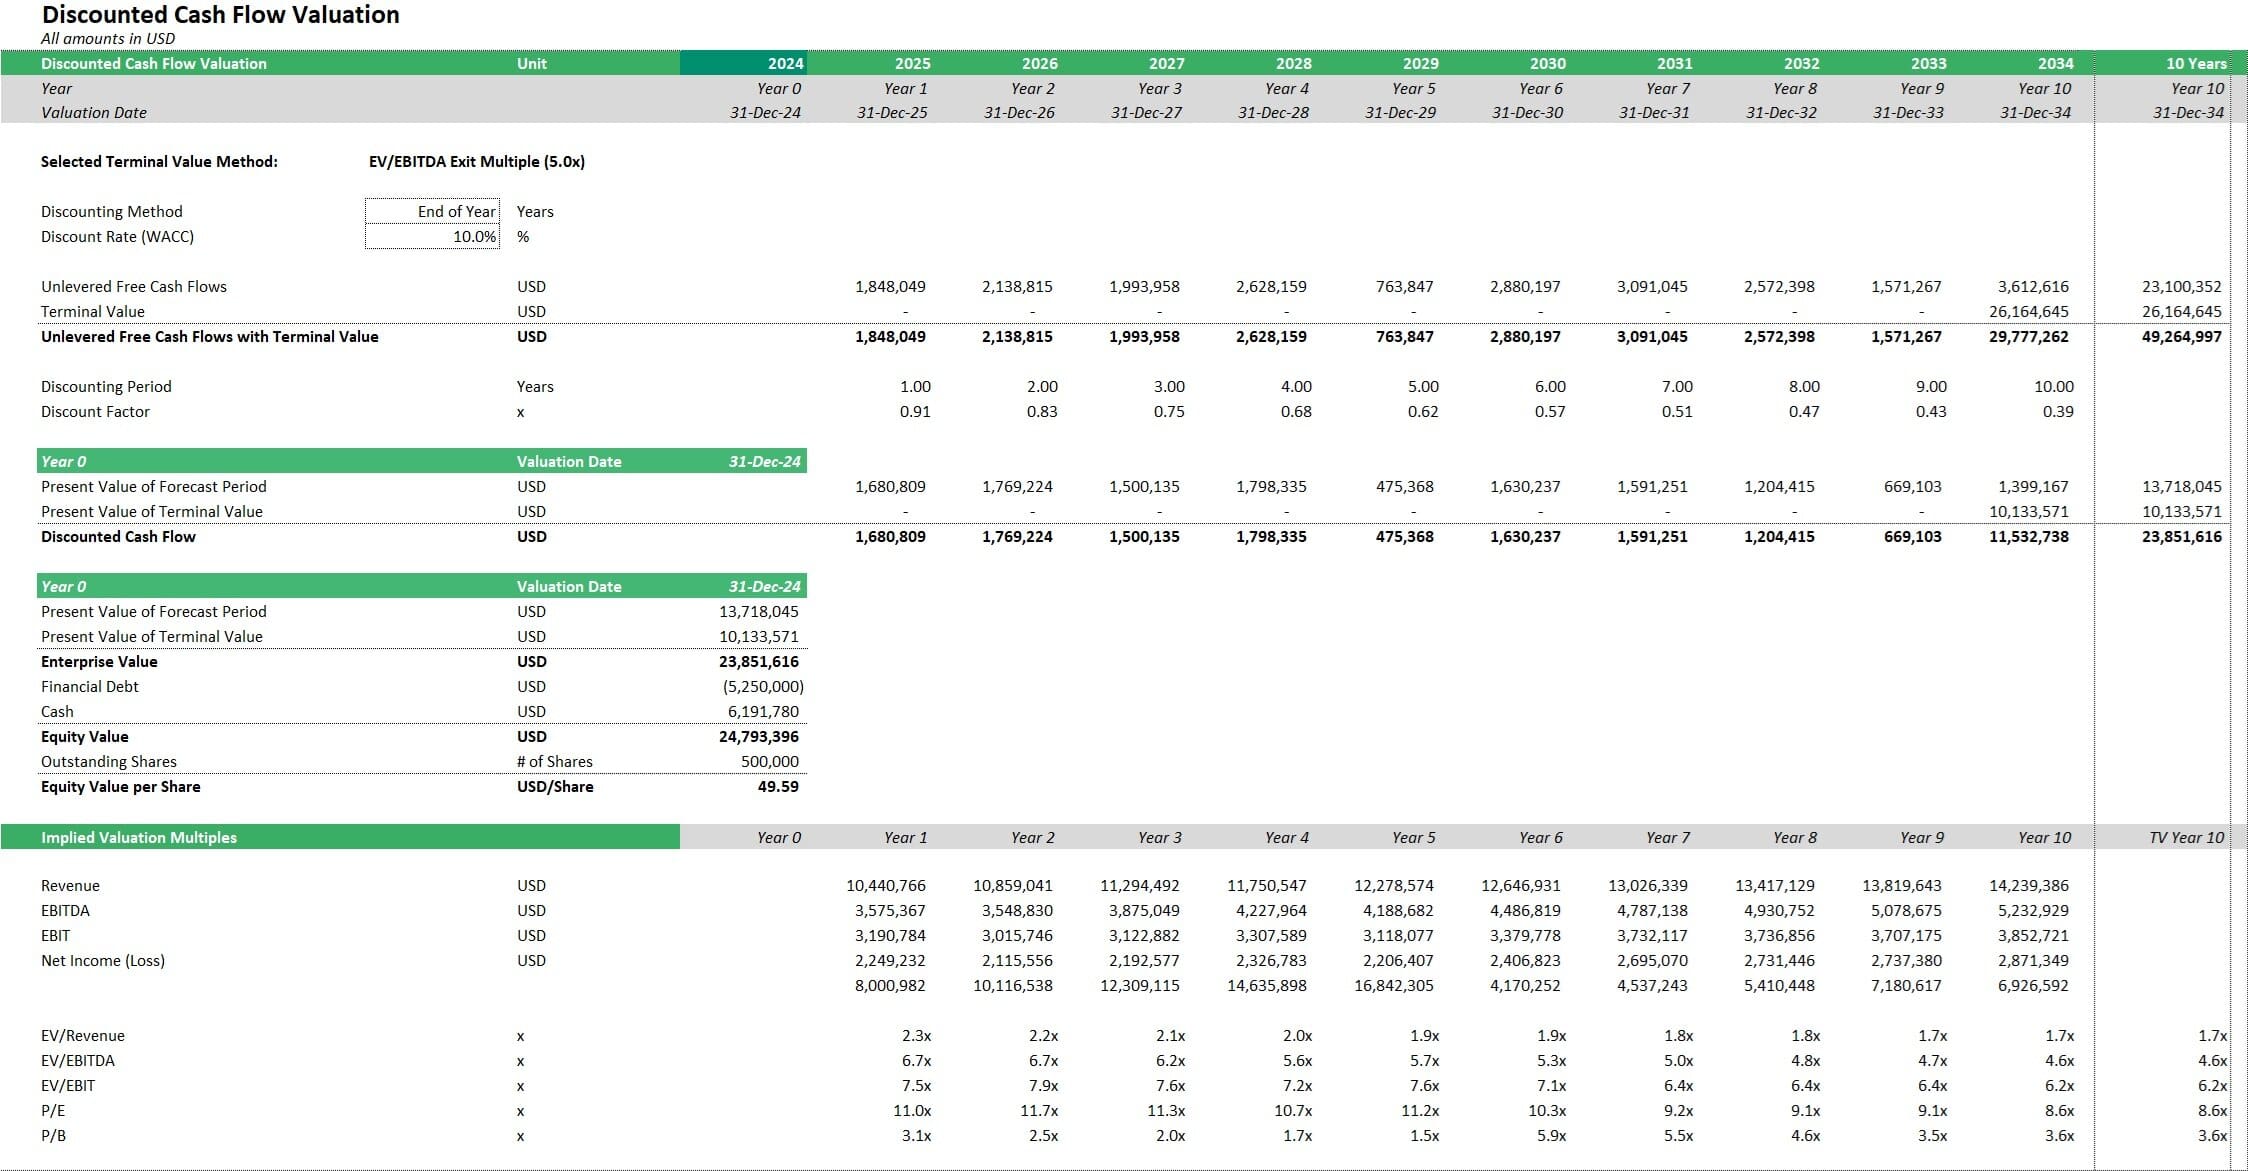
Why a 10-Year Monthly Forecast Model Matters
For a robust valuation using the Discounted Cash Flow (DCF) method, a detailed 10-year monthly forecast offers significant advantages, providing a comprehensive and nuanced understanding of a company’s long-term value.
The Advanced DCF Model:
- Captures Long-Term Value: It extends beyond short-term fluctuations to provide a clearer view of sustained performance and long-term value creation.
- Incorporates Business Cycles: A decade-long horizon is more likely to encompass full economic cycles, leading to more robust and realistic cash flow projections.
- Enhances Terminal Value Calculation: A longer explicit forecast period provides a more reliable foundation for estimating the crucial terminal value in DCF analysis.
- Meets Investor Expectations: Investors often require a longer-term outlook to assess sustainability and growth potential, which a 10-year forecast addresses.
- Provides Monthly Granularity: Monthly projections capture seasonal trends and short-term operational impacts, leading to more precise cash flow estimates.
- Supports Detailed Sensitivity Analysis: A longer, granular forecast allows for a more insightful sensitivity analysis of how assumptions change over time and impact valuation.
- Facilitates Strategic Decision-Making: The detailed long-term view aids in evaluating the financial implications of strategic initiatives and long-term investments.
Unlock Deeper Insights with this Advanced DCF Model’s Features
Empower this financial analysis with this sophisticated Excel template to provide a comprehensive understanding of intrinsic value through advanced DCF techniques. Discover the key features that make this model an essential tool for valuation needs:
1. Precision WACC and Discount Rate Calculation:
Determining the discount rate is fundamental to a reliable discounted cash flow model. The template features a detailed WACC calculation module. This integrated calculator guides you through estimating this company’s weighted average cost of capital by analyzing its financing structure, including the cost of equity (often derived using the CAPM) and the cost of debt, weighted by their respective proportions. This ensures that future free cash flows are discounted at a rate that accurately reflects the investment’s risk, a crucial step in a sound DCF analysis in Excel.
2. Comprehensive and Flexible Terminal Value Analysis:
Terminal value is critical in any discounted cash flow (DCF) valuation, often accounting for a substantial portion of the total business value, especially when forecasting over a long horizon. Selecting the right method to calculate terminal value is essential, as it directly affects the accuracy, credibility, and defensibility of the model’s outcome.
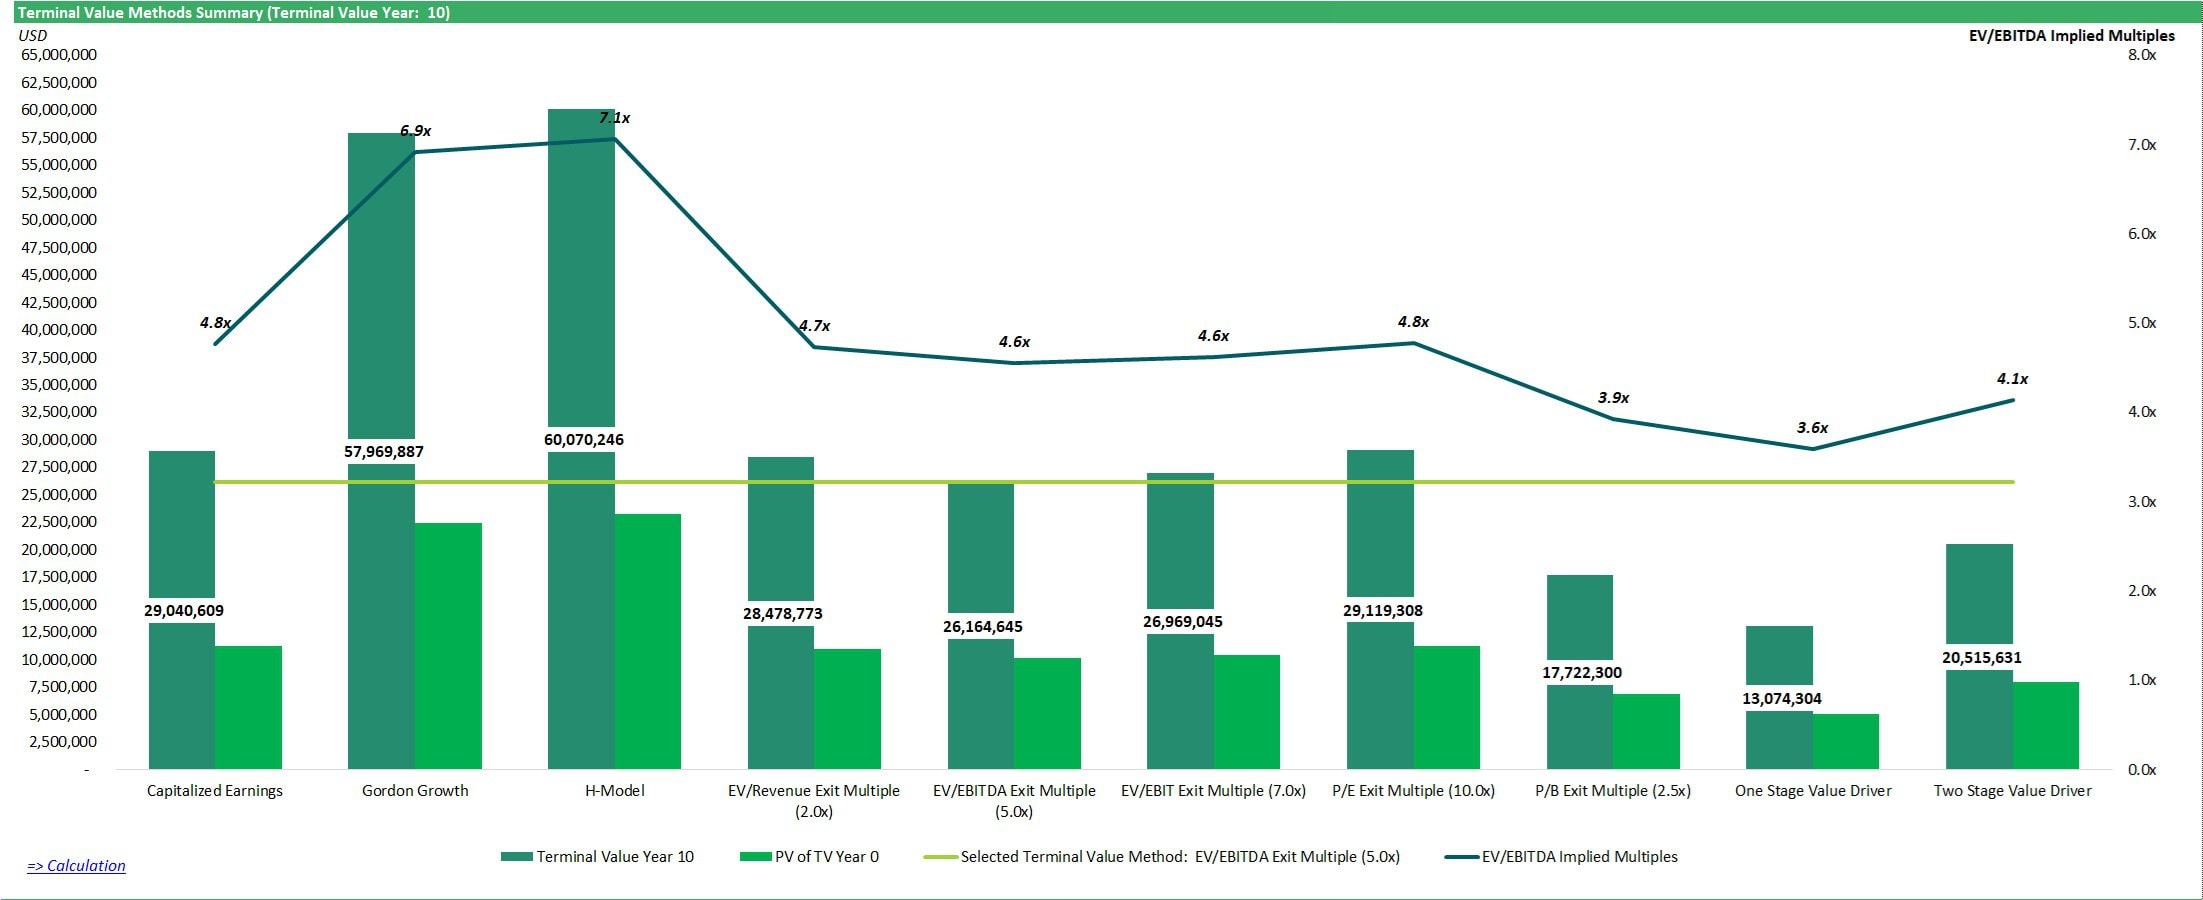
This advanced DCF model offers unparalleled flexibility with 10 terminal value methods—far more than typical templates. This allows users to tailor the analysis to specific business models, industry norms, and investor expectations. Whether one chooses the perpetual growth logic of the Gordon Growth Model or relies on exit multiples like EV/EBITDA or P/E, this model enables side-by-side comparison and deeper insight into how long-term assumptions shape valuation results.

- Capitalized Earnings – Capitalization of EBIT less taxes at the company’s discount rate.
- Gordon Growth – Capitalized free cash flows assuming perpetual growth.
- H-Model – Two-stage growth model accounting for a transition from high to stable growth.
- EV/Revenue Exit Multiple – Terminal value based on a revenue multiple at exit.
- EV/EBITDA Exit Multiple – Terminal value based on a multiple of EBITDA.
- EV/EBIT Exit Multiple – Terminal value based on a multiple of EBIT.
- P/E Exit Multiple – Terminal value derived from a price-to-earnings ratio.
- P/B Exit Multiple – Terminal value calculated using a price-to-book multiple.
- One Stage Value Driver – Models excess return into the future using a single-stage formula.
- Two-Stage Value Driver – Estimates terminal value as a function of ROIC (Return on Invested Capital) and growth in two distinct phases.
By offering a comprehensive suite of terminal value approaches, the model empowers users to adapt to various valuation contexts—whether valuing high-growth startups, capital-intensive firms, or mature businesses. It’s a powerful tool for finance professionals who must produce credible, scenario-driven forecasts.
3. Dynamic Year-by-Year DCF Forecast:
Go beyond a single-point valuation. This model provides a dynamic forecast of each year’s discounted cash flow valuation within the 10-year projection period. Understand how the business’s intrinsic value is projected to evolve year-over-year under different scenarios, offering a deeper temporal perspective on value creation.

4. Dynamic Scenario Analysis:
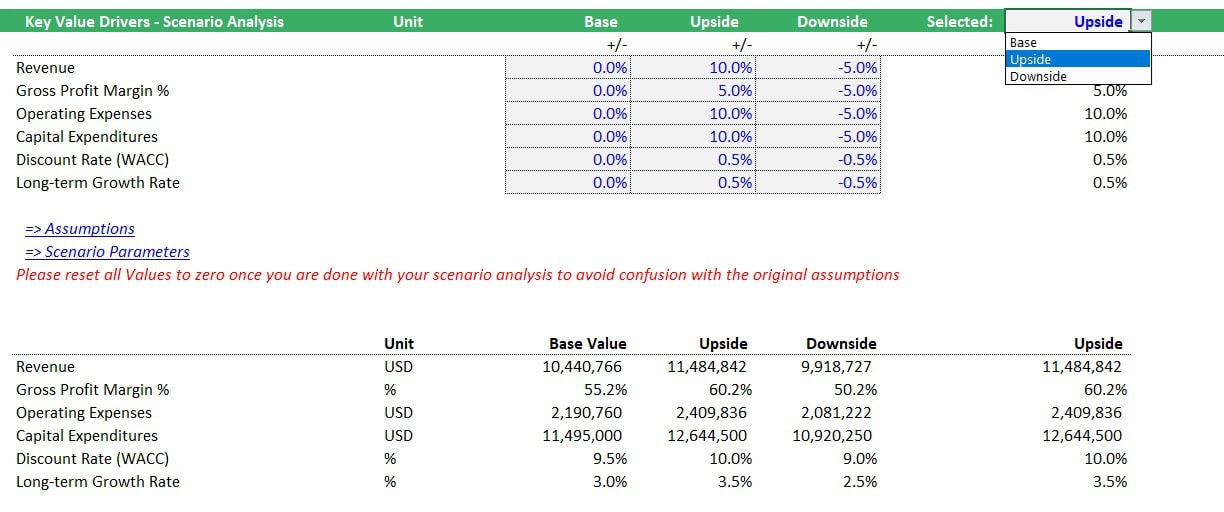
The built-in scenario analysis feature allows users to effectively explore a range of financial outcomes by adjusting key assumptions within the DCF model. By modeling base-case, best-case, and worst-case scenarios—such as changes in revenue growth, cost of goods sold, or operating expenses—users can assess how sensitive the DCF valuation is to economic or operational shifts. This structured approach to stress testing provides meaningful insights into potential risks and upside opportunities, enabling more informed and resilient decision-making.
5. Advanced Sensitivity Analysis to Uncover Key Value Drivers:
The sensitivity analysis feature empowers users to systematically evaluate how changes in critical assumptions, such as revenue growth, discount rate, and terminal value inputs, affect the final DCF valuation. The model reveals which inputs have a significant impact on valuation outcomes by isolating and adjusting individual variables. This insight is crucial for conducting focused risk assessments, performing robust financial analyses, and clearly communicating the key drivers behind valuation results.
6. Pitchbook-Ready Printable Outputs for Professional Presentations
Effectively communicate valuation insights with the model’s pitchbook-ready, printable files. These professionally formatted outputs include clear summaries of the discounted cash flow valuation results, key financial projections, and sensitivity analyses. Designed to support high-stakes presentations, they save time and ensure a polished, credible delivery to stakeholders, investors, or executive teams.
Intuitive Structure for Effective DCF Modeling
This advanced Excel template is structured for maximum clarity, ease of use, and analytical rigor. It guides users through the entire Discounted Cash Flow (DCF) valuation process, transforming raw inputs into reliable valuation outputs. From inputting assumptions to analyzing valuation results, the model ensures a seamless and professional experience tailored to financial analysts, business owners, and investors.
1. Assumptions: Centralized Inputs
All key input variables are centralized in a dedicated assumptions sheet, ensuring consistency and transparency across the model. Users can define:
- Revenue streams and growth drivers
- Direct cost structures linked to revenue
- Gross profit margin expectations
- Operating expense (OPEX) forecasts
- Balance sheet assumptions, including CAPEX and debt
- Shareholders’ equity (SHE) assumptions, including common shares and retained earnings.
This section provides the foundational logic that drives financial projections and valuation outputs.
2. Historic Financials: Data-Driven Foundation
Including up to four years of historical financial data provides a crucial benchmark for forward-looking projections, enhancing the reliability and credibility of the discounted cash flow (DCF) valuation. By analyzing past performance, users can validate assumptions, identify trends, and develop more informed projections of future cash flows, leading to a more accurate assessment of intrinsic value.
3. Ten-Year Monthly Financial Forecast
- Financial Statements Projection: The spreadsheet is designed logically, outlining the calculations of the industries’ revenues and costs, which adds to the transparency and understanding of the model. This then results in forecasted financial statement projections –
- Financial Statements: Income Statement, Balance Sheet, Cash Flow Statement, and Financial Ratios
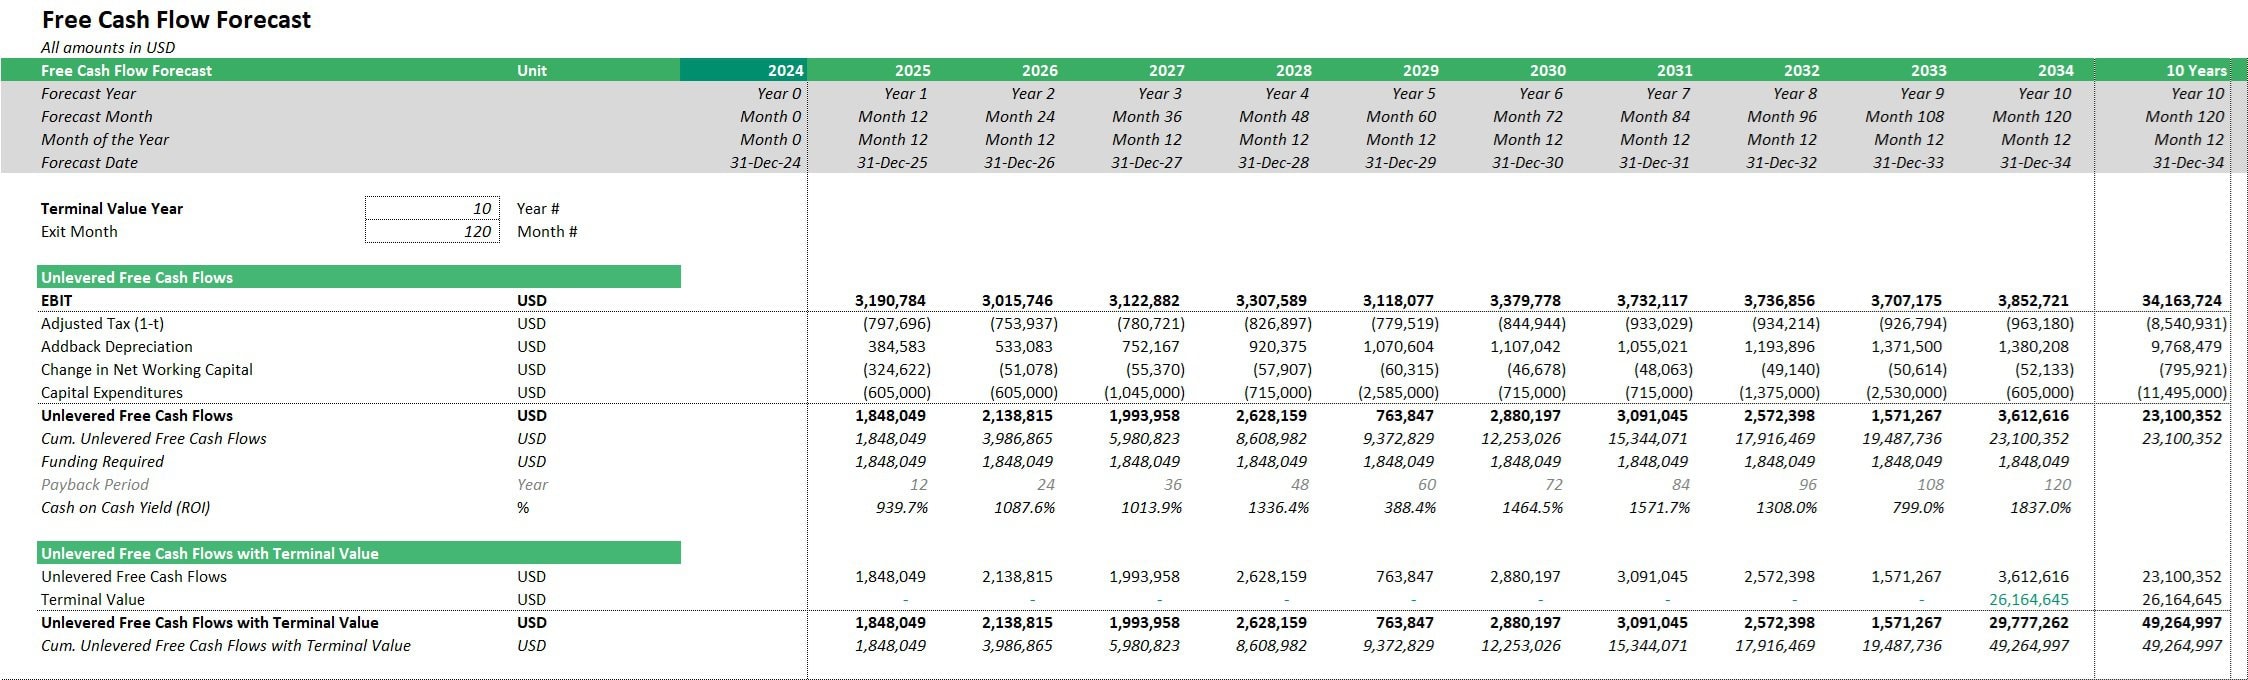
- Unlevered Free Cash Flow (UFCF) Projections: This section calculates the UFCF – the cash flow available to all investors before considering debt, which is the essential input for the Discounted Cash Flow (DCF) valuation. Projecting UFCF accurately is crucial because these cash flows are then discounted to determine the present value and thus the business’s intrinsic value.
4. Executive & Detailed Summaries
The model features an executive dashboard that distills complex data into clear visuals and concise summaries, including:
- Final DCF valuation results
- Side-by-side comparison of terminal value estimation methods
- Key value drivers derived from the scenario and sensitivity analysis
- A summarized first-year monthly financial snapshot
- Clean presentation of financial statements and valuation outcomes
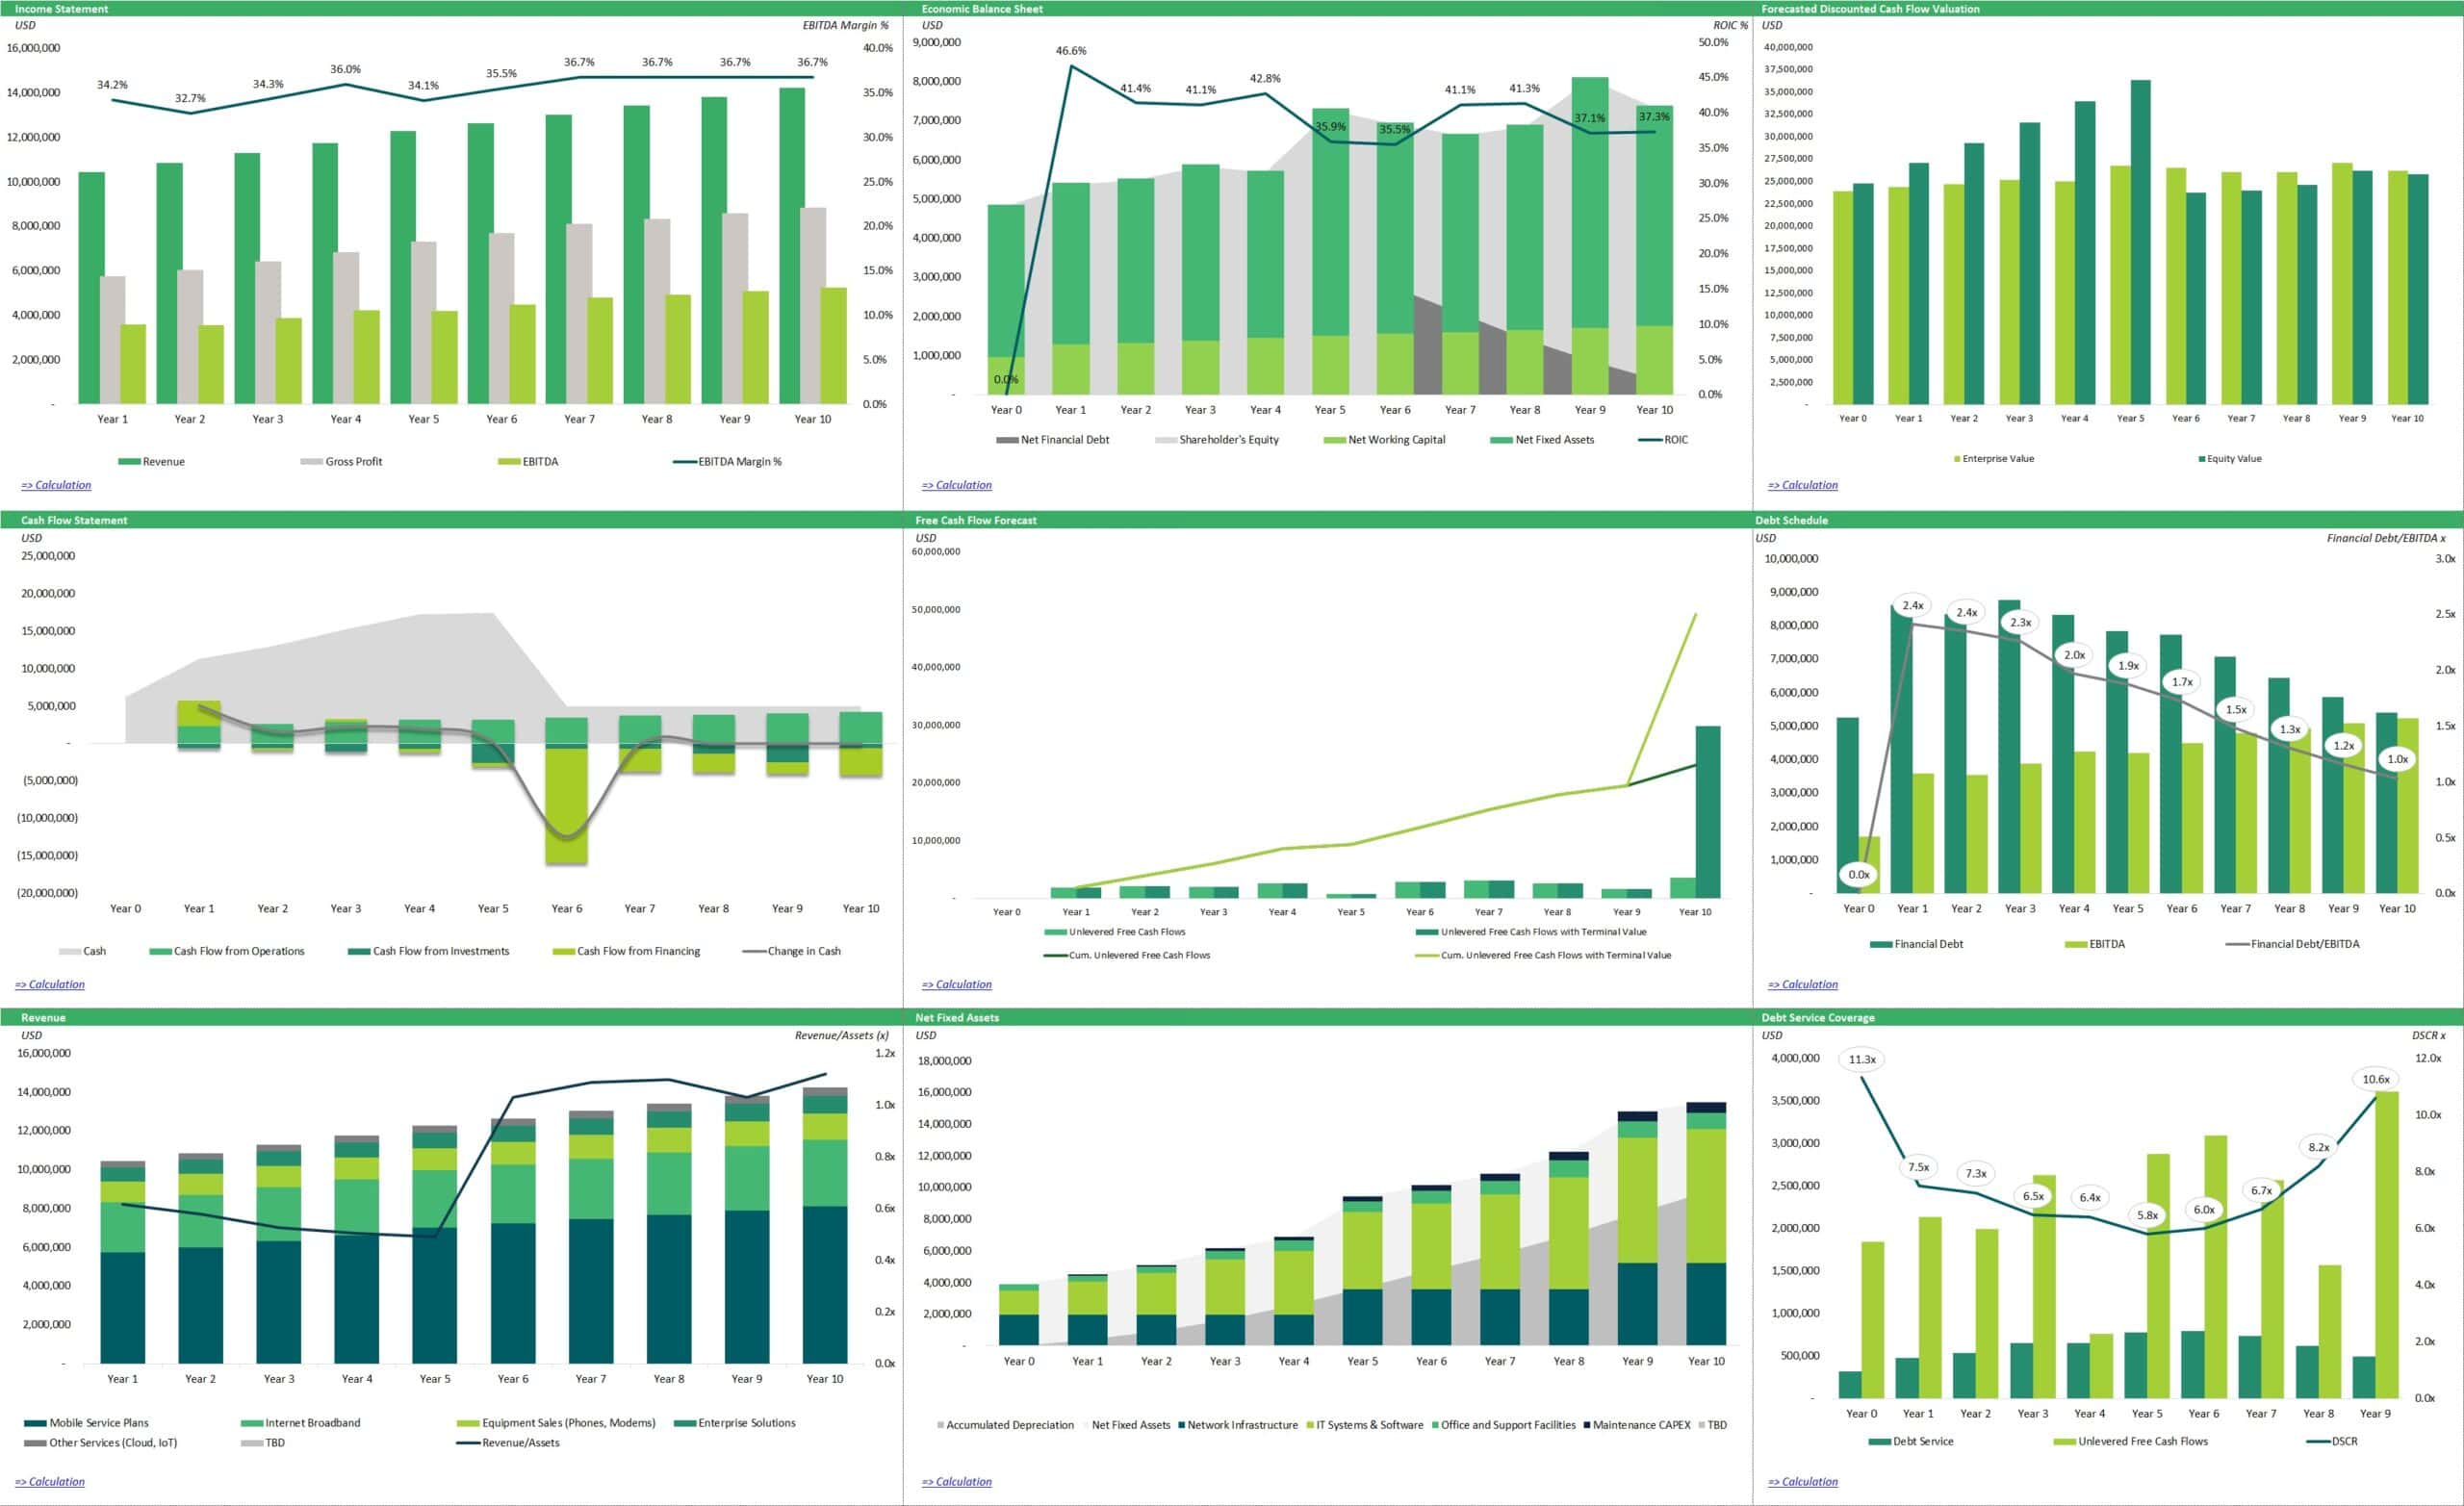
This section supports data-driven storytelling—ideal for investment pitches, internal decision-making, or due diligence reports.
Versatile DCF Applications Across Industries
DCF is widely applied in business, property, and asset valuation, and also supports investment analysis, performance measurement (e.g., Economic Value Added), and scenario planning. The technology, real estate, healthcare, and manufacturing sectors utilize DCF models to value companies, analyze capital projects, and inform strategic decisions.
Each industry requires sector-specific key performance indicators (KPIs) to create credible projections. For instance:
- Technology: Metrics like monthly recurring revenue (MRR) and user acquisition cost (UAC) reflect operational efficiency and growth.
- Real Estate: Capitalization and occupancy rates drive income forecasts.
- Healthcare: Patient lifetime value and average revenue per patient influence financial sustainability.
Using the right KPIs ensures models reflect operational realities and sector-specific risks, enhancing both accuracy and credibility.
Elevate Your Valuation Expertise with This Advanced DCF Template
Whether you’re a seasoned financial professional or new to valuation, the Advanced Discounted Cash Flow (DCF) Valuation Model Template offers the power and flexibility to assess intrinsic value with confidence. This comprehensive Excel toolkit empowers informed investment decisions and strategic choices by offering a robust framework for forecasting, discounting, and analyzing future cash flows. Stop guessing at value and download this insightful DCF model now!
Easily customize the pre-filled forecast by adjusting assumptions in blue and light blue font color to match your unique business needs.
The fully editable Excel model is currently in version 1.3. Free downloadable PDF demo versions (Excel template and Presentation Ready Version) are available to help you understand the model structure.
File Types:
.xlsx (MS Excel)
.pdf (Adobe Acrobat Reader)
Similar ProductsOther customers were also interested in...



 eFinancialModels
Electric Vehicle (EV) Charging Station Financial M...
With this comprehensive 5- or 10-year monthly tool, investors can assess the viability of setting up... Read more

Financial Model for Mobile App | Mobile App Busine...
The Mobile App Financial Plan Template in Excel allows you to develop financial projections when lau... Read more

 HenrySheykin
Food Truck Financial Model Excel Template
The Food Truck Financial Model helps entrepreneurs, founders, business owners, consultants, and anal... Read more

Green Hydrogen Production from Wind Energy Financi...
The Green Hydrogen from Wind Financial Model aims to comprehensively forecast a horizon of 40 years ... Read more

Simple Mutual Non-Disclosure Agreement Template
Protect your business secrets with ease using our Simple Mutual Non-Disclosure Agreement Template. S... Read more

Solar Energy Financial Model
The Solar Energy Financial Model Spreadsheet Template in Excel assists you in preparing a sophistica... Read more

 Peter Graf
The Customer-Centric Financial Model for Restauran...
Starting a restaurant without a financial plan is like driving a car blindfolded. You wouldn´t do i... Read more
You must log in to submit a review.