0 ITEMS

Estimating Terminal Value using a One Stage Value Driver Model
Understanding how to estimate terminal value is essential for accurate business valuation and investment decisions.
- The Terminal Value often accounts for 60-75% of the enterprise value in a Discounted Cash Flow (DCF) analysis.
- The One Stage Value Driver Model uses key drivers like ROIC, growth rate, invested capital, and discount rate to estimate terminal value.
- ROIC measures a company’s ability to generate profits relative to invested capital and is compared to WACC to assess value creation.
- This model considers long-term sustainable growth by focusing on operating profitability and capital efficiency.
Downloading an example Excel template can help apply these concepts and choose the most appropriate terminal value method.

Terminal Value represents a business’s estimated continuing enterprise value beyond an explicit forecast period, usually at the end of year 5 in a Discounted Cash Flow (DCF) Valuation.
In many cases, a standard Discounted Cash Flow (DCF) Valuation Method will derive 60% – 75% of the enterprise value from the Terminal Value. Since Terminal value can drive a large portion of the enterprise value and should therefore be evaluated carefully, selecting which Terminal Value model to use for its estimation is important.
There are various methods for estimating terminal values. One of these methods is the One Stage Value Driver Model. This article will explain how a One Stage Value Driver Mode method can allow us to estimate Terminal Value.
Another alternative is to use a Two Stage Value Driver Model, which functions on the same principles as the one stage but requires more assumptions and detailed modeling.

The fundamental concept of a One Stage Value Driver Model is that it illustrates the relationship between growth, free cash flow, and Return on Invested Capital (ROIC). An increase in the firm’s growth will require a higher percentage of the operating profit to be invested, which results in a lower free cash flow. ROIC is used to show the ability of a company to generate profits through the capital invested. ROIC is calculated by dividing net operating profit less adjusted tax (NOPLAT) over the average invested capital.
The One Stage Value Driver Model allows us to estimate terminal value using the key value drivers:
- Return on Invested Capital (ROIC)
- Growth Rate
- Invested Capital
- Discount Rate (normally the same as used in the DCF Valuation)
To understand the discussion in this article on how terminal value is estimated, you may download our Free DCF Valuation model template, which – among other Terminal Value models – includes the One Stage Value Driver Model – for calculating Terminal Value.
Key Drivers and Steps in Estimating Terminal Value
To clearly illustrate the estimation of the terminal value of the One Stage Value Driver Model, key drivers that significantly impact terminal value are explained, and steps are demonstrated below:
1) Determine Invested Capital
Invested capital is the source of funding available to the business from shareholders and debt financing providers. Cash is deducted as it is assumed that cash is used to repay the company’s debt.
Invested Capital = Shareholder’s Equity + Financial Debt – Cash
For our Terminal value calculations, we use the Invested Capital resulting at the end of your 5-year forecast period.

2) Define the Target ROIC
Return on the invested capital (ROIC) measures a company’s operating profitability in relation to the invested capital during an annual period.
ROIC = NOPLAT / Average Invested Capital
Please refer to this article here for more information about ROIC.
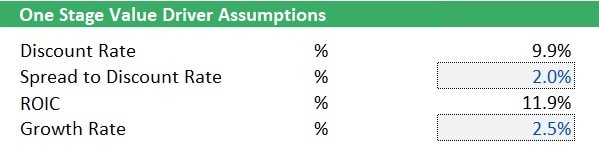
We calculate what the ROIC is expected to be over the forecast horizon of 5 years and then estimate the ROIC in the Terminal Value year. Please note that ROIC should at least generate a return same as the Discount Rate so that the business creates values. The real question is how much ROIC will exceed WACC in the Terminal Value years.
For simple calculations, ROIC is assumed to be determined by summarizing the spread to the company’s discount rate.
3) Calculate NOPLAT in the Terminal Value Year
Net operating profit less adjusted tax (NOPLAT) measures a company’s after-tax profit from operations. It is generally calculated by deducting pro forma taxes from EBIT and excludes the effect of financial leverage (debt financing). Therefore, NOPLAT reflects the operating profit a business can produce with the required capita. For our One Stage Value Driver model, we can compute NOPLAT by multiplying the invested capital at the end of the forecast period by the targeted ROIC.

4) Estimate a long-term Growth Rate
The growth rate is the expected long-term annual growth rate which applies to the expected growth in NOPLAT going forward.
5) Use the Discount Rate from the DCF Valuation Model
Also known as the Weighted Average Cost of Capital (WACC), the discount rate is the opportunity cost of capital that measures and reflects a company’s risk by estimating how much return a business should generate to compensate investors. We normally stick with the Discount Rate used in the DCF Valuation.
6) Estimate Terminal Value
Compared to the Gordon Growth formula, this model is more advantageous as it focuses on adjusting ROIC to a more reasonable level in the long term. Terminal Value is now calculated based on the relationship between the discount rate, the terminal growth rate, and the investment needed to reach that growth.
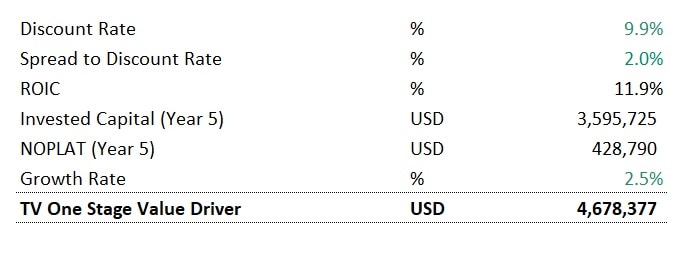
The terminal value formula used in the One Stage Value Driver Model and the detailed computation of terminal value using the assumptions mentioned above are presented in the formula and example below:

To summarize, below are the parameters and the resulting Terminal Value based on the One Stage Value Driver Model:
Understanding ROIC and WACC
Estimating terminal value as part of a Discounted Cash Flow (DCF) Valuation should always consider that the main value drivers of a business are reflected. The main value drivers in a business are the return of the invested capital that can be produced (ROIC) and how much a business can grow in the future.
ROIC is compared to a company’s WACC (Discount Rate). The primary reason for comparing a company’s return on invested capital to its weighted average cost of capital is to reveal whether the invested capital can produce superior returns compared to other investment alternatives on the stock market. Another reason is to determine if the company is capable of effectively utilizing a company’s capital to create value. If the ROIC is less than the WACC, a business destroys value as investors would be better off investing their capital in the stock market in stocks with similar risks.
An example of comparing ROIC and WACC is presented in the table and chart below:


A company consistently earning an ROIC greater than its WACC indicates that it creates value by investing in profitable projects and enjoys a strong competitive advantage. Conversely, WACC being greater indicates that the company is earning lower returns than the cost of funding the projects. Therefore, this indicates that the business cannot benefit from a competitive advantage resulting in superior financial returns. If the ROIC is equal to the WACC, the firm is operating at break-even, resulting in no increase or decrease in value creation.
ROIC and Growth are the Main Value Drivers in a Business
The One Stage Value Driver Model appears superior to alternative terminal value formulas such as Gordon Growth because it uses a company’s operating profitability (via the ROIC) and the expected growth rate to estimate the Terminal Value. A Gordon growth model neglects ROIC. Therefore, this formula can make up for some of the weaknesses of the Gordon Growth Terminal Value Formula.
The One Stage Value Driver Formula might appear more complex than a Gordon Growth Formula but still uses only a few assumptions, which makes this manageable. However, the main limitation of this formula lies in its simplicity. ROIC can still be assumed to be steady and higher than the WACC in the long term, which raises the question of whether those normalized profits are sustainable in the long term. The way to correct this weakness would be to use a Two Stage Value Driver Formula, which allows us to model one phase with high ROICs and a second Phase with lower ROIC (same or close to the WACC).

Feel free to download the sophisticated version of our Free DCF Valuation model template in Excel, which includes a variety of advanced Terminal Value Formulas, including the One Stage Value Driver Formula. Downloading this spreadsheet template allows you to compare the results using different Terminal Value Formulas and see their contribution to the overall Enterprise Value in a DCF Valuation result (typically between 60% to 70%). Surprise your investors and stakeholders using one of the advanced Terminal Value methods.