
0 ITEMS

Dialysis Center Financial Model Excel Template
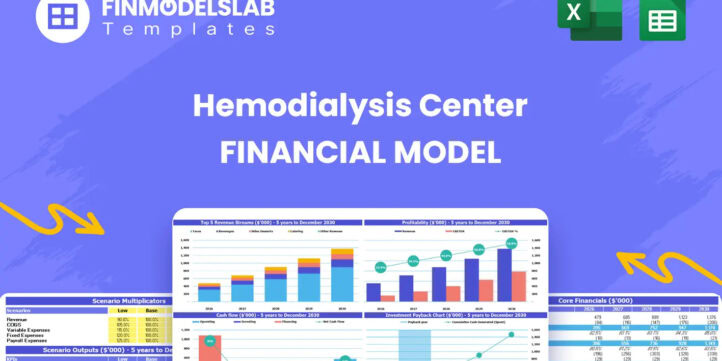
The Hemodialysis Center Financial Model helps users evaluate the financial feasibility of launching, funding, or expanding a dialysis clinic with a structured forecast built around the realities of a capital-intensive healthcare business. Instead of starting from a blank spreadsheet, users can work from a ready-to-use financial model template that connects treatment volume, practitioner capacity, utilization rates, reimbursement assumptions, staffing, equipment investment, operating expenses, cash flow, and profitability into one organized planning tool. It is designed to help turn a renal care business idea into a clearer financial plan that can support internal decisions, investor discussions, lender reviews, and business plan documentation. This template is useful for healthcare entrepreneurs, dialysis center founders, business owners, consultants, analysts, and anyone preparing financial projections for a hemodialysis center. It helps users define revenue assumptions for treatment services and related care, estimate startup costs such as dialysis machines, facility build-out, water purification systems, licensing, and working capital, and plan operating expenses such as payroll, medical supplies, rent, utilities, insurance, and administrative costs. Because hemodialysis centers often require significant upfront investment and a gradual patient volume ramp-up, the model gives users a practical way to understand how early losses, cash flow needs, and long-term profitability may develop over time. The Hemodialysis Center Financial Model is built for financial planning, scenario review, and decision-making. Users can adjust assumptions to reflect local pricing, reimbursement expectations, staffing plans, capacity utilization, supplier costs, and expansion goals. The model helps forecast monthly and annual results, review cash flow dynamics, assess profitability, evaluate break-even timing, and understand the level of funding required before the center becomes self-sustaining. This is especially valuable for a healthcare operation where fixed costs, compliance requirements, medical equipment, and staffing levels must be planned carefully before opening. With editable inputs, professional formatting, dashboard views, charts, revenue breakdowns, financial reports, and performance metrics, the template helps users communicate their financial story in a clear and lender-friendly format. It supports more confident decisions about launch timing, funding strategy, staffing, service mix, cost control, and growth planning. Whether used for a startup dialysis clinic, an expansion of an existing renal care facility, or a consulting engagement, this financial model template provides a structured foundation for analyzing the financial path from startup investment to sustainable profitability.


Financial Model Overview
The Hemodialysis Center Financial Model is a ready-to-use financial model template designed to help entrepreneurs, healthcare operators, consultants, analysts, and business plan writers evaluate the financial performance of a dialysis clinic before launch, expansion, or funding discussions. A hemodialysis center is a capital-intensive healthcare business that requires major upfront investment in treatment equipment, facility improvements, water purification systems, medical supplies, qualified clinical staff, compliance preparation, and working capital. Because revenue usually depends on practitioner capacity, treatment volume, utilization rates, reimbursement assumptions, and patient ramp-up, a structured model is essential for understanding whether the business can support its fixed costs and reach sustainable profitability. This template brings those assumptions together in one editable spreadsheet framework, helping users forecast revenue, startup costs, operating expenses, payroll, cash flow, profitability, break-even timing, and investor returns over a multi-year planning period. It is built to support practical decision-making as well as professional communication with lenders, investors, partners, and internal stakeholders.
All-in-One Dashboard
The all-in-one dashboard gives users a central view of the most important inputs and outputs in the Hemodialysis Center Financial Model. Instead of searching through multiple tabs to understand the overall financial picture, users can review key assumptions and headline results in one place. This component may include core inputs such as treatment price, patient utilization, practitioner count, staffing assumptions, cost drivers, capital spending, and financing assumptions, alongside outputs such as revenue, EBITDA, net profit, cash balance, funding needs, and payback timing. For a dialysis center, this type of dashboard is especially useful because the business depends on several connected variables, including treatment capacity, clinical staffing, fixed facility costs, supply costs per treatment, and reimbursement timing. By showing the relationship between assumptions and results, the dashboard helps users quickly assess whether the center’s plan is financially viable and where adjustments may be needed. It also supports stakeholder presentations by turning a detailed model into a clearer executive summary that can be reviewed by founders, lenders, partners, or healthcare investors without requiring them to inspect every formula.
Low, Base, and High Scenario Analysis
The low, base, and high scenario analysis component allows users to test how the hemodialysis center may perform under different operating and market conditions. In the base case, users can model their most realistic plan using expected treatment volume, reimbursement rates, utilization growth, staffing levels, supply costs, and facility expenses. The low case can be used to evaluate downside risks such as slower patient acquisition, lower insurance reimbursement, higher nurse or technician wages, increased medical supply costs, delays in licensing, or a longer ramp-up period. The high case can reflect a stronger outcome, such as faster utilization growth, better payer mix, improved scheduling efficiency, or successful expansion of related services such as nephrologist consultations and dietitian support. This component helps generate comparative outputs for revenue, operating profit, cash flow, funding needs, and profitability. For planning and funding purposes, scenario analysis is valuable because it shows lenders and investors that management has considered both risks and upside potential. It also helps business owners prepare contingency plans before problems occur, such as arranging additional working capital, controlling variable costs, or adjusting hiring schedules to match patient demand.
Professional Charts and Visual Reports
The professional charts and visual reports component converts the financial forecast into clear visual outputs that are easier to interpret and present. A hemodialysis center forecast can include many detailed assumptions, from treatment capacity and payroll to capital expenditures and cash flow shortfalls, so charts help simplify the story. This section may visualize revenue growth, EBITDA progression, net income, monthly cash balance, cost structure, funding requirements, and return metrics over the forecast period. It can also show how utilization rates improve over time as the clinic builds patient volume and how profitability changes once fixed costs are absorbed by a larger treatment base. These visual reports are useful for business plans, pitch decks, lender meetings, internal management reviews, and board presentations because they communicate the financial trajectory quickly. Instead of relying only on rows of spreadsheet data, users can use charts to explain why early cash deficits may occur, when EBITDA improves, how revenue streams develop, and what operational levers most affect profitability. This makes the model more presentation-ready and helps stakeholders understand the business case behind the numbers.
ROE Components and DuPont Analysis
The ROE components and DuPont analysis section helps users understand the drivers behind return on equity and overall financial performance. For a hemodialysis center, investor returns are influenced by more than just revenue growth. They also depend on operating margins, asset utilization, capital structure, debt levels, and the relationship between invested equity and generated profit. A DuPont-style analysis breaks return on equity into underlying components so users can see whether returns are being driven by profitability, efficient use of assets, or financial leverage. Inputs may include net income, revenue, total assets, equity contributions, debt financing, and balance sheet assumptions, while outputs may include net profit margin, asset turnover, equity multiplier, and return on equity. This is useful for investors and owners because a dialysis clinic often requires a large asset base, including expensive dialysis machines, facility improvements, and water treatment systems. By examining ROE components, users can assess whether the business is generating an adequate return relative to the capital invested and identify where performance improvements may come from, such as better utilization, stronger margins, more efficient asset deployment, or a revised funding structure.
Revenue Inputs and Assumptions
The revenue inputs and assumptions component is where users define the commercial engine of the hemodialysis center. Revenue in this type of healthcare business may be driven by the number of registered nurses, dialysis technicians, treatment chairs or machines, monthly treatment capacity, patient utilization rate, treatment pricing, reimbursement assumptions, and ancillary services. The model can also reflect different revenue streams, such as hemodialysis treatments, nephrologist consultations, dietitian services, or other renal care support offerings. Users can adjust assumptions to match their market, payer mix, expected patient volume, facility capacity, staffing plan, and pricing strategy. Outputs generated from these inputs may include monthly revenue, annual revenue, revenue by service line, utilization-based growth, and long-term sales projections. This component is critical because even small changes in utilization or reimbursement can have a major impact on profitability and cash flow. It helps users test whether the planned center can generate enough treatment volume to cover fixed costs such as rent, management salaries, clinical payroll, equipment depreciation, insurance, utilities, and administrative overhead. A clear revenue assumption section also makes the forecast easier to explain to lenders and investors who want to understand exactly how the center will make money.
Bank-Ready Financial Reports
The bank-ready financial reports component provides structured financial outputs that lenders, investors, and professional stakeholders typically expect to review. These reports may include projected profit and loss statements, cash flow statements, balance sheets, summary financials, and supporting schedules for revenue, expenses, payroll, debt, depreciation, and funding needs. For a hemodialysis center, lender-friendly reporting is important because the business may require substantial startup capital before it generates positive cash flow. A bank or financing partner will usually want to see how the initial investment is used, when revenue begins, how operating losses are funded, whether the business can meet debt service obligations, and when the center reaches sustainable profitability. This component helps translate operating assumptions into formal financial statements that can be included in a business plan or loan application. It also improves internal planning by showing the impact of decisions across the full financial picture. For example, adding machines, expanding staff, changing lease costs, or increasing working capital can affect not only profit but also cash flow and balance sheet strength. Clean financial reports help users present a more credible and organized funding case.
Revenue Breakdown by Service Stream
The revenue breakdown by service stream component gives users a more detailed view of how income is generated across the hemodialysis center’s services. Rather than treating all revenue as one total number, this section can separate core hemodialysis treatments from related revenue categories such as nephrologist consultations, dietitian services, or other clinical support services. Users may input pricing, volume, frequency, capacity, and utilization assumptions for each stream, allowing the model to calculate how each service contributes to total revenue. This is useful because different services may have different margins, staffing requirements, scheduling constraints, and reimbursement profiles. For example, hemodialysis treatments may drive the majority of revenue but also require significant supplies, clinical staff, and equipment capacity, while ancillary services may improve patient care and add incremental income with a different cost structure. A revenue breakdown helps users evaluate which services are most important for growth, where operational focus should be placed, and how changes in service mix may affect profitability. It also strengthens business planning by giving investors and lenders a clearer explanation of the revenue model, rather than presenting a single undifferentiated sales forecast.
KPI Dashboard and Industry Benchmarks
The KPI dashboard and industry benchmarks component helps users measure the hemodialysis center’s projected performance against practical operating and financial indicators. Key performance indicators may include utilization rate, revenue per treatment, treatments per month, gross margin, EBITDA margin, payroll as a percentage of revenue, supply cost per treatment, cash runway, break-even progress, debt service coverage, and return metrics. Benchmarking can help users validate whether assumptions are realistic compared with industry expectations or internal targets. For a dialysis clinic, this is especially important because the business has a high fixed-cost base and relies on achieving sufficient patient volume to spread those fixed costs across more treatments. If staffing ratios, supply costs, margins, or utilization assumptions are too aggressive, the KPI dashboard can help users identify the issue before presenting the plan to investors or committing capital. This section is also useful for ongoing management after launch because it can become a tracking tool for comparing actual performance against the forecast. By monitoring KPIs, users can make better decisions about hiring, scheduling, pricing, cost control, supplier negotiations, patient acquisition, and expansion timing.
Startup Cost and Capital Investment Plan
The startup cost and capital investment plan helps users estimate the total funding required before the hemodialysis center can begin operating and generating consistent revenue. A dialysis clinic may require significant upfront spending on hemodialysis machines, facility build-out and renovation, a water purification system, medical equipment, furniture, technology, licensing, professional fees, deposits, initial inventory, staff training, pre-opening payroll, insurance, marketing, and working capital reserves. This component organizes these costs into a structured budget so users can see where capital will be deployed and how much cash is needed before the center reaches self-sufficiency. It can also separate one-time capital expenditures from recurring operating expenses, which is important for lender review and internal planning. Outputs may include total startup investment, required owner equity, debt financing needs, initial cash balance, and a schedule of capital spending by category. This section is useful because underestimating startup costs is one of the biggest risks in a healthcare facility launch. By planning the investment in detail, users can avoid unexpected funding gaps, prepare a stronger loan request, and make more informed decisions about facility size, equipment count, renovation scope, and launch timing.
Break-Even and Payback Analysis
The break-even and payback analysis component helps users understand when the hemodialysis center may become financially self-sustaining and when the initial investment may be recovered. Break-even analysis compares projected revenue with fixed and variable costs to estimate the point at which total income covers total expenses. For a dialysis center, this depends heavily on patient volume, treatment utilization, reimbursement rates, clinical payroll, medical supplies, rent, utilities, insurance, administrative costs, and capital-related expenses. The model can calculate monthly or annual break-even timing and show how changes in assumptions affect the path to profitability. Payback analysis focuses on how long it takes for cumulative cash flow or investor returns to recover the initial capital invested. This is particularly important for owners and investors because dialysis centers may experience early operating losses while patient volume ramps up and fixed costs remain high. The section helps users assess whether their funding plan is sufficient to support the business through the pre-profitability period. It also supports strategic decision-making by showing how faster patient acquisition, improved utilization, better reimbursement, tighter cost control, or additional services can shorten the time to break even and improve overall investment attractiveness.
File types:
Excel – Single-User: .xlsx
Excel – Multi-User: .xlsx
Similar ProductsOther customers were also interested in...



 HenrySheykin
Gynecology Financial Model Excel Template
The Gynecology Clinic Financial Model Financial Model Template helps entrepreneurs, clinic founders,... Read more
Clinical Lab Financial Model Excel Template
The Clinical Laboratory Financial Model helps users turn a diagnostic lab concept into a structured ... Read more
Blood Bank Center Financial Model Excel Template
The Blood Bank Financial Model helps users turn a blood bank, blood collection facility, or blood ce... Read more

 ExcelFinModels
Dental Imaging Center Financial Model
The Dental Imaging Center financial model is a comprehensive tool designed to analyze and forecast t... Read more
Imaging Center Monthly 5-Year 3-Statement Financia...
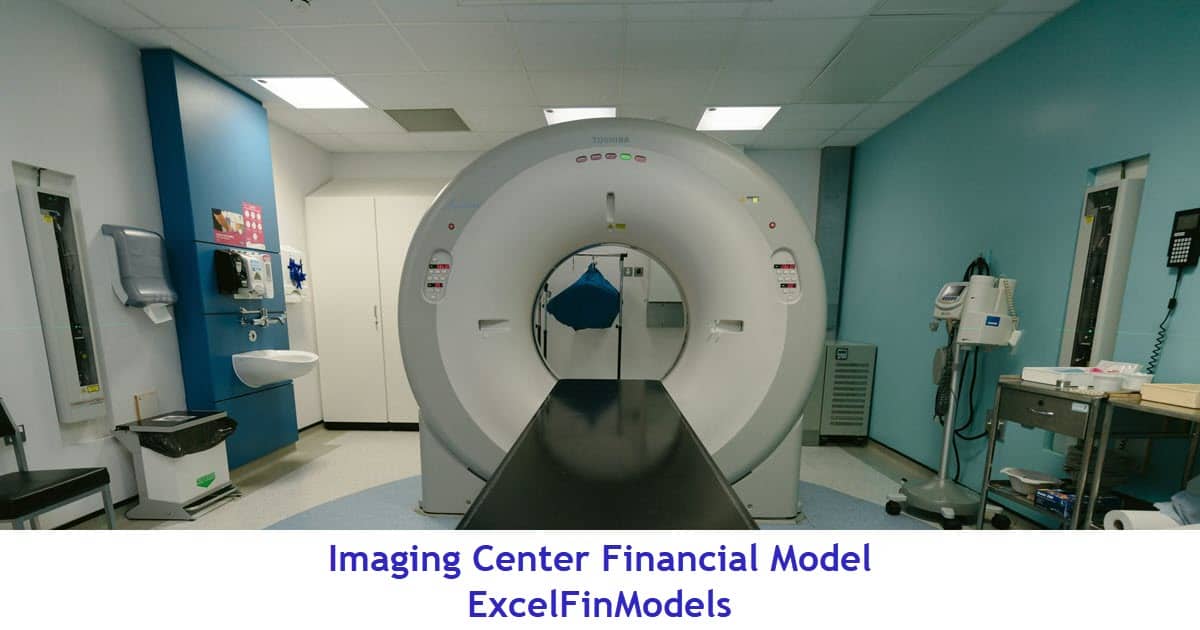
This comprehensive financial model is designed for imaging centers, covering key revenue streams suc... Read more

Veterinary Imaging Center Monthly 5-Year 3-Stateme...
The Veterinary Imaging Center financial model is designed to analyze and forecast the financial perf... Read more

Radiology Centers ( Interventional Radiology (IR) ...
The Interventional Radiology (IR) Center Financial Model is a comprehensive and versatile tool desig... Read more

Mobile Imaging Center Financial Model
This Excel model facilitates mobile imaging services by providing equipment and staff directly to th... Read more

Diagnostic Collection Center Financial Model
It is financial model for diagnostic collection center whose phlebotomists collect samples for blood... Read more

Diagnostic and Analysis Center Financial Model
It is excel financial model for financial forecasting of a diagnostic and analysis center that colle... Read more
You must log in to submit a review.