Measuring and Modeling Seasonality Template
Many businesses are affected by seasonal demand changes. They cause their revenues, expenses, and resource requirements change through the year. It is, therefore, critical to understanding seasonality of your business in order to make accurate plans and budgets, and this publication contains a set of very practical tools to analyze seasonal fluctuations.
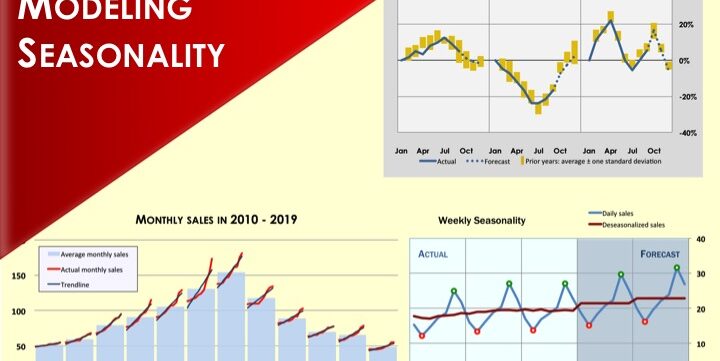
Many businesses are affected by seasonal demand changes. They cause their revenues, expenses, and resource requirements change through the year. It is therefore critical to understand the seasonality of your business in order to make accurate plans and budgets.
This publication contains a set of very practical tools to analyze seasonal fluctuations. They are accompanied by detailed explanations and professionally designed charts to help communicate the outcomes. The tools can be used for in-house analysis, management or shareholder reports, due diligence, or consulting assignments.
These tools explain how to:
– Identify and quantify seasonal changes and visualize seasonal patterns on the charts
– Track current year-to-date sales (of different products) and compare them visually against historic ranges
– Remove the effect of seasonality from the numbers in the right way
– In the opposite case, apply seasonal indices to forecasted numbers
– Understand the company’s performance relative to normal seasonal variation
– Build forecasts taking into account seasonality patterns
The methods provided in this publication are equally applicable to sales, expenses and physical measurements.
As a bonus tip, the post also demonstrates how to properly build trend forecasts based on historic data and explains why commonly used CAGR rarely gives reliable future estimates.
Similar Products
Other customers were also interested in...
Product Dealer Startup – The Customer Centri...
With this financial model, you can create a financial plan for the startup of your product dealershi... Read more
Complete Three-Statement Quarterly Budget with Sce...
This is a comprehensive set of templates that will help you build your budget. The templates are bui... Read more
Complete Three-Statement Quarterly Budget
This is a comprehensive set of templates that will help you build your budget. The templates are bui... Read more
Complete Three-Statement Monthly Budget with Scena...
This is a comprehensive set of templates that will help you build your budget. The templates are bui... Read more
Complete Three-Statement Monthly Budget
This is a comprehensive set of templates that will help you build your budget. The templates are bui... Read more
Complete Private Equity (LBO) Financial Model
This is a professional financial model which performs a thorough assessment of a private equity proj... Read more
Private Equity Fund Model (Investor Cashflows)
Private Equity Financial Model to analyze fund cashflows and returns available to Limited Partners (... Read more
All My Financial Models, Spreadsheets, Templates, ...
Lifetime access to all future templates as well! Here is a set of spreadsheets that have some of the... Read more
Due Diligence P&L – Exhaustive Revenue a...
Model for in depth understanding of high level profit and loss and revenue analysis. Big-4 like chec... Read more
Advanced Financial Model with DCF & Valuation
General Overview Advanced Financial Model suitable for any type of business/industry and fully cu... Read more
You must log in to submit a review.


