How to build a SaaS Financial Model

Summary on How to Build a SaaS Financial Model
In principle, you need to model how the key value drivers of relevance to SaaS businesses will affect the financial performance of your SaaS business.
The first modeling challenge is to model the revenues. Subscriptions are initiated every month but will expire at some time. Some of the previous subscriptions will be renewed, some not. So, it’s very important to carefully build your revenue forecast and monitor your forecast for the resulting Monthly Recurring Revenue you will obtain via your SaaS business. Once the revenue model is built, you will need to project and map the expenses to the revenue forecast. Variable costs will be tied to your projected revenues. Fixed costs will occur in any case. Once these P&L elements are clear you need to start working on creating a multi-year three statement model, consisting of a P&L, Balance Sheet and Cash Flow Forecast. With this, you’ll be able to get a comprehensive overview of your business’ financial performance, capital requirements and financial situation over the next years. Your SaaS three statement model will then also become a very useful tool for potential investors and stakeholders to better understand your business.
Developing the cash flow statement at the end is very critical for your business, since it will give you a scenario of how your management decisions will actually lead to the cash flow creation. Lastly, some visualization of the key pieces in form of charts and summaries is to allow for a quick understanding of the performance of a business. This, in turn, will be greatly appreciated by any user as it is very convenient and makes the financial model easy to understand.
Of course, the best plan is a solid plan that’s plausible, realistic, and actionable. Therefore, being honest in taking your key metrics, assumptions, and expected figures will help you to improve your financial decision making. If you want to try building a SaaS financial model, start off with a SaaS Financial Model Template first to guide you and let yourself familiarize on what a SaaS financial Model looks like and how it works.
The Software as a Service (SaaS) Business Model
Software as a service, or mostly known as SaaS, is a software distribution business model hosted by third-party providers on an online platform in which a software is licensed on a subscription basis over the internet. Basically, SaaS removes the need for entities to install and run applications on their own computers or data centers by renting out the software tools needed for users to use without having to buy the whole software or application. Thus, this eliminated the excess expenses for hardware acquisition, provisioning, maintenance, software licensing, installation, support, etc.
There are many more benefits that users can get out of SaaS business models such as:
- Flexible payments – Due to the subscription basis option, the users only need to pay depending on the terms of renting period (usually monthly) and can easily terminate the subscription any time to stop the recurring costs.
- Scalable usage – Since it’s a Cloud service, SaaS can offer high scalability and control over how much a user can access or restrict the services and features provided.
- Automatic updates – One of the best factors that make SaaS attractive for users is the automatic updates. Updates will be automatically added and performed without the need for users to pay again or purchase a new product version.
- Accessibility and convenience – As long as there’s an internet connection, with either a device or a computer, one will be able to access SaaS applications or services.
As for SaaS business owners, the attractiveness of the subscription-based model is very high thus, it is unquestionable as to why the SaaS industry boomed in no time. But of course, that which glitters is not always gold. Everyone started from somewhere and the same goes for any SaaS businesses.
SaaS Business Model in Excel
Software as a Service (SaaS) Businesses has experienced quite a boom in the last years due to technological development and customer demand for flexible outsourced IT applications via cloud-hosted services. Therefore, especially SaaS business models, are in high favor in the Startup scene and many companies are then seeking financing. When seeking financing, Startups will be required to present to their investors, partners, and co-founders a solid SaaS financial model in Excel showing how the company can generate revenue and profits in the long term to ensure expected returns and feasibility.
Developers are not all-knowing, and it can be quite challenging for those who don’t have extensive know-how in accounting and financial modeling. Creating a SaaS business model in Excel takes some time and makes the developers frown just thinking of all the calculations and projections to be shown in an excel file. This also applies to those that didn’t have the experience when it comes to creating a financial model. Thus, to help you go through the process, let us explain how to build such a financial model for SaaS businesses on an Excel spreadsheet and determine which are the key topics to be covered in order to come up with a solid SaaS financial model serving as a basis for the business plan presented to the investors.
This article will go through each topic of relevance to a SaaS business model in Excel and explains how to construct a simple, easy-to-use, financial model in Excel for a SaaS business. For your reference, please find here the full SaaS Financial Model for download. This model will help you understand better and at the same time provide you with a template that you can work on as we explain the key elements in a SaaS financial model.
Manufacturing KPI Management Excel Dashboard
A manufacturing key performance indicator (KPI) is a clearly defined…
Multifamily Rehab Model (Includes Investor Returns Waterfall)
Introducing the Multifamily Rehab Flip Model with Investor Returns Waterfall…
EV Charging Station Finance Model
Provides a comprehensive analysis of the financial viability and potential…
Project Finance Excel Model – 10 Year Projection
The template creates a financial model for your individual project…
Architecture Firm Management Dashboard Excel Template (6 Month)
Our Excel dashboard and template streamline small and medium architecture…
Startup Company Financial Model – Dynamic 3 Statement Financial Projections up to 8-Years
Highly Dynamic and Easy-to-Navigate Excel Financial Projections Model that allows…
Advanced Financial Model – Dynamic 3 Statement 10-Year Financial Model with DCF Valuation
Advanced, Dynamic and Easy-to-Use Excel Financial Projections Model that allows…
Veterinary Imaging Center Financial Model
The Veterinary Imaging Center financial model is designed to analyze…
Custom Financial Model Design Service
Unlock the power of strategic financial planning with The Company…
Creating a SaaS Financial Model using a Template in Excel
- Number of Subscribers
- Subscription Packages / Pricing
- Payment Options
- Churn Rates
- Revenues of a SaaS Financial Model
- Monthly Recurring Revenues (MRR)
- Customer Lifetime Value
- Customer Acquisition Costs
- Operating Costs (OPEX)
- Net Working Capital
- Cash Flows
- SaaS Software Development Costs
- Fixed Assets
- Financing of the SaaS Business
- Payback Period
- Internal Rate of Return (IRR)
- Breakeven
- Yearly Financials
- Charts
Number of Subscribers
A SaaS business model in Excel is modeled mainly on the number of subscribers as the software is sold as a service through subscriptions. So, we have to prepare a SaaS financial plan most likely on a monthly basis where we project how many new subscribers can be added as new customers to the SaaS business per month. Obviously, there will be only a few at the beginning as a Startup and more monthly additions later on, once the business gets bigger and better. For our modeling purposes, we keep the assumptions simple and take a view on how many new subscribers can be obtained per month for the first five years as shown below.

So, we use the above assumptions and plot them in a monthly operational plan in our SaaS financial model. We leave another row empty to count for existing subscribers who choose to renew their subscriptions later on. Thus, this allows us to know how many subscriptions can be sold in which month. If more precision is needed, the assumptions could be fine-tuned further by e.g. increasing the new subscribers steadily on a monthly basis or vary them as we like as shown in the picture below. For our purposes and to keep our SaaS business model Excel simple, we just go with the above assumptions. This can be, of course, adjusted accordingly but we recommend being realistic with the expected figures to ensure the accuracy of the model.

Subscription Packages
Most SaaS business models in practice offer a minimum of three different subscription packages in order to attract different buyer segments. So, we can then input the planned pricing of the subscription packages. We also need assumptions about what will be the expected % split of packages purchased by the company’s customers. We do that by taking an educated guess of the revenue split obtained from the sale of Basic, Standard, and Premium packages, based on benchmark data from similar SaaS businesses as shown in the picture below.

The % package split purchased will then also go into the monthly SaaS financial projections used to calculate the number of the different packages sold for each month. Also, here, the % split assumption could be varied over time if more precision is needed. For our demonstration purposes, we keep the assumptions as they are. The data is then used to create a table where we can easily understand what subscription types will be sold each month and where the subscribers come from (new or from renewal). Our SaaS business model in Excel, therefore, starts to take shape.

Payment Options
Subscription businesses such as SaaS, normally face a financing gap as their investment (software development and marketing) mostly is upfront while revenues arrive much later on. For this reason, it makes a lot of sense for SaaS companies to ask their customers for advance payments of up to 1 year (or even more) by providing attractive discounts in order to motivate their customers to subscribe on a long-term basis. Advance payments are thus a key tool to close the financing gap for SaaS businesses.
Our SaaS financial model allows us to count for prepayment discounts, thus, we simply can input how much discount we are willing to give for a 1 year, 6 months, or 3 months subscription period, instead of a monthly subscription. Now, all we need is to take a view of the expected payment preferences made by our customers and estimate the % breakdown of the subscription periods requested by the customers. Thus, we assume a % split of subscriptions paid as yearly, 6 months, 3 months, and monthly subscriptions and the result will be that we know how many discounts we need to give to motivate our customers to subscribe to us.

Using the above assumptions allows us to project the estimated number of subscriptions sold broken down for each payment option. The total will correspond again with the total of subscriptions sold in that month.

We can even be more precise now and provide a more detailed breakdown of how many of the Basic, Standard, and Premium Subscriptions are sold under which payment method. This will allow us, later on, to attribute different prices for each combination of subscription/payment options and calculate the expected monthly revenues.
While the calculation might not hold for each and every month, it can serve as a benchmark to compare the effective results too. While we go along with the rollout of the business, then we can steadily check our actual results to improve the accuracy of our assumptions in order to come up with an updated model version. Also, the model structure helps us to ask the right questions and forces us to think about new ways to move people from Basic to Premium subscriptions and motivate them to go for longer subscription periods.

Churn Rates
The last factor we need to know when calculating the number of monthly subscribers, is the churn factor – the % of existing subscribers who will get lost, as customers might decide not to renew the subscription for whatever reasons: E.g. they might be unhappy with the service or the pricing; the customer might need a different service or there might be other reasons which should be explored to better understand the decision-making process of the customers.

Thus, we need to take a view on the churn factor (in this case we used 30%) which will then also give us the % of existing subscribers who will choose to renew their subscriptions with us (remaining 70%). The churn rate is an important factor which needs to be tracked going forward for a SaaS business as, obviously, the goal will then be to find new ways to minimize the churn rate.
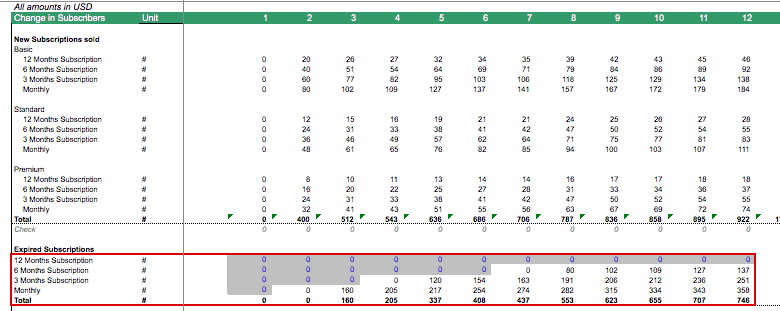
We now can simply calculate how many of the expired subscriptions will renew (70% of expired subscriptions assumed) and how many will be lost due to churn (30% of expired subscriptions). Subscriptions to be renewed, we can add again to the new subscribers as we have discussed before. This way the financial model will give us all the data we need to know – at which time how many subscribers we have, where they come from (new or renewal), which type of subscription packages are sold, and how many discounts will need to be given.

Revenues
This time, we will use the assumptions from before and multiply the following factors to calculate the monthly revenues:
- number of subscribers added – as per their chosen subscription packages – by
- the order values of their subscriptions by
- the period length (the number of months subscribed) and
- the discounts are given due paying in advance for longer time periods
To keep our SaaS financial model simple, we booked the revenues as they are received without further accounting consideration as we are only interested to understand the cash flow implications of our SaaS business as shown below:


Monthly Recurring Revenues (MRR)
Recurring revenues provide a steady cash flow stream to the business. To investors, recurring revenues are very valuable as they exclude one-time effects and give a more stable basis for their expectations on how the business will perform so that they can base an offer to invest on MRR figures. Therefore, SaaS companies will need to focus on the Monthly Recurring Revenues (MRR) and build an investment case, where they demonstrate that in a certain period of time, MRR will exceed the monthly costs and thus, the business will become profitable so that investors can exit at some point.
For financial modeling purposes, in our SaaS financial model, we calculate the MRR by taking the new monthly subscriptions sold and divide them by the subscription period (measured in months). Afterward, we calculate the total of the monthly equivalent amount of subscriptions sold (new MRR). MRR now simply is a function of the MRR of the previous month plus new MRRs obtained from subscriptions sold, and MRRs deducted as they expire.

Customer Lifetime Value
Another interesting concept for SaaS business models is the Customer Lifetime Value – corresponding to the total revenues or gross profit received from an average customer during his total lifetime. Why this metric is so important? – The reason is that we need to ensure that whatever we spend in acquiring a new customer is less than the Customer Lifetime Value less the operating costs which this customer will create.
In order to calculate Customer Lifetime Value, we calculate the weighted average package price by multiplying:
- the % breakdown of purchased packages sold by
- the different subscription packages and
- the payment discounts we need to give (see before).
Next, we need to calculate the weighted average number of subscribed months. Afterward, we use the renewal % assumption to calculate the length for each subsequent subscription period on average. We cap the calculation at 20 time periods as afterward the incremental factor gets minimal. So, we conclude that on average, a subscriber will use the service for ca. 12 months as per the example model assumptions that are shown below.
Customer Lifetime Value can be calculated on a basis of revenues or also of Gross Profit by deducting the applicable direct costs (direct costs per month multiplied by the average subscription period).

Customer Acquisition Costs
Customer Acquisition Costs are the costs incurred to gain a new paying customer. Customer Acquisition Costs are a function of the costs per lead and the average conversion rate (from lead to paying customer). In our example, a Google Adwords campaign costs USD 0.50 per click (Cost per Click – CPC) at a 5% conversion rate, which equals USD 10 Customer Acquisition Costs.
Customer Acquisition Costs do highly depend on the type of business. Some businesses need months of lead development time, maybe even requiring sales representatives to call the customers by phone or visit them in person, which can lead to very high customer acquisition costs. On the opposite online marketing campaigns, via Google Adwords or Facebook Ads, today, offer cheaper alternatives but those lead generation methods might only work for certain types of businesses.
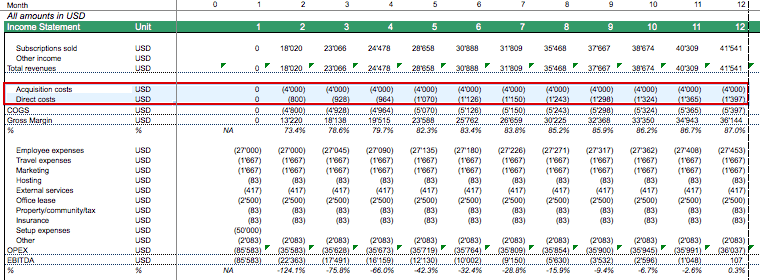
For financial modeling purposes, we keep the assumption simple as we directly enter the assumption of the expected costs needed to acquire a new customer.

If there are any other directly attributable costs, we also need to include them in the Cost of Goods Sold (COGS). By deducting the Customer Acquisition Costs and the Direct Costs from Revenues, we can calculate Gross Profit.
Operating Costs (OPEX)
In order to calculate operating profits, we need to estimate the ongoing operating costs (OPEX) of the SaaS business. These normally include employee expenses and all other operating costs such as web hosting, marketing, office rent, administrative expenses, support, etc.
Employee Costs
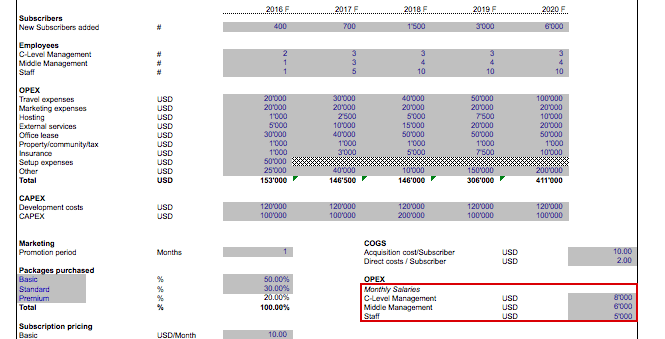
We now project the number of required employees and their salaries for each period of the business. We can simply add a hiring plan to our assumption sheet to further solidify the model’s assumptions.
Furthermore, we need to estimate the monthly salary estimations for the main employee categories, to be able to estimate employee expenses.
Other Operating Costs
For the other non-personnel expenses, we enter the yearly expenses in our assumption sheet and simply divide the yearly amounts by 12 to get the monthly operating costs.

If wished so, monthly expenses now can be adjusted for inflation by multiplying with the cost inflation factor.
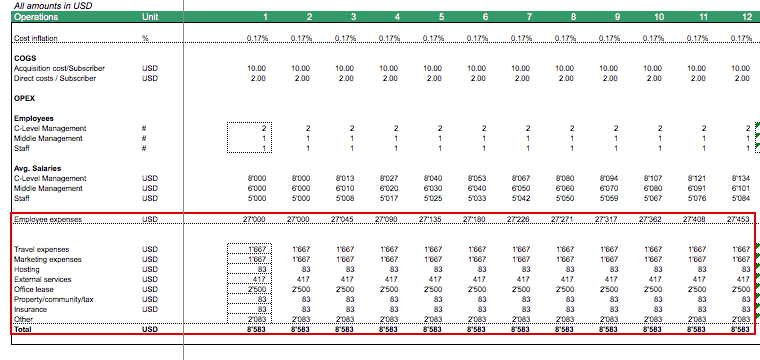
We now have all estimations we need to project Earnings before Interest, Taxes, Depreciation, and Amortization (EBITDA).
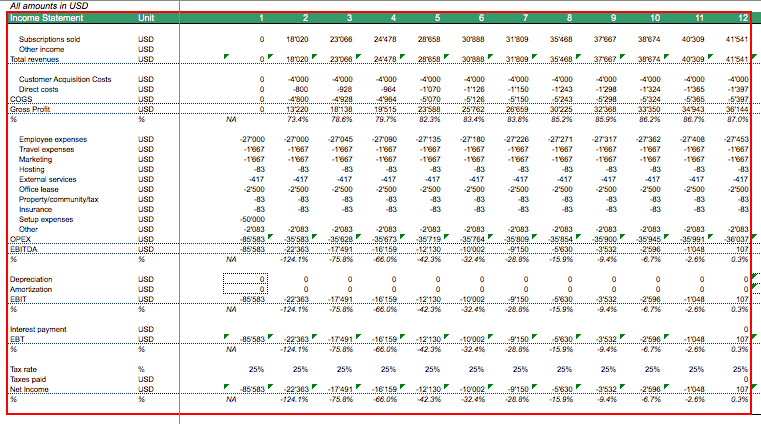
Our SaaS business model Excel worksheet should now provide a complete picture of all relevant revenue and cost positions.
Net Working Capital
Depending on the type of SaaS Business, there might also be net working capital items (Receivables, Inventory, Payables, Other Current Assets, Other Current Liabilities, etc.). In case no working capital is needed, simply put the assumptions to zero and skip this section.

In the case you need working capital items, the simplest way to estimate Net Working Capital is to use Days Receivables, Days Inventory, and Days Payables assumptions to project the working capital positions. The formulas are as provided below:
- Receivables = Days Receivables * Revenues / 360.
- Inventory = Days Cost of Goods Sold * Cost of Goods Sold / 360
- Payables = Days Payables * Cost of Goods Sold / 360
If you want to project the net working capital positions on a monthly basis, simply divide the Revenues and Cost of Goods Sold by 12. This allows you to project the Balance Sheet and more importantly the Cash position on a monthly basis.

Cash Flows
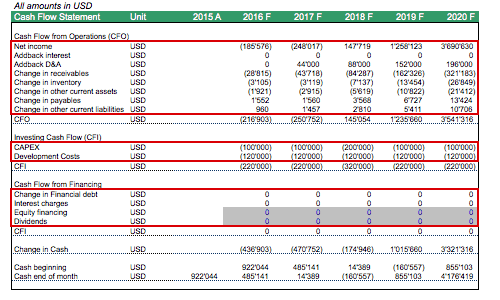
We want to track the monthly cash position as we need to ensure that we raise sufficient financing to execute the business plan and use the model to simulate different scenarios which will impact the cash position. Therefore, we need to build a detailed Cash Flow Statement for our SaaS financial model. Cash Flows from Operating Activities (CFO) are calculated by adding Interest, Depreciation & Amortization, Net Income, and the change in the Net Working Capital positions of the Balance Sheet.

Cash Flow from Investment (CFI) activities includes Software Development Costs and capital expenditures (CAPEX) related to Fixed Assets. Those are normally estimated on a yearly basis and for our modeling purposes, we need to allocate them on a monthly basis.

Software Development is an ongoing task, so we count for monthly cash expenses. CAPEX is related to purchases of hardware, PC, furniture, etc. which we assume to occur at the beginning of the year in order to be conservative.
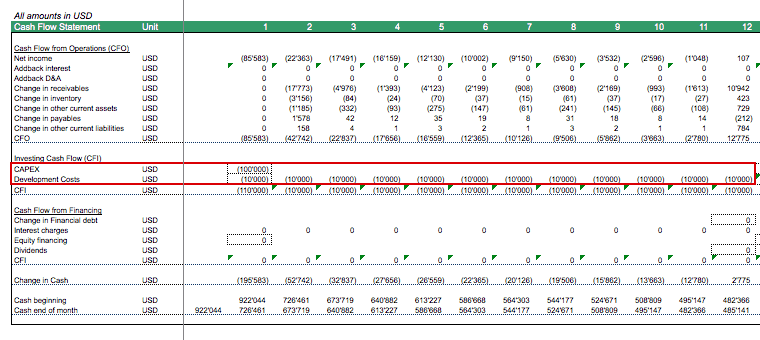
Now the only missing section for the cash flow statement is the Cash Flow from Financing Activities (CFF). For new SaaS businesses, these will be mostly equity financing.
SaaS Software Development Costs
For SaaS businesses, a lot of effort is spent on developing and enhancing the product which is Software. From an accounting perspective, Software Development Costs either can be expensed or – depending on accounting rules – activated on the balance sheet. If development costs are activated, it provides a tax shield later on when more revenues occur, and thus, taxable income can be lowered.
In our example, we assume that a prototype has been built which today costs nearly next to nothing by relying on open source software and developing under the lean startup method (early prototype to be continuously tested by the market so the product can be improved). Software development costs, thus, can get more expensive once the source code needs to be rewritten and fine-tuned to optimize processes and the quality of the service. In our example, USD 120k software development expenses per year are assumed. Below is a table that allows calculating the yearly amortization expenses and the intangible net asset position which goes into the balance sheet.

Fixed Assets
Other fixed assets which are created by capital expenditures (CAPEX) use a very similar depreciation schedule as software development costs. Instead of amortization, depreciation expenses are created (non-cash items). Therefore, we simply use a similar schedule to calculate depreciation. For SaaS businesses, CAPEX normally consists of furniture items, maybe some hardware items such as PCs, Network equipment, or even web servers. However today, the need to invest in hardware got reduced as there are many providers which offer virtual servers, therefore, eliminating the need to invest and operate their own server farms. Here is how to model Fixed Assets in a SaaS business model Excel worksheet:

So, we have calculated two more positions we need to build the balance sheet, Development Costs, and Fixed Assets. One can either build the Balance Sheet for Yearly Financials only or if more precision is needed, we can just add monthly Software Development Cost and CAPEX and deduct monthly amortization/depreciation expenses to calculate the respective balance sheet positions.

Financing of the SaaS Business
The next component needed to build the balance sheet is to include the capital raised (debt and equity). For a Startup, it will be mostly equity financing as banks only lend towards more established companies with a track record and which can offer some form of hard assets to be liquidated in case of bankruptcy.
So, the question is, how much equity is needed to get the SaaS company going? For this purpose, we need to figure out what is the missing cash position to cover all expenses, investments into software development, and CAPEX, by also taking into account the first revenues received along the way. For this purpose, we calculate on a monthly basis the Free Cash Flows to Firm, (FCFF) which is calculated by taking the cash profit (EBIT + addback Depreciation & Amortization), the change in Net Working Capital (NWC), and the investment in Software Development Costs and CAPEX. We now add each monthly loss to the loss of previous months and figure out which is the highest cumulative loss in Free Cash Flows over the first 2 to 5 years. Our SaaS financial model now answers this question:

In our example, the minimum cumulative Free Cash Flow gets USD 922k within 2 years. This balance could get more negative if one invests in growing the business further later on, but in order to get going for the first two years, we just use the USD 922k as the funding required and will use this as the required equity financing as shown on the balance sheet below.

Payback Period
Payback period is a tool to evaluate the financial attractiveness of a project from an investment point of view in our SaaS business model in Excel. We want to know by when our investment is being repaid through organic cash flows. Thus, we calculate the Free Cash Flows to Firm and measure by when the cumulated Free Cash Flow to Firm becomes positive, below is an example result in month 46.

Internal Rate of Return (IRR)
Another important metric is the IRR which can also be used to evaluate the attractiveness of a proposed investment. For this, we need the yearly Free Cash Flows and work back which discount rate is needed to make NPV = Zero, this will be the Project IRR.

Breakeven
SaaS companies want to know when they reach breakeven, meaning – by when their monthly revenues will cover their monthly costs. Here, we focus on cash profits (EBITDA) and want to know from which month onward EBITDA will become positive. The below example shows that within a year, the first profitability can be achieved.

Yearly Financials
Once we have the monthly financials ready, we can build the full-year financial statements. Thus, we simply add the twelve months of each year to form the yearly revenues and expenses, creating the Income Statement item by item.
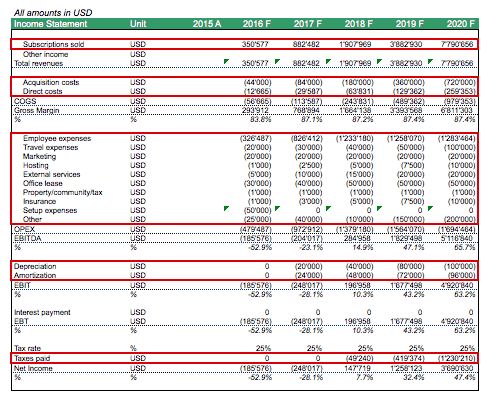
The Yearly Balance Sheet is a function of taking the projected balance sheet position of the last month of the year in our SaaS business model in Excel.
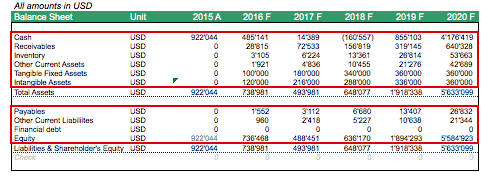
The yearly cash flow statement can be built by adding the monthly cash flows and checking back if the resulting cash generation matches the change of cash on the balance sheet.
Once we have the yearly financial ratios we want to keep track of.

Charts
Finally, as we have now calculated the monthly and yearly financials, we can summarize the SaaS business plan through several charts to have an overview of the financial model.
- Development of Revenues and EBITDA
- Monthly EBITDA indicates Breakeven
- Monthly Recurring Revenues and number of subscribers
- Cumulative Free Cash Flows showing the month of Payback
- etc.

More analysis can be performed with the above SaaS financial model when going into the scenario and sensitivity analysis.
Conclusion: SaaS Financial Modeling
This article should have given you a good idea by now on how to build a meaningful SaaS financial model in Excel as a basis for your business plan. SaaS business models are highly attractive as they lead to recurring and steady revenues. Another factor is that the risk of non-paying customers can be quite minimized when asking for payments upfront. A Startup SaaS financial model will have to plan out the cash flows on a monthly basis for budgeting purposes but will also have to prepare a 5-year financial plan to provide a picture to investors and stakeholders of what this company should be able to achieve. A detailed SaaS financial plan will, therefore, be a key tool and serve as a basis for any discussions with investors, co-founders, etc. Furthermore, a proper financial analysis should be performed by ensuring the customer acquisition costs remain lower than the customer lifetime value. Having such a business should turn into financial success and scalability, which makes it highly attractive for investors.
Please find here the full SaaS Financial Model.
Manufacturing KPI Management Excel Dashboard
A manufacturing key performance indicator (KPI) is a clearly defined…
Multifamily Rehab Model (Includes Investor Returns Waterfall)
Introducing the Multifamily Rehab Flip Model with Investor Returns Waterfall…
EV Charging Station Finance Model
Provides a comprehensive analysis of the financial viability and potential…
Project Finance Excel Model – 10 Year Projection
The template creates a financial model for your individual project…
Architecture Firm Management Dashboard Excel Template (6 Month)
Our Excel dashboard and template streamline small and medium architecture…
Startup Company Financial Model – Dynamic 3 Statement Financial Projections up to 8-Years
Highly Dynamic and Easy-to-Navigate Excel Financial Projections Model that allows…
Advanced Financial Model – Dynamic 3 Statement 10-Year Financial Model with DCF Valuation
Advanced, Dynamic and Easy-to-Use Excel Financial Projections Model that allows…
Veterinary Imaging Center Financial Model
The Veterinary Imaging Center financial model is designed to analyze…
Custom Financial Model Design Service
Unlock the power of strategic financial planning with The Company…
Additional SaaS Financial Model Templates in Excel are available as well:
Manufacturing KPI Management Excel Dashboard
A manufacturing key performance indicator (KPI) is a clearly defined…
Multifamily Rehab Model (Includes Investor Returns Waterfall)
Introducing the Multifamily Rehab Flip Model with Investor Returns Waterfall…
EV Charging Station Finance Model
Provides a comprehensive analysis of the financial viability and potential…
Project Finance Excel Model – 10 Year Projection
The template creates a financial model for your individual project…
Architecture Firm Management Dashboard Excel Template (6 Month)
Our Excel dashboard and template streamline small and medium architecture…
Startup Company Financial Model – Dynamic 3 Statement Financial Projections up to 8-Years
Highly Dynamic and Easy-to-Navigate Excel Financial Projections Model that allows…
Advanced Financial Model – Dynamic 3 Statement 10-Year Financial Model with DCF Valuation
Advanced, Dynamic and Easy-to-Use Excel Financial Projections Model that allows…
Veterinary Imaging Center Financial Model
The Veterinary Imaging Center financial model is designed to analyze…
Custom Financial Model Design Service
Unlock the power of strategic financial planning with The Company…
SaaS Financial Model (5 Year) Up to 4 Pricing Tiers
We hope you enjoyed and please leave your comments below.


