
0 ITEMS

What Are the Benefits of Using Excel Over Other Tools?

Imagine having a simple tool where you record your income and expenses. Better yet, that simple tool can help you track your budget. That’s a Microsoft Excel Spreadsheet! Businesses and individuals alike have been using Excel. In fact, out of 8 billion people in the world, around 1.5 billion use Excel.
Furthermore, 99.99% of businesses worldwide use it as a data management and analysis tool. In this article, let us explore the features of Microsoft Excel Spreadsheets. We will also uncover the benefits of using Excel over other tools.
An Overview of Microsoft Excel
Known as the grandfather of spreadsheets, Microsoft Excel started as Multiplan in 1982. It was originally a control program for microcomputers. When IBM launched Lotus 123 in 1983, Microsoft Excel lost its popularity. But in 1987, Microsoft Excel Spreadsheet returned with a vengeance, with its version 2.0 conquering Windows application. Using visual basic for applications, Microsoft opened up unlimited possibilities using Excel for data management and analysis. In 1990, version 3.0 was the first to utilize the toolbar.
Microsoft Excel Spreadsheet allows users to calculate, format, and organize data in cells, the basic unit of Excel. As an open workbook, every Microsoft Excel Spreadsheet has 1,048,576 rows by 16,384 columns. They all translate to 17,179,869,184 cells. With more than 450 Microsoft Excel formulas & functions, there are many reasons why you should use Excel for financial modeling.
Organizations and professionals commonly use a Microsoft Excel Spreadsheet for the following:
- accounting and budgeting
- data entry and storage
- data management and analysis
- financial planning and analysis
- performance reporting
- project management
- strategic analysis
Microsoft Excel Spreadsheet is indeed one of the most popular global spreadsheet tools. One of the best things about it is its free use.






















































Why Microsoft Excel Spreadsheet Excels?
First, I quote James Kwak, a global economy, law, and public policy expert. He said: “Microsoft Excel is one of the greatest, most powerful, most important software applications of all time.” And he was right! There are many ways to use Microsoft Excel Spreadsheets, and they excel.
Cost-Efficient
One can get a Microsoft Excel Spreadsheet for only $6.99 per month. Yet, there are several ways you can use Excel for free. First, you can open a Microsoft Office account and access Excel online. Second, you can download Excel on your desktop via the Microsoft Store. It gives you the advantage of using Excel without the Internet or offline. Third, you can use Excel for free on a mobile phone by downloading it on the App Store 9 for iPhone users) or Google Play Store (for Android phone users).
Customizable
Excel is a highly-customizable workbook. Because of its visual basic for applications, Microsoft enabled many formatting tools. It offers around 65,490 unique cell formats and styles. It has 1,024 global fonts and 16 million colors available. To easily remove errors, you can take advantage of 100 undo levels. These features include alignment options, line breaks, merging cells, resizing columns/rows, wrapping text, and much more.
Easy-to-Create Visuals
Excel is one of the best data visualization tools online and offline. Data visualization is the graphical representation of data. Once you enter data in a Microsoft Excel Spreadsheet, you can create charts, diagrams, graphs, maps, SmartArt, tables, and 3D Models out of them. Using these features, Excel will allow you to create a context for your visuals or portray a story. Furthermore, it helps spot patterns, outliers, and trends in a huge data set.
Excel Templates
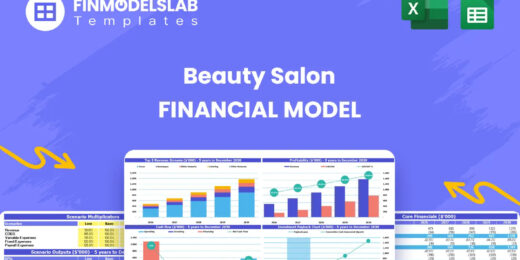
You don’t need to be an expert to use Excel. Many Microsoft Excel Spreadsheet templates are readily available to help you with your daily life. The most common types of Excel templates are:
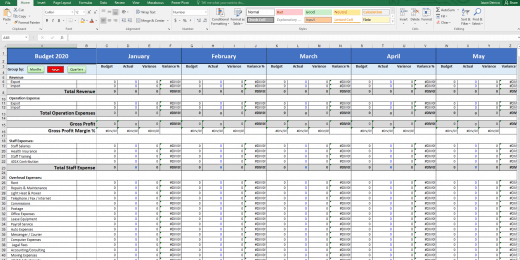
- Budget Template for finance management and tracking expenses.
- Calendar Template for scheduling appointments, deadlines, and events.
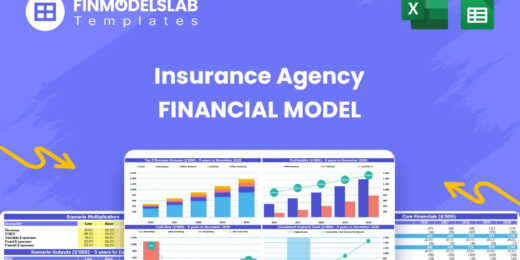
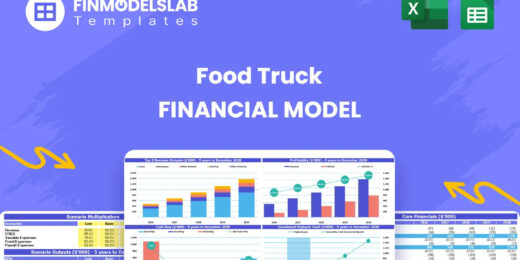
- Financial Modeling Templates include balance sheets, cash flow, and income statements.
- Gannt Chart Template for project management.
- Invoice Template for managing the sale of goods and services
- Sales Tracking Templates to analyze market trends and monitor sales performance.
These pre-designed layouts eliminate the need to create documents from scratch, saving time and effort.
Limitless Business Applications
Microsoft Excel is a powerful tool with a wide range of applications in the business world. Its versatility and functionality make it indispensable for various tasks across different industries. Here are some limitless business applications of Excel:
- Excel can be used for risk modeling and simulation, calculating probabilities, and assessing potential impacts on business decisions.
- Excel helps create business plans, marketing strategies, and sales forecasts. It allows businesses to map out different scenarios and analyze the potential outcomes.
- Excel is commonly used for data management and analysis. It can handle large datasets, perform calculations, create charts and graphs, and summarize data meaningfully.
- Excel is extensively used for financial modeling, budgeting, forecasting, and creating complex financial statements. It is ideal for analyzing cash flows, calculating ROI, and conducting sensitivity analysis.
- Excel is useful for tracking inventory levels, managing reorder points, and monitoring stock movements.
- Excel is widely used in project planning, scheduling, and tracking. Gantt charts and timelines can be easily created to visualize project management progress and deadlines.
- HR departments use Excel for employee data management, payroll processing, and tracking vacation schedules.
Microsoft Excel Spreadsheet is an excellent tool for creating dynamic and interactive dashboards for real-time business insights. These are just a few examples of the countless applications of Microsoft Excel in the business world. Its flexibility and adaptability make it a go-to tool for solving various business challenges and driving data-informed decision-making.


























Alternative Excel Tools
In today’s digital age, spreadsheet software has become an indispensable tool for individuals and businesses. They facilitate data management, analysis, and visualization. While Microsoft Excel has long dominated this realm, the ever-evolving landscape of technology has ushered in a diverse array of alternative Excel tools.
Let’s explore some of the most prominent Excel alternatives, highlighting their unique strengths and applications, empowering users to make informed decisions, and optimizing their data-driven endeavors.
Apache OpenOffice Calc
Apache OpenOffice Calc is a spreadsheet application included in the Apache OpenOffice suite. It is open-source software and part of the Apache OpenOffice productivity suite, which also includes word processing (Writer), presentation (Impress), drawing (Draw), and database management (Base) applications.
Unlike Excel, Apache OpenOffice Calc is compatible with various operating systems, including Windows, macOS, and Linux. But its interface may not be as polished or modern as Excel. Its development and updates might not be as frequent as Excel also.
Apple Numbers
Apple Numbers is a spreadsheet application developed by Apple Inc. It is part of the iWork productivity suite, including Pages (word processing) and Keynote (presentation software). With Numbers, users can perform various tasks typical of spreadsheet applications, such as creating tables, charts, and graphs, organizing data, performing calculations, and presenting information visually. It offers a user-friendly interface and integrates well with other Apple software and devices.
Numbers is known for its sleek and visually appealing interface. It offers a modern look with more intuitive controls than Excel’s traditional appearance. Yet, Apple Numbers is exclusively available for macOS and iOS devices, including Mac computers, iPhones, and iPads. Advantageously, Microsoft Excel Spreadsheet is available on various platforms, including Windows, macOS, iOS, Android, and the web version through Office 365.
Google Sheets
Google Sheets is a cloud-based spreadsheet application developed by Google. It is a part of Google’s productivity suite called Google Workspace (formerly G Suite), which also includes other applications like Google Docs, Google Slides, and Google Drive. Google Sheets allows users to create, edit, and collaborate on spreadsheets online.
Google Sheets offers features similar to traditional spreadsheet software like Microsoft Excel but with the added advantage of being accessible from any device with an internet connection. Users can access Google Sheets through a web browser or mobile app. One of the standout features of Google Sheets is its seamless real-time collaboration. Multiple users can work on the same sheet simultaneously, and changes are instantly visible to all collaborators. Users can leave comments and chat within the document.
Microsoft Excel formulas & functions offer a vast array of advanced features, complex calculations, pivot tables, and powerful data analysis tools, making it a preferred choice for heavy data analysis and financial modeling. Being a desktop application, Excel allows users to work offline without an internet connection as long as the software is installed on the device.
LibreOffice Calc
LibreOffice Calc is a spreadsheet software application and one of the components of the LibreOffice suite. LibreOffice is a free and open-source office productivity suite developed by The Document Foundation and is compatible with other major office suites, such as Microsoft Office.
Both Calc and Microsoft Excel formulas & functions allow data manipulation and analysis. While similar, Excel may have a slight edge regarding the number of advanced features and third-party add-ins available. However, for most users, Calc provides sufficient functionality. The interface of LibreOffice Calc may need to be more intuitive for users than a user-friendly Excel interface.
Open-Source R
R is an open-source statistical computing and data analysis language. Statisticians, data analysts, and researchers widely used R for various data-related tasks, including data manipulation, visualization, modeling, and statistical analysis.
R provides powerful data visualization libraries like ggplot2, which allow users to create sophisticated and customizable plots and visualizations for better data exploration and communication. Excel also offers visualization tools, but they are more suitable for basic charts and graphs than advanced and publication-quality visualizations. Yet R may have a steeper learning curve, especially for individuals without a programming or statistical background. Unlike Excel, which has a relatively lower learning curve and is more widely used in various industries, making it accessible to many users for basic data manipulation and analysis tasks. Open-Source R is a programming language and environment that is open-source, powerful, and versatile and can perform a wide range of data analysis tasks.
Python
Python is a widely used, versatile, and powerful programming language known for its simplicity and readability. Python spreadsheets are libraries or modules in Python that deal with spreadsheet-related tasks. These libraries allow you to work with spreadsheet files to read, write, manipulate, and analyze data in a tabular format.
When handling large datasets or complex calculations, Excel can become slow and less efficient. There might be better choices for big data analysis or complex automation scenarios. With its data manipulation libraries like pandas and NumPy, Python offers more advanced and flexible data analysis and manipulation capabilities. Python can handle large datasets, perform complex data transformations, and integrate with various data sources, making it a preferred choice for data professionals and analysts. Yet, Excel is often considered more approachable for beginners due to its user-friendly interface and visual representation of data. Python might have a steeper learning curve for those new to programming.
Quip
Quip Spreadsheet is a feature within the Quip productivity software developed by Salesforce. Quip Spreadsheets allow users to create, edit, and collaborate on spreadsheets within the Quip platform. The Quip Spreadsheet functionality includes the basic features you would expect from traditional spreadsheet software, such as creating tables, entering data, performing calculations, and formatting cells.
Quip Spreadsheet is designed with real-time collaboration in mind. Multiple team members can simultaneously work on the same spreadsheet, see changes in real time, and have threaded conversations within the context of the document. While Excel also allows for collaboration, it typically involves sharing files via email or cloud storage services, and simultaneous editing is not as seamless as in Quip. Yet, Excel might be more feature-rich than Quip for complex data analysis and advanced scenarios.
Zoho Spreadsheets
Zoho Spreadsheets is a part of Zoho’s suite of cloud-based office productivity tools. It is an online spreadsheet application that allows users to create, edit, and collaborate on spreadsheets over the Internet.
Zoho Spreadsheets offers a comprehensive set of features for data analysis, collaboration, and automation. It provides similar Microsoft Excel formulas & functions, allowing users to perform complex calculations and data manipulations. While Zoho Spreadsheets offers a good range of features, it may have a partial extent of the advanced functionalities that Excel provides. Besides, Zoho Spreadsheets is a cloud-based application accessible through a web browser, which means you can use it on any device with an internet connection.




Summary: Why Use Excel Over Other Tools?
Microsoft Excel Spreadsheet remains a popular choice for many users for several reasons. It has been around for decades and has an extensive user base. Many professionals are already familiar with Excel, making it easier to collaborate and share data with others.
Excel is more than just a spreadsheet tool; it can also serve as a basic database, perform complex calculations, create charts and graphs, and handle simple automation tasks using macros. With its visual basic for applications, Microsoft enables users to create custom macros and automate repetitive tasks, providing a level of automation that may be challenging to achieve in other spreadsheet tools.
However, it’s essential to recognize that other spreadsheet tools have their strengths. Ultimately, the choice of a spreadsheet tool depends on individual needs, familiarity with the software, collaboration requirements, and the complexity of the tasks. Users should consider their specific use cases and explore the features offered by each tool to determine the most suitable option for their requirements.