0 ITEMS

Market Sizing for Remote Entry: TAM, SAM and SOM Guide

A team can size a foreign market from a desk by estimating it twice, top-down from trade and economic statistics and bottom-up from buyer counts and prices, then trusting only the range where both agree. This guide explains each method, the public data that replaces a site visit and the checks that validate the result before money is committed.
Key Takeaways
- Top-down sizing starts from total demand and narrows it, while bottom-up sizing multiplies buyer counts by realistic annual spend per buyer.
- Remote teams should run both methods and investigate any gap beyond a tolerance set in advance, instead of averaging the two results.
- For goods, customs records, statistics offices and trade databases give free remote inputs, and each figure needs a stated country, year and unit.
- Proxy markets supply share and penetration benchmarks when local data is thin, provided the analyst adjusts for income and price levels.
- Capping the obtainable share by sales capacity ties the final number to what the entering company can actually serve.
Top-Down Sizing Starts With the Whole Market and Narrows It
Top-down sizing begins with a large published total and filters it to the part a company can sell to. The Cambridge Institute for Manufacturing explains that in a top-down approach the target population is reached by narrowing down larger populations. It uses three nested measures.
Total addressable market (TAM) is the full annual demand for a product category in one country. Serviceable addressable market (SAM) is the slice of that demand which matches the company’s product, price tier and channels, or in Boston University’s wording, who a team could realistically serve with the resources and approach it is likely to have. Serviceable obtainable market (SOM) is the share of SAM the company can win in a set period.
For goods, TAM is often built as apparent consumption: domestic production plus imports minus exports. The analyst then multiplies by the share of demand that fits the target segment to reach SAM. The route is fast but inherits the category definitions of its source, so a broad product code can overstate the segment. This guide covers goods, while services need a different top-down base, such as sector turnover from national accounts.
Bottom-Up Sizing Builds the Market From Buyers and Prices
Bottom-up sizing counts the buyers and multiplies by what each one spends. The analyst takes the number of target businesses from a business register, applies a fit rate for those that match the buyer profile, and multiplies by annual spend per buyer, taken from the company’s price list and typical purchase volumes. The fit rate and the segment share are judgement inputs, so the analyst sets them from proxy-market ratios or distributor interviews and then stresses them.
This route exposes the assumptions that matter but takes more effort, because every input needs its own source. For a small and medium-sized enterprise (SME), a business below a size threshold that varies by country, the effort usually pays off, since investors and lenders ask where each number came from. Once SAM is set, the forecast can rest on revenue projections models, and early-stage teams can start from startup financial models.
A Remote Entry Needs Both Methods Side by Side
Top-down figures can include unreachable demand, while bottom-up figures can miss buyers a register omits.
| Factor | Top-down | Bottom-up |
|---|---|---|
| Starting point | Published market or trade total | Count of target buyers |
| Main input | Production, import and export values | Buyer numbers, fit rate, spend per buyer |
| Typical weakness | Category definitions too broad | Register gaps and optimistic spend |
| Effort | Low | Moderate to high |
| Best use | First screening of many countries | Final sizing of a short list |
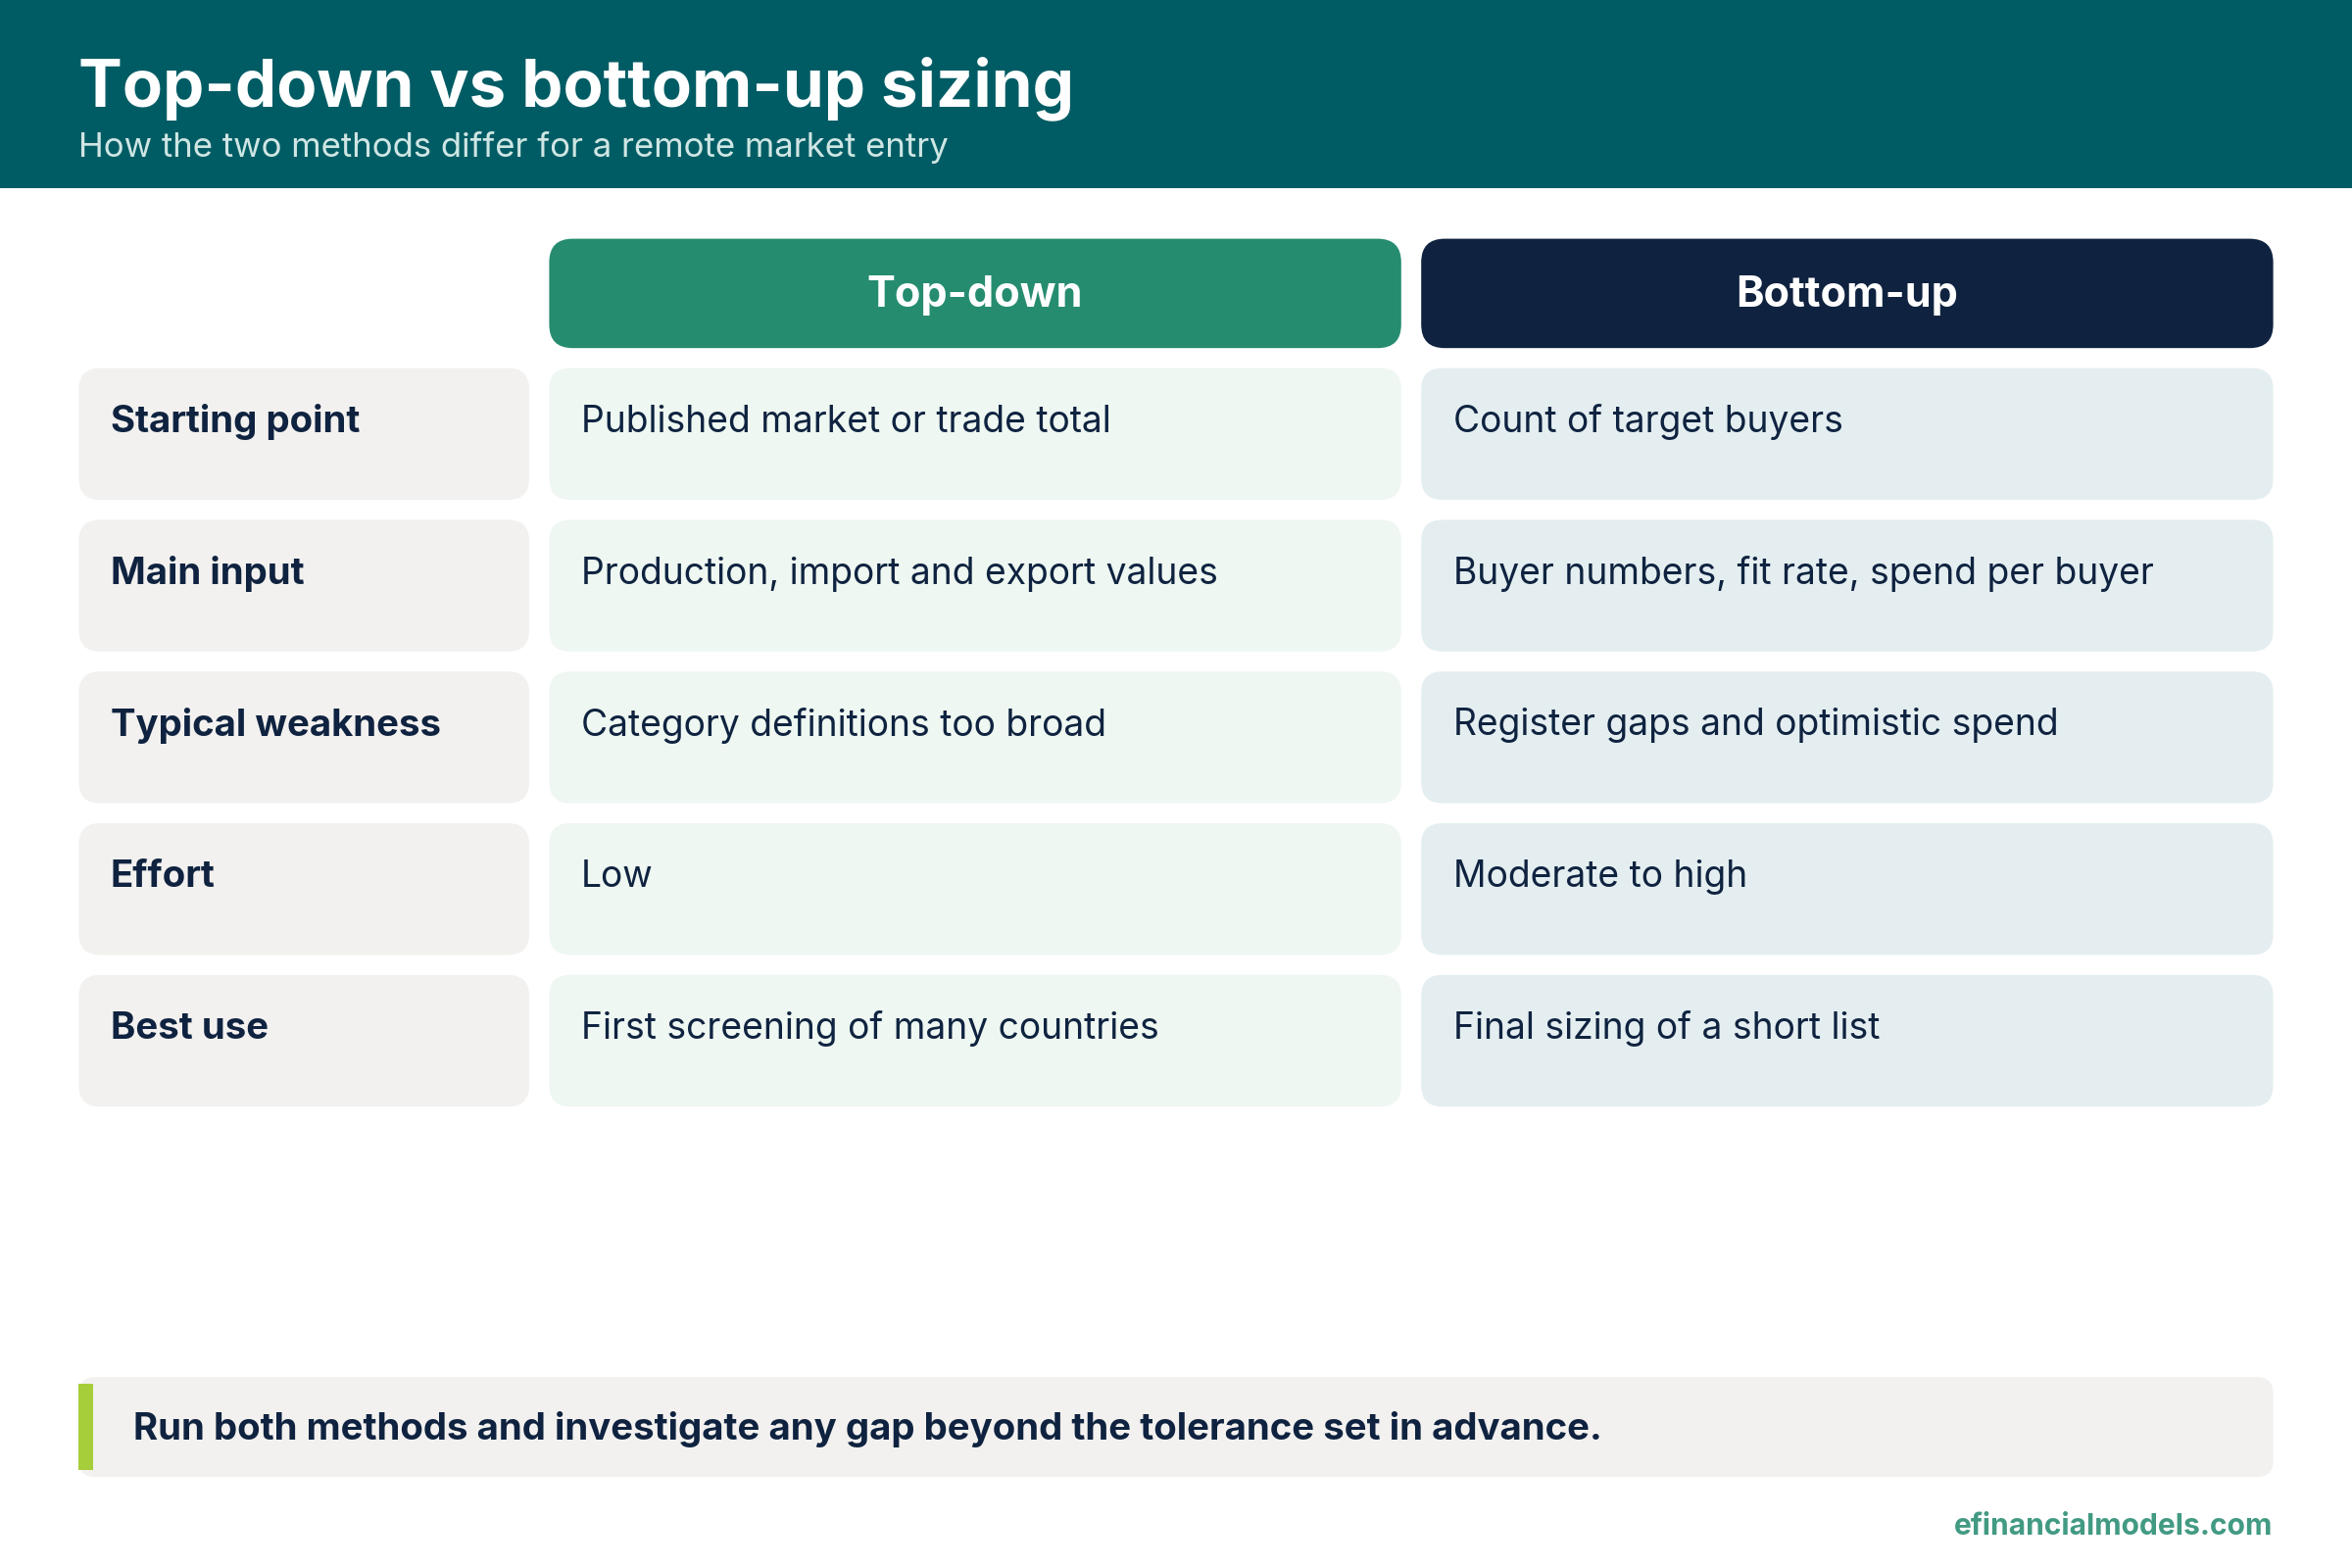
Comparison infographic that restates the table above for quick scanning.
Remote Data Sourcing Replaces the Site Visit
Government statistics and trade reports cover most remote sizing work, and proxy markets fill the gaps.
Government statistics supply the buyer counts for the bottom-up route. Eurostat reported that micro and small enterprises were 99% of EU business-economy enterprises in 2023, so register counts depend on the size classes they include.
Official surveys can also anchor a fit rate. Eurostat reports that the share of enterprises that had e-sales increased from 18.93% in 2014 to 23.59% in 2024 across the EU, which shows why any adoption ratio needs a stated year.
Trade reports supply the top-down totals. Customs authorities record trade by product code under the Harmonized System (HS), the international product nomenclature, and the World Customs Organization (WCO) states that over 98% of merchandise in international trade is classified under it, although the page gives no year. Eurostat’s Comext database is the reference source for detailed statistics on international trade in goods in the EU. The UN Comtrade database covers other countries, although a World Bank review noted that data for 146 countries was available as of March 2024 for 2022 annual merchandise trade, against 177 in 2017, so an analyst should confirm that the target country reports.
The World Bank’s World Development Indicators database holds 1,400 time series indicators for 217 economies, which the page does not date and which supports adjustments for income and population.
Proxy Markets Fill the Gaps Where Local Data Is Thin
A proxy market is a comparable country that already publishes the figure the target country lacks. The analyst borrows a ratio, such as buyers per thousand businesses or revenue per head of population, and adjusts it for income and prices.
Every borrowed ratio should carry a label that names the proxy country, the year and the adjustment applied, so a reviewer can challenge it. As an illustration, if the proxy country’s income per head is 25% above the target’s, an analyst might scale a $100 spend benchmark down by the same ratio to $80.
Validation Turns an Estimate Into a Decision Input
Validation tests whether the number deserves trust. Four checks cover most cases:
- Triangulate: put both SAMs on the same price basis, such as buyer prices including distributor margins and duties, then compare them against a tolerance set before looking at the result. An analyst can assume a band such as 25% of the higher figure and investigate any gap beyond it.
- Grade inputs by source: official statistics rank above trade-press estimates, and estimates rank above a single anecdote.
- Cap SOM by capacity: divide obtainable revenue by spend per buyer and check that the channels can serve that many customers.
- Stress the weakest input: change the fit rate or spend per buyer and see how far SAM moves.
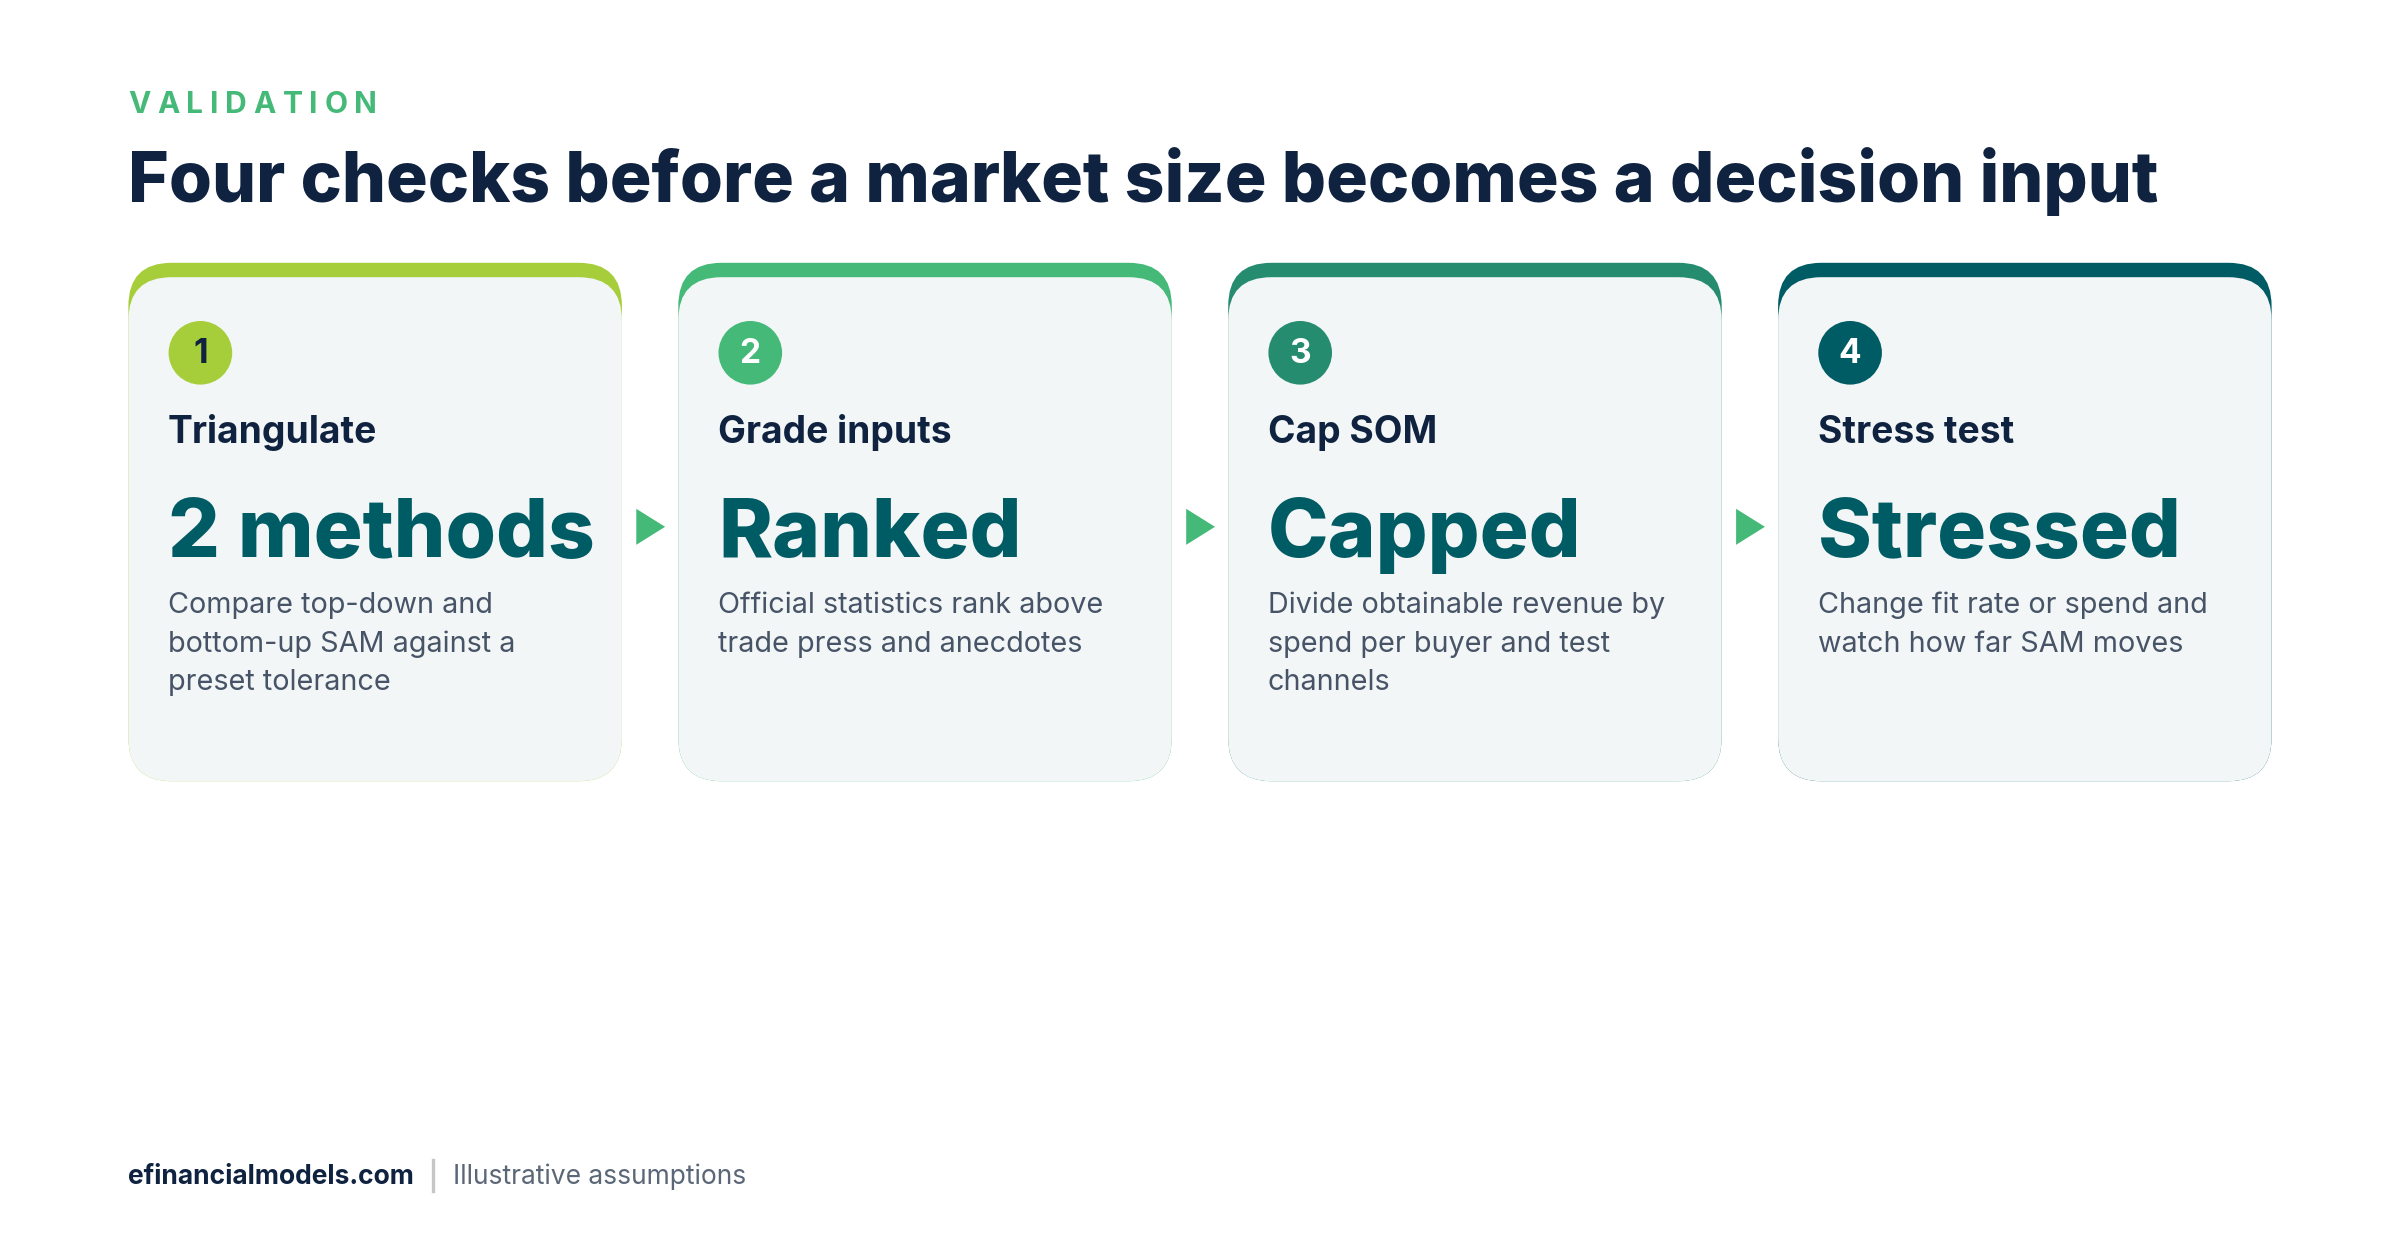
Process infographic summarising the four validation checks above.
Illustrative Scenario: Sizing Country X From a Desk
This scenario is hypothetical and uses assumed inputs, not data from a real market. A European equipment maker wants to enter Country X through distributors without visiting first.
Assume the top-down inputs come from national statistics and customs data for the relevant product code, and that both methods already use buyer prices:
| Top-down input | Assumed value |
|---|---|
| Domestic production | $250 million |
| Imports | $400 million |
| Exports | $150 million |
| Share of demand in the company’s segment and price tier | 24% |
The top-down calculation follows from those inputs:
- TAM = $250 million + $400 million − $150 million = $500 million.
- SAM = $500 million × 24% = $120 million.
Assume the bottom-up inputs come from the business register and the company’s price list: 40,000 target businesses, a 50% fit rate and annual spend of $5,400 per fitting buyer.
- Fitting buyers = 40,000 × 50% = 20,000.
- SAM = 20,000 × $5,400 = $108 million.
The gap is $120 million − $108 million = $12 million, which equals 10% of the higher figure. That sits inside the assumed 25% tolerance, so the team plans on the lower figure of $108 million.
For SOM, assume a comparable entrant in proxy Country Y reached a 1.5% share of SAM in its third year, using 2025 data already adjusted for income and price levels. Then SOM = $108 million × 1.5% = $1.62 million. Treating SOM as gross buyer spend and assuming no customer churn, divided by $5,400 per buyer, it requires 300 customers. With four distributors, each must win 75 customers in three years, or 25 a year. Assuming each distributor can serve at most 30 new customers a year, that pace passes the capacity check.
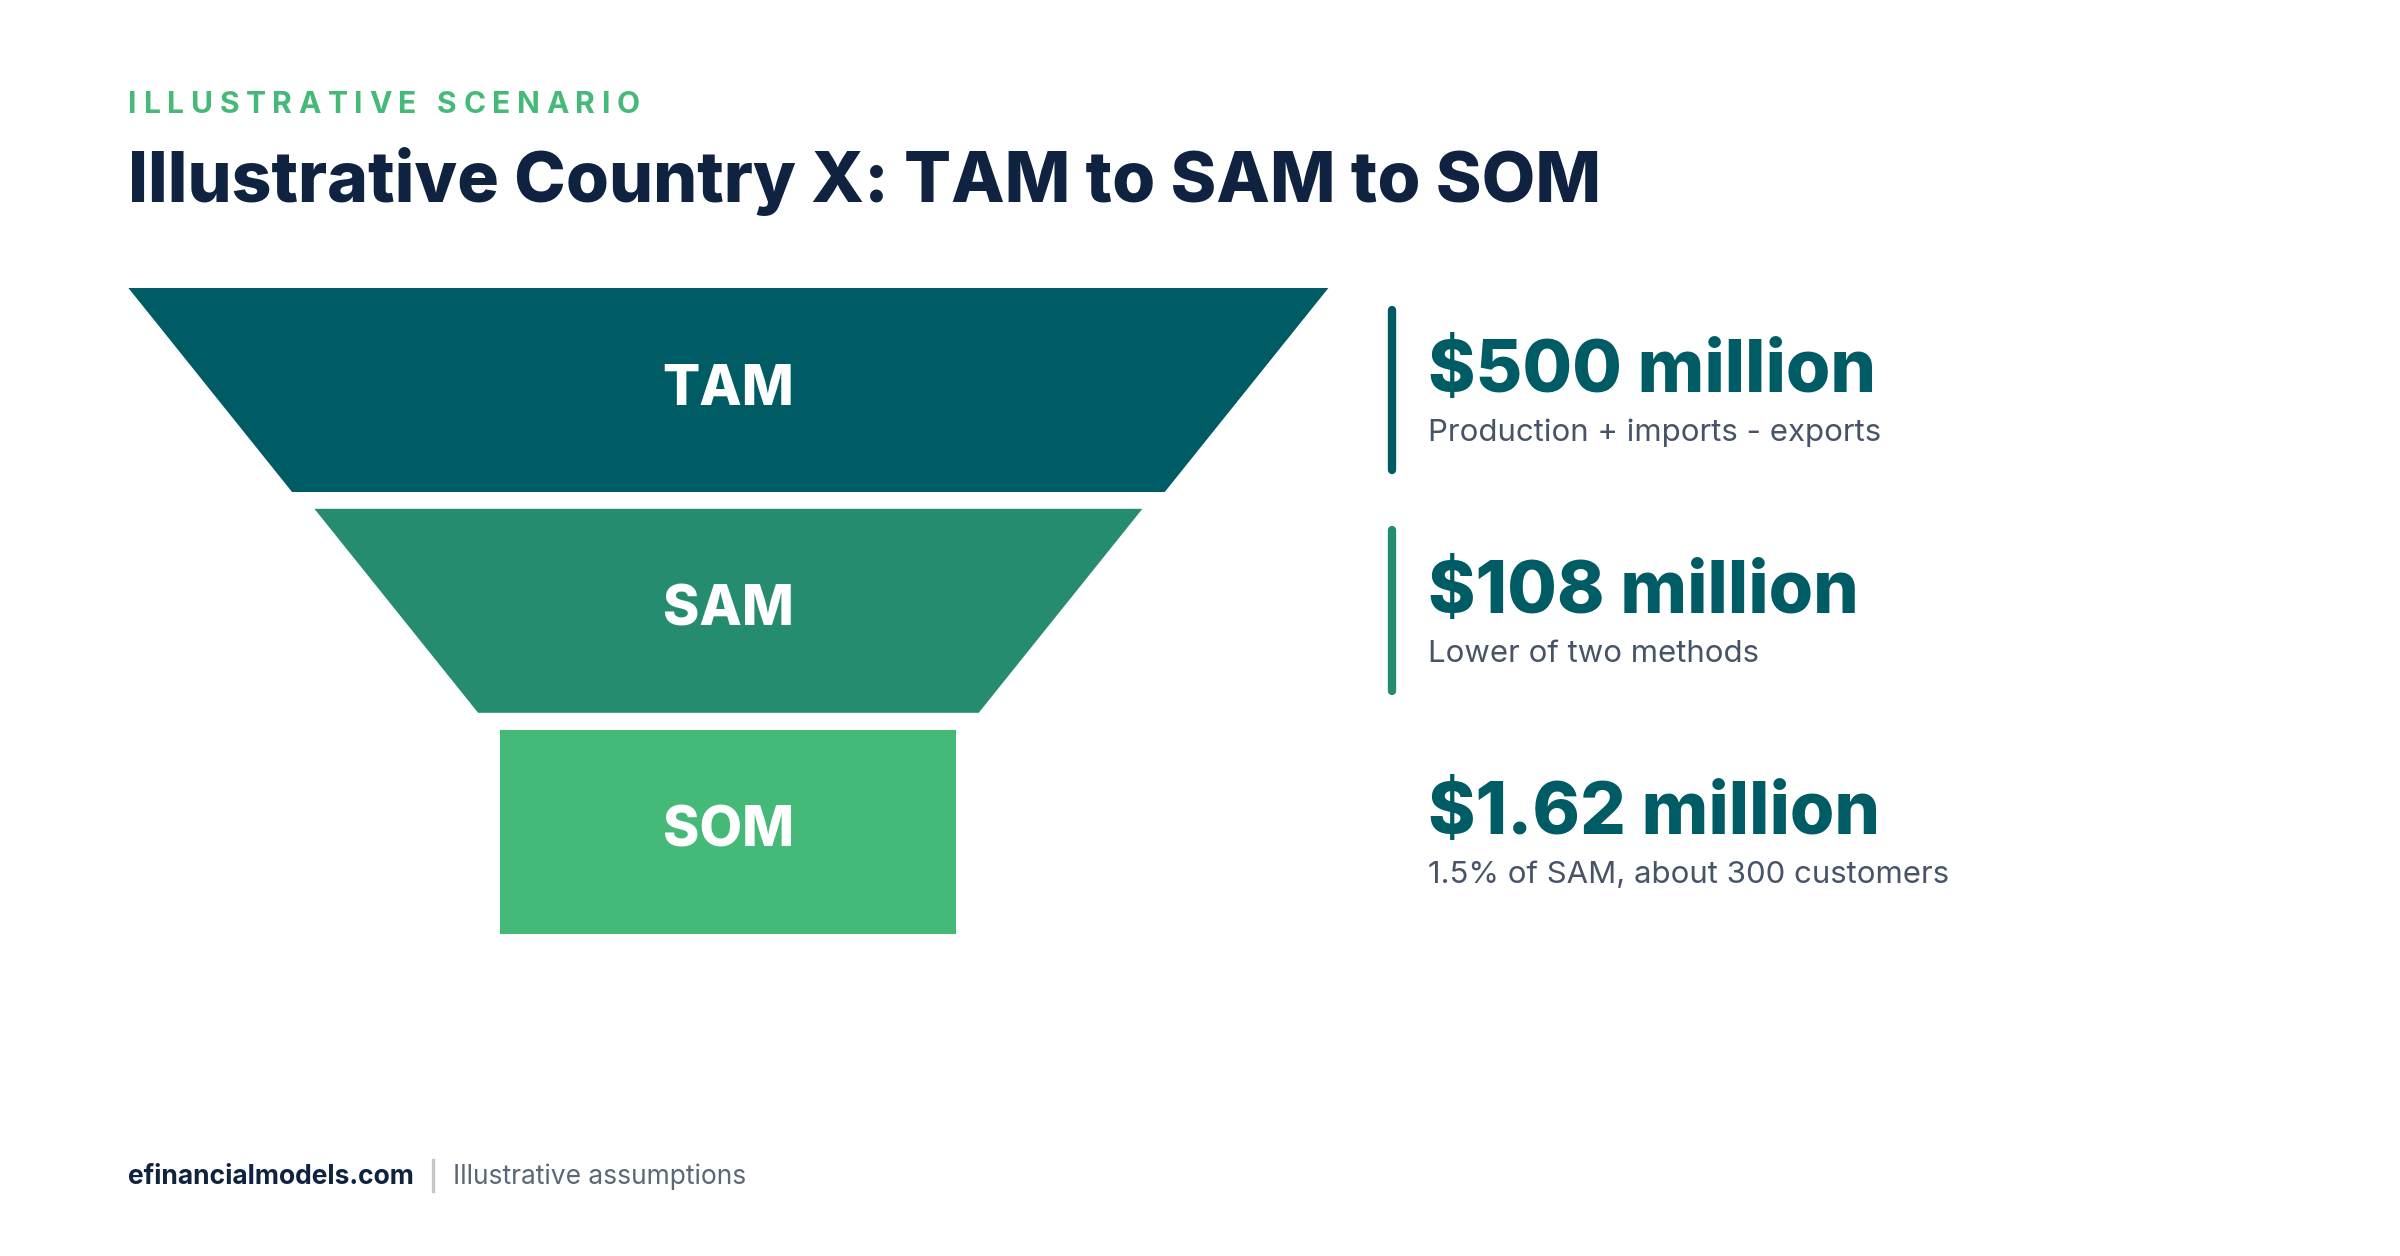
Funnel chart drawn from the scenario’s own assumed inputs and results.
Conclusion
Remote market sizing works when two methods agree, every input carries a source and a year, and the obtainable share is checked against sales capacity. Teams that want a custom sizing model can use the Expert Financial Modeling Services from eFinancialModels to refine an existing model or develop a new one from scratch.
Frequently Asked Questions
How long does remote market sizing take for an SME?
As an editorial estimate, a first screening of several countries can fit into a few working days, because the top-down inputs come from public databases and need no fieldwork. A short-listed country takes longer, since the buyer count needs register extracts and price checks. Broad product codes or mismatched business classes add days, so teams should reserve time for the validation checks before presenting a figure to a lender.
How accurate must a TAM estimate be for investors?
Investors treat TAM as a plausibility test, not a precise forecast. What they probe is traceability: every input needs a source, a year and a unit, and a reviewer should be able to rebuild SAM and SOM from the stated assumptions. A range with a documented method beats a single large number, and a huge TAM with an undeliverable obtainable share weakens the case.
What if the target country publishes no reliable statistics?
Start with mirror data, meaning the export records of partner countries that ship to the target. Add proxy ratios from a comparable market and validate with video interviews of distributors and importers. Label these inputs as lower grade, widen the tolerance, for example by assuming a 40% band in place of 25%, and plan a staged entry, so that early sales results replace the weakest assumptions before large commitments are made.
Should the market be sized in revenue or in units?
Units suit the bottom-up route and expose capacity limits such as how many customers a distributor can serve. Revenue suits the top-down route, because trade statistics report values in currency. Convert between the two with a stated price and a stated exchange rate and year, so that the methods stay comparable. Units also help when prices differ by region, because one average price can hide that spread.
How often should the estimate be refreshed after entry?
Refresh it with each new annual release, after tariff or exchange-rate changes, and at least yearly. After entry, replace assumptions with actual sales data, starting with the fit rate and spend per buyer, and treat a persistent shortfall against the SOM path as a prompt to revisit the channel plan. Record the new source year and the inputs that changed, so reviewers can follow the update.