
0 ITEMS

Why Should You Use Excel for Financial Modeling?

Financial modeling in Excel is essential for analyzing financial data, forecasting, and making strategic decisions.
- Excel provides powerful functions and formulas to handle complex calculations and large datasets efficiently.
- Common models include budgeting, discounted cash flow, financial ratio analysis, and scenario planning.
- Tools like VLOOKUP, INDEX/MATCH, and pivot tables help organize data and perform detailed analysis.
- Visualizations with charts and dashboards improve understanding of trends and key performance indicators.
- While it has limitations, Excel remains the most accessible and versatile tool for financial modeling across industries.
Excel offers various functions, formulas, and features that allow finance professionals to analyze complex datasets, create dynamic models, and present findings clearly and concisely. Whether you’re a business owner seeking to gain a deeper understanding of your financial performance or a finance professional looking to enhance your skills, this blog post will guide you through Excel’s key features and why you should use it for financial modeling.
Overview of Financial Modeling in Excel
Financial modeling in Excel means building and creating mathematical representations or models of financial situations or scenarios. It involves using Microsoft Excel’s functions, formulas, and features to analyze and forecast financial data, make projections, and evaluate the potential outcomes of various financial decisions.
Microsoft Excel’s power and versatility make it an indispensable financial modeling, financial planning, and analysis tool. Its ability to handle large datasets, extensive library of functions, data visualization capabilities, and customization options make it the preferred choice for professionals seeking to make informed financial decisions. Whether you are a financial analyst, investment banker, or business owner, Excel is a tool that can greatly enhance your ability to analyze and model financial data effectively.
Common Examples of Financial Models in Excel
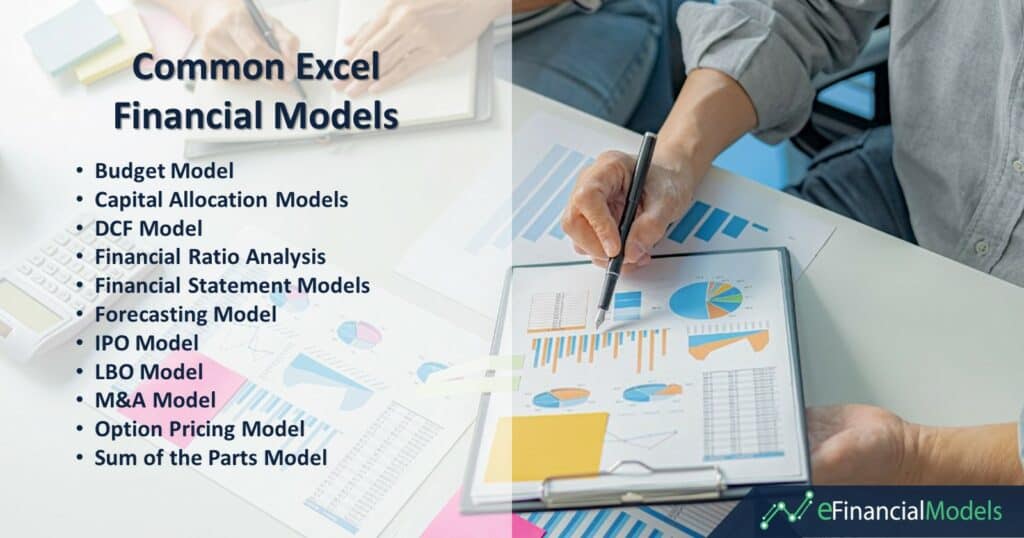
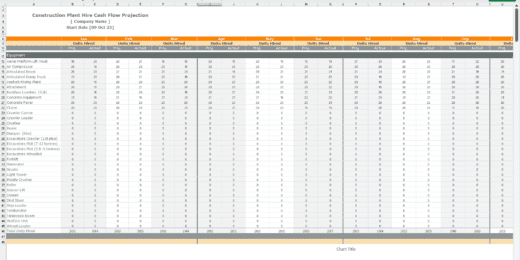
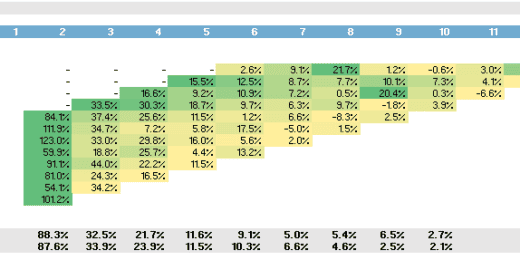
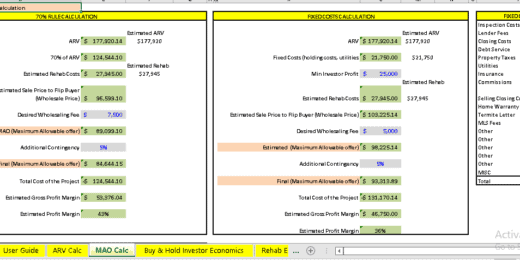
Financial models in Excel are widely used for various purposes in finance and investment analysis. Here are some common examples of financial models in Excel:
- Budget Model: This model helps plan and track a company’s budget by estimating revenues, expenses, and cash flows for a specific period.
- Capital Allocation Models: These analyze investment projects and make capital budgeting decisions. These models incorporate initial investment, expected cash flows, and discount rates to evaluate the project’s feasibility and profitability.
- Discounted Cash Flow (DCF) Model: Excel is used to build valuation models, such as discounted cash flow (DCF) models, which estimate a company’s intrinsic value or investment based on projected future cash flows.
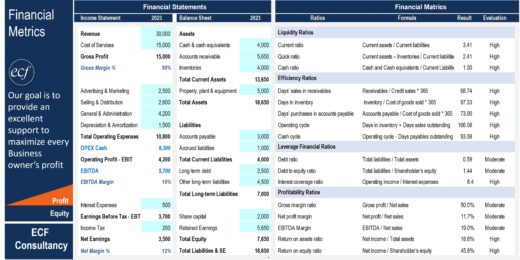
- Financial Ratio Analysis: Excel is commonly used to calculate and analyze various financial ratios, such as profitability ratios, liquidity ratios, and leverage ratios, which provide insights into a company’s financial health and performance.
- Financial Statement Models: These models create projected financial statements, including income statements, balance sheets, and cash flow statements. An integrated financial modeling Excel template of the three is called the three-statement financial model. They all provide insights into the financial performance and position of a company.
- Forecasting Model: It uses historical data and statistical techniques to predict future financial performance, such as sales, expenses, and cash flows.
- Initial Public Offering (IPO) Model: It helps determine the fair value of a company’s shares during an initial public offering by considering financial projections, market conditions, and comparable companies.
- Leveraged Buyout (LBO) Model: It assesses the financial feasibility and potential returns of acquiring a company using significant debt financing.
- Mergers & Acquisitions Model (M&A): This model analyzes the financial implications of a merger or acquisition, including the impact on financial statements and valuations.
- Option Pricing Model: These models, such as the Black-Scholes model, estimate the value of financial options based on factors such as underlying asset price, volatility, time to expiration, and interest rates.
- Sum of the Parts Model: This model evaluates a company’s various business segments or divisions separately to determine their individual values and assess the company’s overall worth.
These are just a few examples, and many other financial models can be created in Excel depending on specific analysis or valuation needs.
















































Essential Functions and Formulas of Excel for Financial Modeling
Financial modeling in Excel offers flexibility, customization, and a wide range of built-in functions and tools. It allows users to organize and manipulate financial data efficiently, perform complex calculations, create charts and graphs for visualization, and present the results clearly and understandably.
Regarding financial modeling and analysis, Excel is an indispensable tool that professionals rely on. With its powerful functions and formulas, Excel allows you to perform complex calculations and create dynamic models that can provide valuable insights for decision-making. Here are several essential Excel functions and formulas that are commonly used in financial modeling.
SUM & COUNT
Excel’s SUM and COUNT functions are commonly used in financial modeling for various calculations and analyses.
The SUM function adds up a range of cells and returns the sum. Financial modeling in Excel commonly uses the SUM function to:
- Add all the revenue values in a range, such as sales or other income streams.
- Calculate the total expenses incurred by adding different expense categories, such as salaries, rent, utilities, etc.
The COUNT function in Excel counts the number of cells in a range that contain numeric values. Financial modeling in Excel commonly uses the COUNT function to:
- Count the number of occurrences of a specific event or transaction
- Counting the number of missing values or errors in a dataset
- Identify the total number of customers or accounts
- In some examples of financial models in Excel, you may need to calculate statistical measures such as averages or percentages. The COUNT function is often combined with other functions to determine the denominator for such calculations.
IF & AND
The IF and AND functions in a financial modeling Excel template are essential for performing logical tests and making decisions based on multiple conditions.
The IF function is frequently used to create conditional statements in financial models. You can use it to evaluate a condition and return different values based on the result. For example, you can use an IF statement to calculate interest expense based on different interest rates or to determine whether a company meets certain financial criteria. You can also combine the IF function with other mathematical functions to create scenarios and analyze the results. As such, you can model potential outcomes and determine the likelihood of specific events by setting up IF statements.
The AND function is useful when you need to evaluate multiple conditions simultaneously. It allows you to combine several logical tests and return a TRUE or FALSE result based on whether all the conditions are met. It can assess complex scenarios in a financial model Excel template. For example, you can use an AND statement to check if both revenue and profit targets are achieved before triggering certain actions or calculations.
NPV & IRR
Excel’s NPV (Net Present Value) and IRR (Internal Rate of Return) functions are widely used in financial modeling to analyze and evaluate investment projects, capital budgeting decisions, and financial feasibility studies.
The NPV function calculates the present value of cash flows generated by an investment project or business venture. It considers the time value of money by discounting future cash flows back to their present value using a specified discount rate. By comparing the NPV of different projects or investments, analysts can prioritize projects based on their potential to add value to the business.
The IRR function calculates the discount rate at which the NPV of cash flows becomes zero, thereby determining the rate of return on an investment project. It helps identify the rate at which inflows’ present value equals outflows’ present value. By comparing the IRR of different projects, analysts can determine the relative attractiveness of investments and make informed decisions. It helps establish the minimum acceptable rate of return for investment projects, enabling companies to set realistic targets and benchmarks.
AVERAGE, STDEV, & CORREL
Excel’s AVERAGE, STDEV, and CORREL functions are commonly used to analyze and evaluate data in a financial model Excel template. They provide statistical measures for evaluating financial performance, identifying trends, and conducting scenario analysis.
The AVERAGE function calculates the arithmetic mean of a range of numbers. It is used to find the average value of a financial data set, such as historical prices, returns, or cash flows. For example, you can use the AVERAGE function to calculate the average annual sales growth rate or the average monthly returns of a stock.
The STDEV function calculates the standard deviation of a range of numbers, which measures the dispersion or volatility of the data set. It is commonly used in financial modeling to assess risk and uncertainty. For instance, the STDEV function can calculate the standard deviation of historical returns, prices, or other financial metrics. It helps in estimating the volatility of an investment or portfolio and in determining risk measures like Value at Risk (VaR).
The CORREL function calculates the correlation coefficient between two ranges of numbers. It measures the degree of linear association between two variables and indicates the strength and direction of their relationship. The CORREL function in a financial modeling Excel template analyzes the relationship between various financial variables. For example, you can use it to determine the correlation between stock returns and market index returns or between different sectors in an industry. This information can help diversify a portfolio and understand the interdependencies among variables.
VLOOKUP & INDEX/MATCH
The VLOOKUP and INDEX/MATCH functions are commonly used in a financial model Excel template to retrieve data from different spreadsheet parts based on specified criteria.
The VLOOKUP function searches for a value in the leftmost column of a table and returns a corresponding value from a specified column. You can use VLOOKUP to pull financial data, such as historical prices, from a separate table based on a specific date or identifier. It can also fetch or map data from other sheets or tables.
The INDEX and MATCH functions are often used as an alternative to VLOOKUP. They allow for more flexible lookups and handle data arranged in any column. It provides more flexibility than VLOOKUP, allowing you to look up data based on multiple criteria or across columns.
Scenario Manager & Goal Seek Function
The Scenario Manager and Goal Seek functions in Excel are valuable tools in financial modeling that help analyze and assess the impact of various scenarios and determine the inputs required to achieve a specific goal.
Scenario Manager allows you to create and compare multiple scenarios by changing a set of input values. It is particularly useful for sensitivity analysis, where you want to understand how changes in certain variables affect the outcome of your financial model Excel template. Its key uses are what-if analysis and risk assessment.
Goal Seek allows you to determine the input value required to achieve a specific desired outcome. It is particularly useful for determining input variables or assumptions necessary to reach a target value or objective. Its key uses include breakeven analysis and reverse engineering.
Data Formatting
The data formatting Excel function is an essential tool in financial modeling as it allows you to manipulate and present financial data in a structured and readable format.
Excel offers a range of text formatting functions that can be valuable in financial modeling. You can use functions like “UPPER,” “LOWER,” or “PROPER” to convert text to uppercase, lowercase, or capitalize the first letter of each word. These functions are useful for standardizing text inputs or improving the presentation of financial statements and reports.
Examples of Financial modeling often involve large numbers with many decimal places. The number formatting functions, such as “Currency,” “Accounting,” or “Comma,” help you display these numbers in a more readable format. They add appropriate currency symbols, decimal separators, and thousand separators to improve clarity.
Financial modeling in Excel frequently incorporates dates and timestamps. Excel provides various date and time formatting functions, allowing you to display them in different formats, such as “mm/dd/yyyy,” “dd-mmm-yyyy,” or “hh: mm AM/PM.” It helps ensure consistency and enhances the comprehensibility of your model.
Conditional formatting functions enable you to highlight specific data points based on predefined criteria. It can be useful for visually identifying exceptional values, such as highlighting negative values in red or highlighting cells that meet certain threshold conditions. They help draw attention to critical information and facilitate decision-making.
Charts, Graphs, & Pivot Tables
Excel charts, graphs, and pivot tables help visually analyze and present financial data, allowing for better understanding and decision-making.
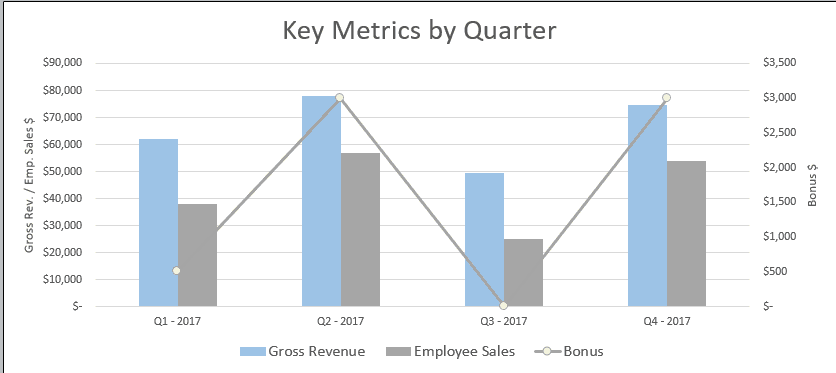
Charts and graphs help visualize financial data, making identifying trends, patterns, and relationships easier. Common Excel types of charts used in financial modeling include line, bar, column, and pie charts. They facilitate the comparison of financial data across different companies, investment options, or time periods.
Pivot tables allow you to summarize and analyze large datasets by manipulating and filtering data based on different scenarios. You can create pivot tables to calculate financial ratios, perform profitability analysis, or compare budgeted vs. actual figures. Data tables and pivot tables aid in sensitivity analysis to evaluate the impact of different variables on financial models. For example, you can create a data table to analyze how changes in interest rates or input assumptions affect a project’s net present value (NPV).
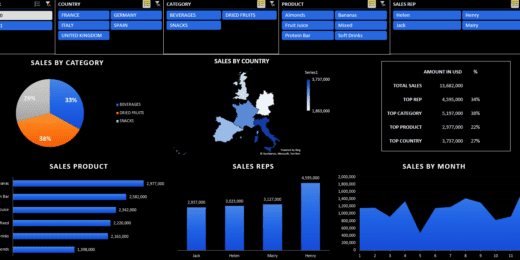
Excel dashboards combine multiple charts, graphs, and pivot tables into a single interface, providing a comprehensive view of financial metrics. They are useful for monitoring key performance indicators (KPIs) and tracking a company’s financial health.













































Benefits of Financial Modeling in Excel
Using Excel for financial modeling offers numerous benefits to businesses and individuals alike. Here are some key advantages:
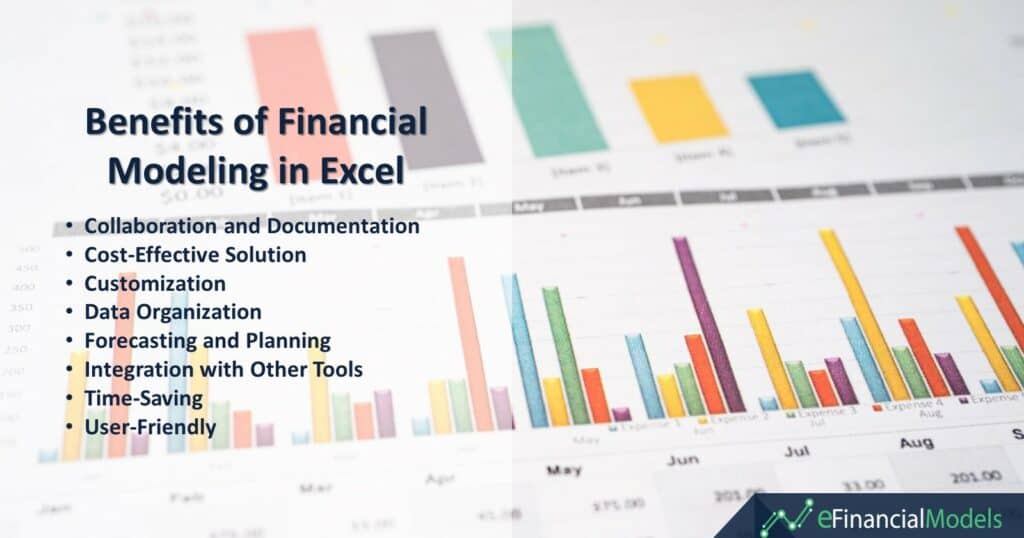
- Collaboration and Documentation: Excel facilitates collaboration among team members involved in financial modeling. Multiple individuals can work on the same model simultaneously, and changes can be tracked and reviewed. Additionally, you can document assumptions, methodologies, and formulas, ensuring transparency and facilitating future updates.
- Cost-Effective Solution: Excel is readily available and relatively inexpensive compared to specialized financial modeling software. It offers a cost-effective solution for businesses and individuals looking to perform financial modeling and analysis without significant investment in additional software.
- Customization: Excel provides a flexible platform for financial modeling. You can customize formulas, equations, and layouts to match your needs. This adaptability allows you to build models tailored to your industry, company size, or unique circumstances.
- Data Organization: Excel offers powerful data organization and analysis capabilities. You can import and manipulate large datasets, perform calculations, sort and filter data, and create meaningful visualizations. These features enable you to gain insights and make data-driven decisions.
- Forecasting and Planning: Excel provides a wide range of built-in functions and formulas that can be used to perform complex calculations and create accurate financial forecasts. It allows you to build comprehensive financial models considering various factors. By utilizing Excel’s analytical capabilities, you can make informed financial projections and assess the potential outcomes of different scenarios.
- Integration with Other Tools: Excel can integrate with other software applications and databases. You can import data from external sources, connect to accounting systems, link models to PowerPoint presentations, and export reports or analyses to other formats.
- Time-Saving: Excel offers various features that help save time and enhance productivity. You can automate repetitive tasks using macros and formulas, reducing manual errors and increasing efficiency. Additionally, Excel allows you to import data from external sources, such as databases and other software applications, saving time on data entry and ensuring data accuracy.
- User-Friendly: Excel has a user-friendly interface and a familiar spreadsheet format that many professionals are already accustomed to. It offers many pre-built templates and functions that simplify financial modeling tasks. Even for individuals with basic spreadsheet skills, Excel provides intuitive features for organizing data, creating formulas, and generating charts and graphs.
Overall, financial modeling in Excel provides a versatile and powerful toolset for analyzing, planning, and decision-making in various financial contexts. Its wide adoption, flexibility, and familiarity make it a popular choice for financial professionals across industries.
Limitations of Financial Modeling in Excel
Even if it is a powerful tool, financial modeling in Excel has some limitations in certain areas. Here are the most common:
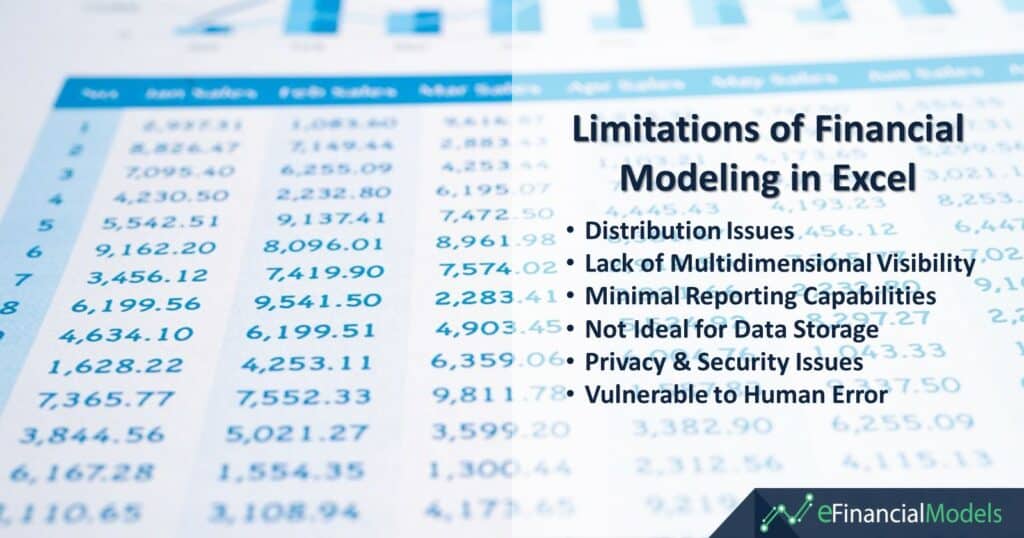
- Distribution Issues: Excel files can be challenging to distribute and share, especially when dealing with large files or complex models. Version control and collaboration can become cumbersome when multiple users are involved, leading to potential errors or inconsistencies.
- Lack of Multidimensional Visibility: Excel is primarily a two-dimensional tool, so it may not provide the best visibility or flexibility for modeling complex financial scenarios involving multiple dimensions or variables. Analyzing and interpreting data across various dimensions can be difficult and time-consuming.
- Minimal Reporting Capabilities: While Excel allows you to create basic reports and charts, it may not offer the extensive reporting capabilities and customization options that specialized reporting tools or business intelligence software provide. Generating advanced financial reports or visualizations can be limited in Excel.
- Not Ideal for Data Storage: Excel is not designed to be a robust database or storage solution. Storing large amounts of data in Excel files can lead to performance issues, such as slow calculations, increased file size, and potential data corruption. Excel is better suited for calculations and analysis rather than long-term data storage.
- Privacy & Security Issues: Excel files can be susceptible to privacy and security risks, especially if they contain sensitive financial information. Excel’s password protection and file encryption features may need to provide more security measures compared to dedicated financial software or database systems.
- Vulnerable to Human Error: Excel models heavily rely on manual data entry, formula creation, and cell referencing. This manual process increases the risk of human errors, such as incorrect formulas, misplaced data, or accidental deletions. These errors can have significant consequences on financial models and analysis.
To overcome some of these limitations, organizations often complement Excel with specialized financial modeling software or databases that offer advanced features, improved collaboration capabilities, and enhanced security measures. These tools are specifically designed to address complex financial modeling and analysis requirements.
Summary
While specialized financial modeling software is available, Excel is still the preferred choice for financial modeling tasks across industries. It provides a flexible platform for creating complex financial models with various calculations, data manipulation, and scenario analysis.
Excel is widely accessible and commonly used across industries and organizations. It is available on most computers and is compatible with different operating systems. It has been around for decades and is extensively used by professionals in finance and accounting. As a result, many individuals are already familiar with its interface and features, reducing the learning curve for financial modeling tasks.
Many organizations already have licenses for Excel, reducing the need for additional software investments. Additionally, its widespread use results in a vast community of users, making it easier to find resources, tutorials, and support online.
































You might also like:
- 10 Tips to Develop a First Class Business Valuation Report
- 10-Step Financial Planning Checklist for Smart Executives
- 5 Smart Ways To Manage Personal Finances In A Pandemic
- 7 Key Tips: How to Best Work With a Financial Model Template
- Achieve Financial Success By Knowing Your Business Plan Model
- Financial Modeling using Excel
- Financial Modeling with Excel: Fundraising Plan Tactics
- 10 Main Elements of a Business Plan
- Financial Forecasting Models by eFinancialModels
- Understanding the Debt Service Coverage Ratio: An Essential Metric for Financial Analysis
- Improving Days Payable Outstanding for Better Cash Flow
- Commercial Real Estate Valuation Methods: Helping Investors in Taking Informed Decisions
- Understanding What is Yield to Maturity and Why It Matters
- Investing Cash Flows
- Project Finance
- Financial Planning for Small Business Owners – Taking an SBA Loan
- How to Build a Thriving Taxi Company?
- SaaS Business Financial Model
- Accounting
- How to Calculate Net Present Value (NPV)?