
0 ITEMS

Mastering Mobile App Success: A Comprehensive Financial Model for Sustainable Growth and Profitability

This article is written by AUT Financial Modeling
A mobile app financial model serves as an essential tool for entrepreneurs, developers, and financial analysts who seek to understand and project the financial performance of a mobile application. By incorporating detailed forecasts of revenues, costs, and profitability, a financial model allows stakeholders to make informed business decisions about their app’s future.
The mobile app industry is highly competitive, and understanding its financial intricacies is crucial for growth and sustainability. Whether you’re launching a new app or scaling an existing one, a robust financial model helps you track key performance indicators (KPIs), monitor cash flow, and analyze profitability over time. From calculating customer acquisition costs to understanding monetization strategies, a mobile app financial model gives you a clear picture of what it will take to make your app profitable.
Why a Mobile App Financial Model is Essential
- Investment Readiness: A financial model is indispensable when seeking funding from investors. It demonstrates a deep understanding of the app’s business mechanics, showcasing potential revenues, growth rates, and profitability.
- Strategic Planning: The model helps in forecasting the necessary investments in marketing, development, and other operational expenses. Strategic decisions, such as when to scale the marketing efforts or hire additional staff, can be optimized with financial modeling.
- Performance Monitoring: By incorporating KPIs such as Monthly Active Users (MAUs), Cost per Install (CPI), and Monthly Recurring Revenue (MRR), this financial model can serve as a dashboard for monitoring business health.
- Scenario Analysis: A financial model allows for various scenarios, such as pessimistic, baseline, and optimistic cases, so stakeholders can visualize different growth trajectories and corresponding cash flow patterns.
A well-constructed financial model goes beyond simple budgeting or forecasting. It provides the structure needed to project app performance, integrate assumptions related to user acquisition, and account for multiple revenue streams like in-app purchases and subscriptions. The end result is a powerful tool for managing growth and profitability while mitigating risks.
Features of the Mobile App Financial Model Template

A mobile app financial model template is designed to offer a comprehensive yet straightforward solution for developers, entrepreneurs, and financial professionals to manage the financial aspects of a mobile app business. Below is an in-depth look at the core features of a mobile app financial model:
1. Input Sheets
At the heart of the model are user-friendly input sheets that serve as the foundation for all financial forecasts. These sheets allow users to input assumptions, which are then used to generate revenue, cost, and cash flow projections. Key input variables include:
- Cost per Install (CPI): This feature allows users to input the cost per paid install (through ads, promotions, or partnerships) and automatically calculates user acquisition costs. The model factors in both organic and paid installs to provide a holistic view of user acquisition expenses.
- Organic Downloads: Users can project organic downloads based on marketing efforts, word-of-mouth, app store optimization, and other unpaid acquisition channels. Organic downloads are a vital aspect of the model as they represent user growth without additional acquisition costs, positively affecting profitability.
- Revenue Sources: The model includes multiple revenue streams commonly associated with mobile apps:
- In-App Purchases (IAP): The template allows users to input the number of users making purchases, average transaction value, and frequency. These inputs generate revenue projections based on user activity.
- Ad Revenue: Users can input metrics such as impressions per user, ad fill rate, cost per mille (CPM), and click-through rates (CTR) to estimate ad revenue. This is particularly useful for free apps that rely on advertisements for monetization.
- Subscriptions: For apps that offer recurring payment options, the model allows inputs for monthly or annual subscription pricing, conversion rates, and churn rates. This provides a clear view of recurring revenue, which is crucial for apps focused on long-term revenue streams.
- Affiliate Revenue: If your app generates income through affiliate marketing, users can enter the conversion rates and affiliate commission per conversion, enabling affiliate revenue projections.
- User Growth Assumptions: The input sheets allow users to project user growth by inputting variables such as new monthly installs, retention rates, and churn rates, providing a detailed forecast of active users over time. This feature helps in predicting app popularity and future scalability.
2. Staff, COGS, SG&A Calculation Sheets
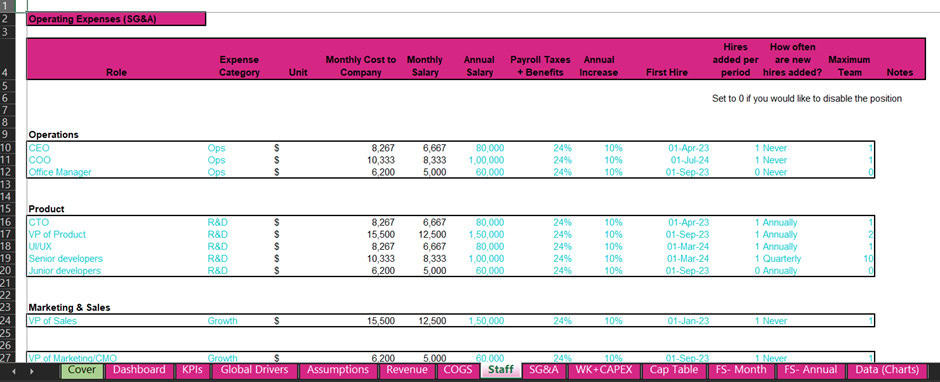
Managing operational costs is critical in any app business. To that end, the model includes detailed calculation sheets for staffing, Cost of Goods Sold (COGS), and Selling, General, and Administrative Expenses (SG&A).
- Staff Requirements Sheet: This sheet allows users to calculate staffing needs for various departments such as development, marketing, customer support, and administration. Key inputs include:
- Headcount Projections: The user can project how many employees will be required in each department over time as the app scales.
- Salary & Benefits: The template calculates labor costs based on projected salaries, taxes, and benefits. It also factors in different compensation packages for full-time, part-time, or contract employees.
- Hiring Timeline: Users can input the timeline for when specific staff will be hired, allowing for a dynamic projection of labor costs as the app grows.
- Cost of Goods Sold (COGS) Sheet: This sheet calculates the direct costs associated with app development and service delivery, which typically include:
- Server Costs: Cloud hosting and data storage costs based on monthly active users and data consumption.
- Platform Fees: App store fees (e.g., Apple App Store or Google Play Store commissions) are integrated into the COGS calculations, accounting for the 15-30% commission on in-app sales.
- Development Costs: Ongoing development and maintenance costs are factored into the COGS, including expenses for upgrades, bug fixes, and new feature releases.
- SG&A (Selling, General, and Administrative Expenses) Sheet: This sheet captures all overhead costs necessary to run the app:
- Marketing Costs: Allows input for digital marketing, influencer campaigns, app store optimization, and social media ads.
- Administrative Costs: Includes rent, utilities, office supplies, and other general overheads.
- Legal & Compliance Costs: Provides a space to include regulatory costs, legal services, and other compliance-related expenses.
3. Monthly & Yearly Financial Statements
The financial model provides both monthly and yearly financial statements to allow users to track performance on a short-term and long-term basis.
- Monthly Financial Statements: These statements break down revenue, expenses, and cash flow on a month-to-month basis. This granular view allows users to monitor seasonality, user growth trends, and the impact of specific marketing or product launches on the bottom line. It includes:
- Profit and Loss (P&L): Tracks the app’s revenue streams, direct costs, gross margins, SG&A, and net profit or loss each month.
- Cash Flow: Provides a detailed cash flow projection, ensuring that you can identify when additional funding might be required or when the app is expected to generate positive cash flow.
- Balance Sheet: Projects the app’s financial position, tracking assets (cash, accounts receivable), liabilities (loans, deferred revenue), and equity on a monthly basis.
- Yearly Financial Statements: These high-level financial projections summarize the app’s financial performance over the course of multiple years, allowing users to see long-term trends and project future growth. It includes:
- Annual Income Statement: A summary of revenues, COGS, and net income for each year.
- Annual Cash Flow Statement: Tracks annual cash inflows and outflows, providing a high-level view of financial health.
- Balance Sheet: Shows the app’s projected assets, liabilities, and equity on a yearly basis.
4. Key Performance Indicators (KPIs)
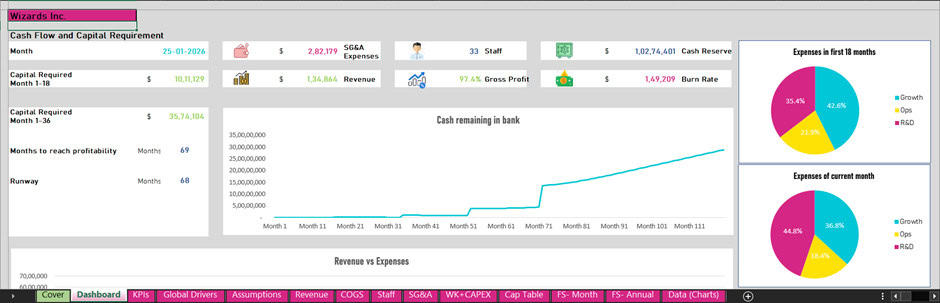
Tracking and analyzing performance is crucial for any mobile app business. This model automatically calculates industry-specific KPIs based on user inputs, allowing you to monitor performance and optimize strategy. Some of the core KPIs tracked include:
- Monthly Active Users (MAU): Tracks the number of unique users who engage with your app each month. This is a key metric for understanding user engagement and growth trends.
- Cost per Install (CPI): CPI is automatically calculated based on marketing costs and user acquisition figures. It gives you an understanding of how much it costs to acquire each user through paid channels.
- Churn Rate: For subscription-based apps, the churn rate is calculated to measure how many users cancel their subscriptions over a given time period. This helps in projecting long-term user retention and revenue.
- Monthly Recurring Revenue (MRR): Tracks the amount of revenue generated from subscriptions each month. This KPI is crucial for subscription-based apps, providing insight into how stable and predictable your revenue is.
- Customer Lifetime Value (CLV): The model calculates the average revenue generated by a user over their entire relationship with your app, factoring in churn rates and monetization methods. CLV is critical for understanding long-term profitability.
- Cumulative Downloads: Tracks the total number of app downloads, both paid and organic, giving a full picture of your app’s growth trajectory.
5. Financial Projections & Scenario Planning
The model provides in-depth financial projections that give users the ability to visualize the app’s financial trajectory. By inputting assumptions about user growth, acquisition costs, and monetization strategies, the model generates detailed revenue forecasts and cost breakdowns. Scenario planning features allow for multiple projections based on different growth and risk assumptions:
- Optimistic Case: This scenario assumes higher user growth, lower churn, and higher conversion rates, giving you a best-case financial outcome.
- Baseline Case: A more conservative, realistic forecast based on average growth rates and industry standards.
- Pessimistic Case: This scenario assumes slower user growth, higher churn, and lower conversion rates, helping to identify potential cash flow challenges or profitability issues.
Why You Should Buy This Financial Model Template
- Customizable and Easy to Use: The model is built with user-friendly input sheets, so you don’t need to be a financial expert to use it. The inputs can be customized to fit the unique needs of your app, whether it’s a gaming app, subscription service, or an e-commerce platform.
- Comprehensive Financial Forecasting: This model covers all the necessary aspects of financial planning for a mobile app business, including revenue projections, cost analysis, and profitability. It ensures you can track every dollar spent and earned, from user acquisition to operational costs.
- Tailored for the Mobile App Industry: Unlike generic financial models, this template is specifically designed for mobile apps. It incorporates industry-specific KPIs like CPI, MAU, and churn rates, making it a more relevant tool for app developers and entrepreneurs.
- Ideal for Investor Presentations: If you’re looking to secure funding, this financial model is an excellent resource. It provides a professional and detailed projection of your app’s financial future, giving investors confidence in your business plan.
- Scenario Planning: The model allows you to run different financial scenarios (optimistic, baseline, and pessimistic), which is invaluable for strategic planning and risk management. It helps you understand the best and worst-case financial outcomes for your app.
- KPI Tracking: The inclusion of crucial KPIs makes it easy to monitor the app’s performance in real time. You can track user growth, acquisition costs, and revenue generation with built-in formulas that update automatically as you input new data.
- Multi-Year Projections: With both monthly and yearly financial statements, this model helps you plan not just for the immediate future but also for long-term growth. It allows you to project your business’s performance over several years, making it easier to prepare for scaling.
- Built for Growth: Whether you’re a startup looking to gain traction or an established app aiming to scale, this financial model is designed to accommodate growth. From user acquisition strategies to operating costs, the model adapts to the needs of a growing business.
Conclusion
In today’s competitive mobile app industry, having a robust financial model is crucial for success. Whether you’re seeking investment, planning for growth, or monitoring app performance, this mobile app financial model template offers the comprehensive tools and insights needed to make informed decisions. Its user-friendly design, industry-specific features, and accurate financial projections make it an essential tool for anyone in the mobile app business. By incorporating KPIs such as MAU, CPI, and MRR, along with detailed cost and revenue projections, this financial model empowers you to chart the course for your app’s success. Don’t leave your app’s financial future to chance. Invest in this financial model template today and take control of your business’s growth trajectory.
About AUT Financial Modeling
Welcome to AUT Financial Modeling, your trusted partner for cutting-edge, comprehensive, and user-friendly financial models. With a strong focus on corporate finance, valuation, and private equity, we bring together expertise, innovation, and precision to deliver the highest standard of financial modeling solutions.
At AUT Financial Modeling, we understand that accurate and reliable financial models are the backbone of informed decision-making. We are committed to empowering our clients with the tools they need to navigate the complex world of finance.
Our team of seasoned professionals combines deep industry knowledge with advanced technical skills, enabling us to craft financial models that are tailored to the unique needs of your business. We take pride in our attention to detail, ensuring that every aspect of the model is meticulously crafted to reflect the intricacies of your specific situation.
Partner with us today and unlock the full potential of your financial analysis.
Feel free also to check out the full list of industry-specific templates by AUT Financial Modeling here:












You might also like:
- 10 Ideas to Increase Average Revenue Per User
- 10 Main Elements of a Business Plan
- 5 Practical Tips to Help Raise Funds For Startups
- Mastering SWOT Analysis for Business Plan Success
- How to Build a Capitalization Table
- Startup Model Templates in Excel that can help your Business Grow
- How to Write a Killer Mobile App Business Plan
- How to Successfully Plan a Hydrogen Energy Project
- Financial Modeling for Startups and Small Businesses
- A Step-By-Step Guide to the Merger and Acquisition Process
- Financial Projections Templates – The Easy Way
- Financial Modeling for a Gold Mining Investment
- Real Estate Financial Modeling in Excel
- Common Financial Modeling Mistakes to Avoid
- How to Maximize Profits with Cost Per Click (CPC)
- Budget Template in Excel – Analysis in 4 Steps
- Financial Model for Mobile App | Mobile App Business Plan
- Financial Planning for Small Business Owners – Taking an SBA Loan
- SaaS Business Financial Model
- Financial Modeling Using Excel


