
0 ITEMS

Best Financial Indicators: A Guide to Optimization

The best financial indicators are critical for optimizing investment strategies. Key metrics include profitability ratios, liquidity ratios, and debt indicators.
Understanding the most effective financial indicators is essential to successfully navigating the complex world of investing and finance. These indicators act as a roadmap for investors, analysts, and finance professionals, offering vital insights into a company’s financial health, market position, and future performance potential.
As an investment tool, they help identify strengths and weaknesses in a business, guiding strategic decision-making and optimizing financial outcomes. The right combination of these metrics can make a difference between a mediocre investment portfolio and an exceptional one. Therefore, it’s vital to comprehend which indicators align best with financial goals and how to interpret them effectively for optimal financial planning and assessment.
Introduction To Financial Indicators
Investors and economists use financial indicators to understand market conditions. These tools provide insights into economic health and potential investment outcomes. An understanding of these indicators is essential for optimizing financial strategies.
Understanding Financial Indicators
Financial indicators are vital signs of the economy’s performance. They can denote the stability of markets, forecasting future trends. People often consider them the guideposts in the maze of financial decision-making.
The Role Of Financial Indicators In Market Analysis
- Measure performance: They assess the health of economies or companies.
- Predict trends: Indicators help foresee market movements.
- Inform decisions: Traders and analysts base their strategies on these indicators.
Types Of Financial Indicators
| Type | Description | Examples |
|---|---|---|
| Economic Indicators | Reflect the overall health of the economy. | GDP, inflation rates |
| Market Indicators | Provide information about stock market trends. | Dow Jones, NASDAQ |
| Company Indicators | Showcase individual company’s performance. | Earnings per share (EPS), Price-to-earnings (P/E) ratio |
Key Financial Indicators For Optimization
Navigating the financial health of a business requires understanding its vital signs. Key financial indicators provide a snapshot of performance. They guide decision-making and strategy. Let’s dive into the most critical indicators for optimizing your financial strategy.
Profitability Indicators: Roi, Roe, And Roa
Profitability indicators reflect a company’s capacity to generate earnings relative to expenses, assets, and equity. They include:
| Indicator | Details |
|---|---|
| ROI (Return on Investment) | Measures the gain from an investment relative to its cost. |
| ROE (Return on Equity) | Shows the profitability from shareholders’ equity. |
| ROA (Return on Assets) | Indicates how effectively a company uses its assets to generate profit. |
Liquidity Measures: Current Ratio And Quick Ratio
Understanding a company’s liquidity—its ability to pay off short-term obligations—is crucial. Two essential liquidity measures include:
- Current Ratio – Calculates a company’s ability to pay short-term debts with current assets.
- Quick Ratio – Assesses the ability to cover immediate liabilities without selling inventory.
Solvency Ratios: Debt To Equity And Interest Coverage
Solvency ratios express a company’s ability to meet long-term debts and obligations:
- Debt to Equity – Compares total liabilities to shareholders’ equity.
- Interest Coverage – Determines how easily a company can pay interest expenses on outstanding debt.
Efficiency Metrics: Inventory Turnover And Asset Turnover
Efficiency metrics gauge how well a company manages its resources:
- Inventory Turnover – Shows how often inventory is sold and replaced over a period.
- Asset Turnover – Highlights the sales generated for each dollar of assets owned.
Market Value Indicators: P/e Ratio And Market Capitalization
The market’s view of a company’s value comes into play with market value indicators:
- P/E Ratio (Price-to-Earnings)
- Compares a company’s share price to its earnings per share.
- Market Capitalization
- Represents the total value of all a company’s shares of stock.
Strategies For Optimizing Financial Indicators
Smart management of financial indicators boosts a company’s health. It helps track progress and set goals. This part delves into strategic practices for fine-tuning these measures. To optimize financial indicators, consider these pivotal methods.
Using Financial Ratios For Performance Benchmarking
Financial ratios serve as a performance gauge. They compare different financial metrics. Profitability, liquidity, and leverage ratios are key. Let’s explore each one.
| Ratio Type | What It Shows |
|---|---|
| Profitability Ratios | Earnings against sales or investments |
| Liquidity Ratios | Cash availability to settle debts |
| Leverage Ratios | Debt level in business financing |
Use industry benchmarks to compare ratios. It identifies strengths and weaknesses.
Incorporating Macroeconomic Factors In Optimization
Macroeconomic elements impact financial indicators. Interest rates, inflation, and GDP growth are crucial. Adjusting for these factors enables better forecasting and decision-making.
- Interest Rates: Affect borrowing costs and investment returns.
- Inflation: Changes buying power and cost structures.
- GDP Growth: Influences market size and opportunities.
Adjusting Financial Indicators According To Industry Norms
Each industry has unique financial norms. Compare similar companies’ financial metrics. Tailor your indicators to reflect those trends. It fosters accuracy in performance analysis.
Periodic Review And Reassessment Of Financial Metrics
Continuous review keeps financial metrics relevant. Schedule regular performance evaluations. Adjust for changes in business operations or the economy. It ensures your metrics stay up-to-date and insightful.
- Quarterly financial reviews
- Annual in-depth analyses
- Adjustments for major economic shifts
Real-world Application Of Financial Indicators
Understanding how businesses succeed or fail boils down to knowing the right financial indicators. These indicators are key for business health checks. Companies worldwide lean heavily on them for making strategic moves. From balance sheets to profit margins, these figures shape decisions. Explore the power of financial indicators in action.
Case Studies: Successful Use Of Financial Indicators
Real stories of success can offer insight into financial management. Let’s delve into some standout cases:
- Company A saw a 20% rise in profits after improving its debt-to-equity ratio.
- Retail Giant B used sales growth rates to expand its market share.
- Tech Start-up C attracted investors by showcasing a strong quick ratio, indicating liquidity.
Challenges And Limitations In Financial Indicators Optimization
While powerful, financial indicators come with challenges:
- Data overload can cloud decision-making.
- Outdated numbers may lead to poor strategies.
- Indicators vary across industries, creating confusion.
These barriers make optimization a careful balance of analysis and timing.
Emerging Trends And Future Of Financial Indicators
The future looks bright for financial indicators with tech playing a big role. Here are three upcoming trends:
- Integration of Big Data: Tighter data analysis reveals untapped potential.
- Real-time Analytics: Instant numbers allow swift action.
- AI and Machine Learning: Smarter systems predict financial outcomes.
These developments promise a new era for fiscal analytics.
Frequently Asked Questions Of Best Financial Indicators: A Guide To Optimization
What Is The Best Indicator Of Financial Success?
The best indicator of financial success is consistent profit growth over time. It reflects a company’s capacity to expand and manage finances effectively.
What Are The 4 Main Types Of Performance Indicators?
The four main types of performance indicators are efficiency, effectiveness, quality, and productivity. These metrics evaluate and guide performance across various organizational levels.
What Are The Three Most Important Financial Metrics?
The three most important financial metrics are net profit margin, return on investment (ROI), and cash flow. Net profit margin measures profitability; ROI evaluates investment efficiency; and cash flow indicates financial health.
What Is The Best Indicator For Performance?
The best performance indicator varies by industry and objective, yet common choices include return on investment (ROI), key performance indicators (KPIs), productivity metrics, and customer satisfaction scores.
Conclusion
Navigating the complex world of finance can be daunting. Our guide has equipped you with the best financial indicators to fine-tune your strategy. By leveraging these tools, you’re poised to optimize your investments and fiscal decisions. Remember, regular review and adaptation are key to staying ahead in the financial game.
Stay informed, stay agile, and watch your financial health flourish.


The Solar Energy Financial Model Spreadsheet Template in Excel assists you in preparing a sophisticated financial forecast for a utility-scale solar p... read more

The Mobile App Financial Plan Template in Excel allows you to develop financial projections when launching a new business centered around an app insta... read more


The Private Equity Fund Cashflows Model helps LPs and GPs analyze fund cash flows, returns, and distributions across investor, manager, and portfolio ... read more


The Coffee Shop Financial Model helps entrepreneurs, founders, business owners, consultants, and analysts turn a cafe concept into a structured financ... read more

This Discounted Cash Flow (DCF) valuation calculator template projects a three-statement model that allows users to value a company based on the net p... read more

The Hotel Financial Model helps users build a structured financial forecast for a hotel business using the revenue drivers that matter most in hospita... read more

The Upstream Oil & Gas Project Financial Model Template in Excel empowers you to project and dissect your impending Oil and Gas drilling ventures. Pre... read more

This Project Plan Template in Google Sheet allows you to quickly develop a project plan and plot a Gantt chart. Enjoy all the benefits of Google Docs ... read more

We are introducing our 4-Tier Waterfall Profit Distribution Model. The waterfall profit distribution model template aims to support a thorough analysi... read more


Dynamic 10-Year Financial Model, suitable for any type of business, supporting strategic planning, investment decisions, and business valuation.

This green hydrogen financial model template builds a multi-year financial plan to analyze the financial feasibility and profitability for the product... read more

Investors can assess the viability of setting up and investing in gasoline stations with a charging station by downloading a financial model for their... read more

The Grocery Store Financial Model helps entrepreneurs, founders, consultants, analysts, and retail business owners build a structured financial foreca... read more

The Outpatient Clinic Financial Model helps users turn a clinic business concept into a structured, editable financial forecast. Instead of relying on... read more

The beverage manufacturing industry is a dynamic and rapidly growing sector that caters to a diverse market ranging from soft drinks and juices to alc... read more

Highly-sophisticated and user-friendly financial model for Startup Companies providing a 5-Year advanced financial forecast.

The Bakery Financial Model helps entrepreneurs, bakery owners, consultants, analysts, and business plan writers turn a bakery concept into a structure... read more


Average rating:Submit Rating
Model for in depth understanding of high level profit and loss and revenue analysis. Big-4 like checklist of due diligence analyses. This Financial Du... read more

The Cafe Financial Model is a ready-to-use financial model template designed to help entrepreneurs, cafe owners, founders, consultants, and analysts b... read more

The Clothing Store Financial Model helps turn a retail apparel concept into a structured financial forecast that can be used for planning, funding, bu... read more

The Poultry Farming Financial Model helps users turn a poultry farm concept into a structured, lender-ready financial forecast. It is designed for pla... read more

The Online Clothing Store Financial Model helps founders, entrepreneurs, business owners, consultants, and analysts turn an apparel e-commerce idea in... read more

The Dental Clinic Financial Model helps users turn a dental practice concept, launch plan, or expansion strategy into a structured five-year financial... read more

This poultry financial model template in Excel provides a framework to determine the financial feasibility of a new poultry project for producing bro... read more


Start Up Solar Farm Excel Model presents the business case of an investment in the construction of a solar farm and the sale of the energy generated f... read more

Launching a manufacturing startup can be complex, and securing financing requires a solid financial plan. Our Manufacturing Startup Financial Feasibil... read more
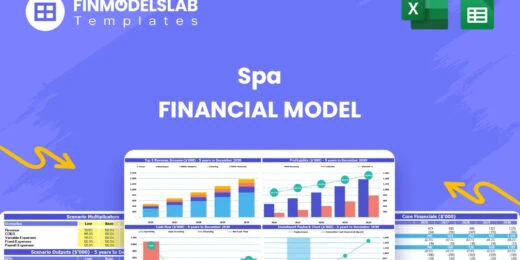
The Spa Financial Model helps entrepreneurs, spa owners, consultants, analysts, and business planners turn a wellness concept into a structured five-y... read more

!! Kindly use the latest Microsoft Excel Version before purchasing the model, otherwise, the dynamic dashboard will NOT work.!! Inventory Dashboard Mo... read more
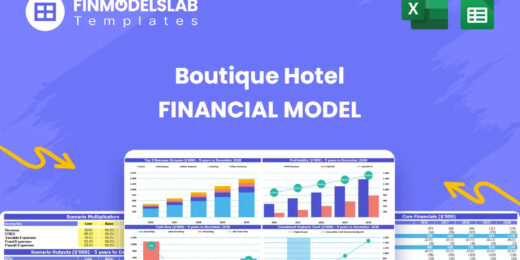
The Boutique Hotel Financial Model Financial Model Template helps entrepreneurs, hotel owners, consultants, analysts, and founders turn a boutique hos... read more

This chicken egg farming model aims to plan the operations, financial feasibility, and profitability of a new poultry egg farming business. This Start... read more
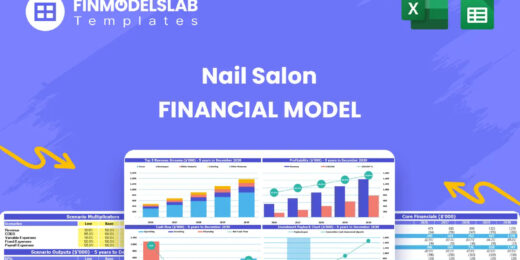
The Nail Salon Financial Model Financial Model Template helps entrepreneurs, salon owners, consultants, analysts, and business plan writers turn a nai... read more


This excel template is great for those wanting a professional-looking forecast 10 years of financial statements, those starting out as an entrepreneur... read more

This coffee farm financial feasibility model template prepares a financial plan for your next coffee growing project! Figure out the expected incomes ... read more
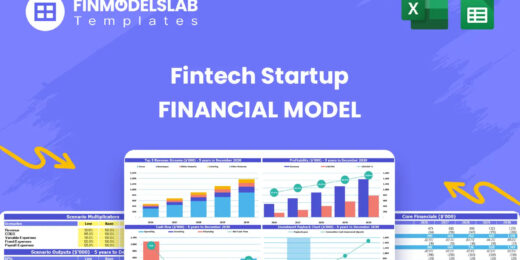
The Fintech Startup Financial Model helps founders, analysts, consultants, and business planners turn a fintech lending concept into a structured five... read more
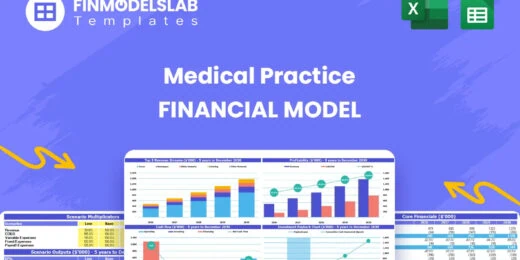
The Medical Practice Financial Model helps users turn a clinic concept, expansion plan, or healthcare service idea into a structured five-year financi... read more
Average rating:Submit Rating
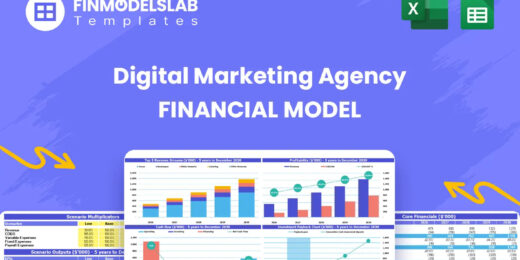
The Digital Marketing Agency Financial Model helps agency founders, business owners, consultants, and analysts build a structured financial forecast f... read more
Average rating:Submit Rating
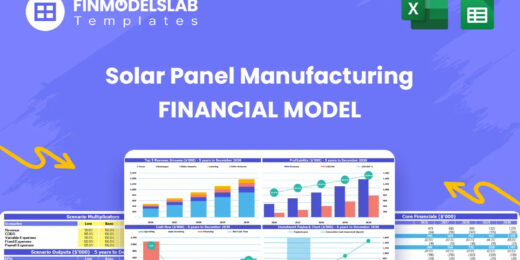
The Solar Panel Manufacturing Financial Model helps users turn a solar factory concept into a structured, investor-ready financial forecast. It is des... read more
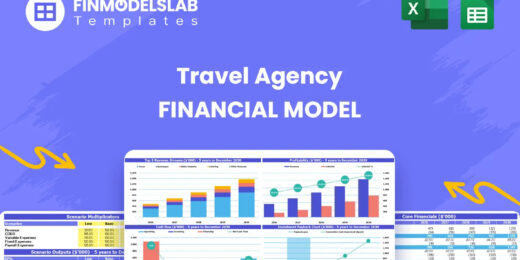
The Travel Agency Financial Model helps entrepreneurs, founders, consultants, analysts, and business owners build a structured financial forecast for ... read more
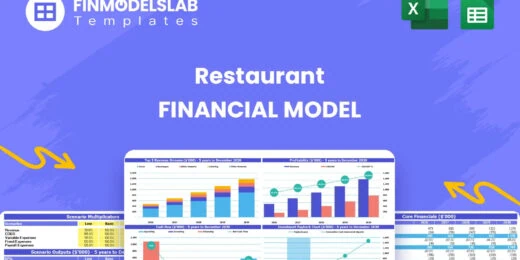
" The Restaurant Financial Model helps users turn a restaurant concept into a structured, editable financial forecast without building complex spreads... read more
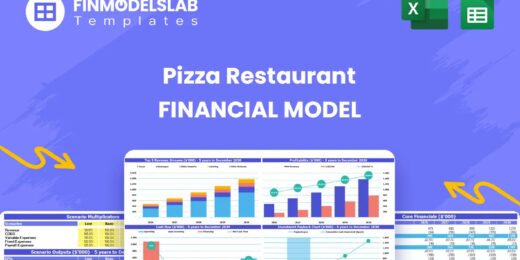
The Pizza Restaurant Financial Model Template helps entrepreneurs, restaurant owners, consultants, analysts, and founders turn a pizza restaurant conc... read more

The Personal Budgeting App Financial Model Financial Model Template helps founders, entrepreneurs, consultants, analysts, and business planners turn a... read more

The Real Estate Portfolio Financial Model Template forecasts the financial performance when building a real estate portfolio. The model allows simulat... read more
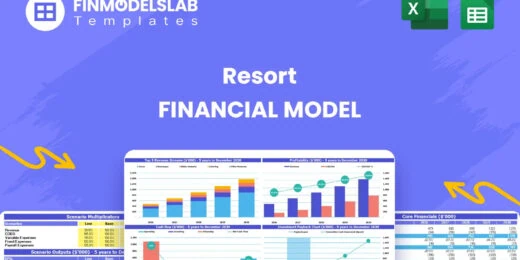
The Resort Financial Model Financial Model Template helps resort developers, hospitality entrepreneurs, business owners, consultants, and analysts tur... read more
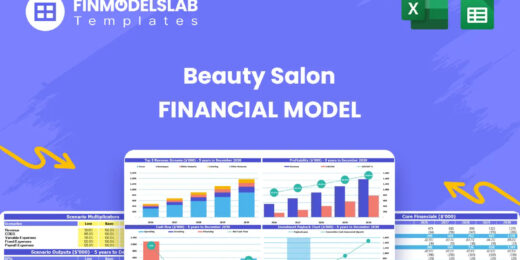
The Beauty Salon Financial Model helps entrepreneurs, salon owners, consultants, analysts, and founders turn a salon business idea into a structured f... read more
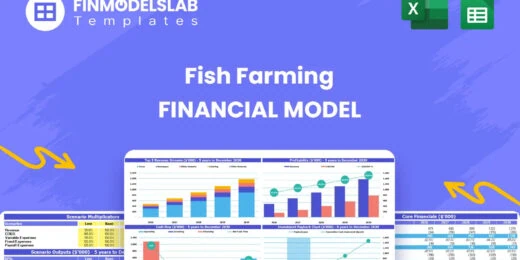
The Fish Farming Financial Model template helps entrepreneurs, aquaculture founders, business owners, consultants, and analysts build a structured for... read more
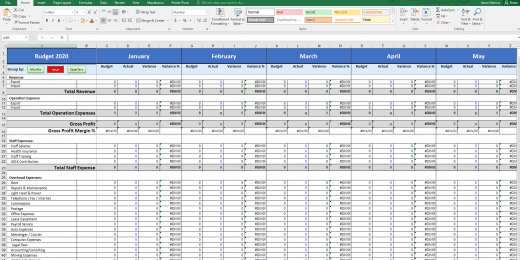

The Budget vs. Actual financial model is used to measure actual results against the budget projected for the financial period.

Project Finance Model for a Solar (PV) Power Plant projecting revenue, operating costs, and cash flow based on installed capacity, solar irradiance, p... read more
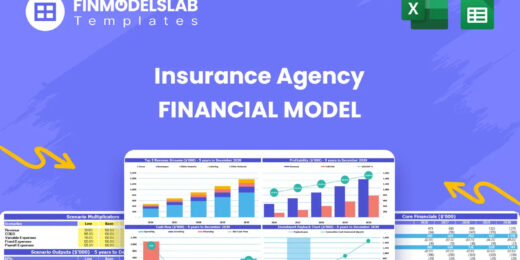
The Insurance Agency Financial Model helps entrepreneurs, agency owners, consultants, analysts, and business planners build a structured financial for... read more

The Mergers & Acquisition (M&A) Model provides a projection for a company looking to potentially merge or acquire another company. This model runs... read more


A professional template to budget payroll expenses


Average rating:Submit Rating
Financial model template for a high-level real estate brokerage firm that facilitates the buying and selling of real estate properties between buyers ... read more
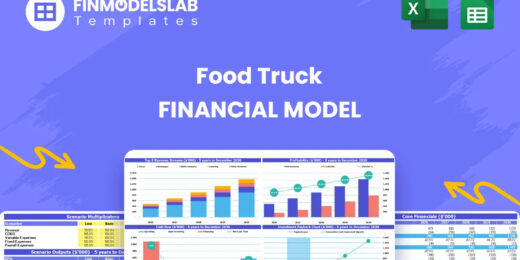
The Food Truck Financial Model helps entrepreneurs, founders, business owners, consultants, and analysts turn a mobile food business idea into a struc... read more

Distilleries, with their rich history of crafting spirits, have experienced a resurgence in popularity, driven by consumer interest in artisanal and l... read more

Advanced 10-year financial model for a Software as a Service (SaaS) business providing a solid financial foundation to evaluate scalability, optimize ... read more

Our Net Present Value Calculator in Excel helps you quickly assess the profitability of your investments by simplifying complex financial calculations... read more


User-friendly Excel model intended for the preparation of a Cost-Benefit Analysis to determine the financial viability for a proposed project or inves... read more
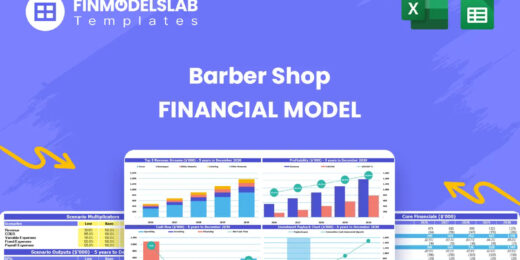
The Barber Shop Financial Model Financial Model Template helps entrepreneurs, business owners, consultants, and analysts turn a barber shop concept in... read more

Setting up a biodiesel manufacturing plant requires a comprehensive and executed business strategy. To assess biodiesel production's financial sustain... read more

Best practice model for a complete Price Volume Mix (PVM) analysis on revenue and on gross profit by product.
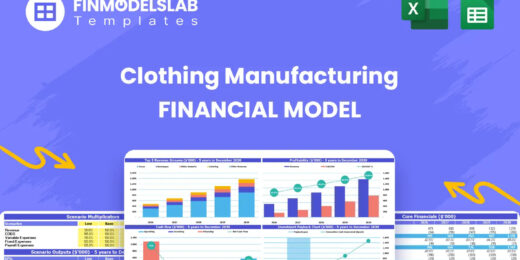
The Clothing Manufacturing Financial Model helps users turn a garment production concept into a structured, editable financial forecast. It is built f... read more

The Cannabis Business Financial Model is a ready-to-use financial model template designed to help entrepreneurs, founders, consultants, analysts, and ... read more

The Clinical Laboratory Financial Model helps users turn a diagnostic lab concept into a structured five-year financial forecast. It gives entrepreneu... read more
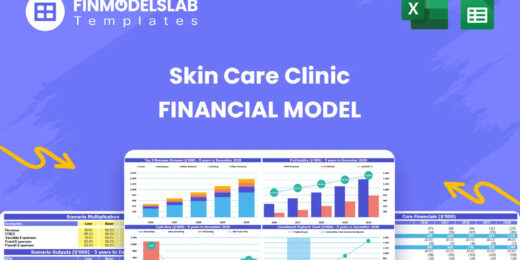
The Skin Care Clinic Financial Model helps entrepreneurs, clinic owners, consultants, analysts, and business planners turn a skin care or aesthetic cl... read more

With this comprehensive 5- or 10-year monthly tool, investors can assess the viability of setting up and investing in an EV charging station business ... read more

The Green Hydrogen from Wind Financial Model aims to comprehensively forecast a horizon of 40 years of the financial feasibility and profitability of ... read more
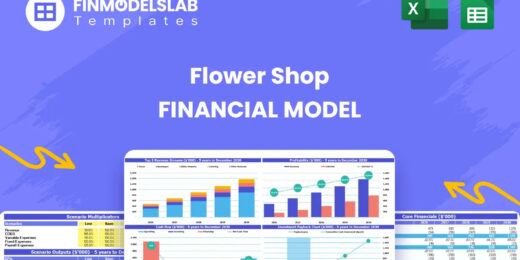
The Flower Shop Financial Model helps entrepreneurs, florists, business owners, consultants, and analysts turn a floral retail concept into a structur... read more
The Bar Financial Model Financial Model Template helps entrepreneurs, bar owners, consultants, analysts, and founders turn a bar, pub, lounge, or nigh... read more
The Healthcare Clinic Financial Model helps founders, clinic owners, consultants, analysts, and business planners turn a healthcare clinic concept int... read more

Shopping Mall Financial Model presents the case of an investment into a shopping mall and its operation. The model generates the three financial state... read more

Financial Model providing a 10-year financial plan for a startup or operating Subscription Business.
The Catering Service Financial Model helps users turn a catering business plan into a structured, editable financial forecast. Instead of relying on r... read more

5-year financial model for a hair and beauty salon providing revenue forecasts, cost analysis, and insights to support growth and profitability.
The Physiotherapy Clinic Financial Model helps founders, clinic owners, consultants, analysts, and business plan writers turn a physiotherapy clinic c... read more

Average rating:Submit Rating
Financial Modeling Tutorial guides user via step by step approach on how to build financial models with DCF valuation


This Hotel / Holiday Resort Development Model will take you through a 20-year period of Three Statement Analysis and provide you with key valuation da... read more
The Vegetable Farming Financial Model helps users turn a farming concept, expansion plan, or funding proposal into a structured financial forecast. In... read more
The Juice Bar Financial Model helps entrepreneurs, founders, consultants, analysts, and business owners turn a juice bar or beverage service concept i... read more
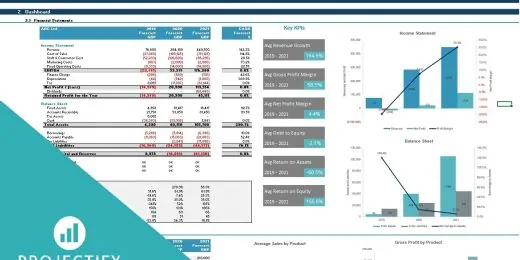
User-friendly Excel model intended for the preparation of a 3 statement (Income Statement, Balance Sheet and Cashflow Statement) financial projection ... read more

Average rating:Submit Rating
3 statement 5 year rolling financial projection Excel model for a startup /existing manufacturing business

Average rating:Submit Rating
Electric Vehicle (EV) charging Station FM helps user asses financial viability of setting up and operating a charging station.

The Food Manufacturing Financial Model helps entrepreneurs, founders, consultants, analysts, and business owners turn a food production concept into a... read more
Financial model presenting a Crop Farm business scenario.
Average rating:Submit Rating
The SaaS Business Financial Model helps founders, entrepreneurs, consultants, analysts, and business owners build a structured financial plan for a so... read more

Take this opportunity and get a discount by getting the Renewable Energy Bundle where you get Solar, Wind and Bio Gas Plant Financial Model Templates!
The Candy Store Financial Model helps entrepreneurs and planners turn a retail confectionery concept into a structured financial forecast. Instead of ... read more

This is a collection of financial model templates for businesses in the Agriculture Industry and its related sectors.
The Bed and Breakfast Financial Model is a ready-to-use financial model template built to help entrepreneurs, inn owners, consultants, analysts, and b... read more

Our Mini-Storage Financial Model Template is your all-in-one solution for building a profitable and scalable storage business. Featuring a Detailed 10... read more

Financial Model presenting a business scenario of a corporation engaged in granting loans from its own capital funds or from funds sourced by investor... read more
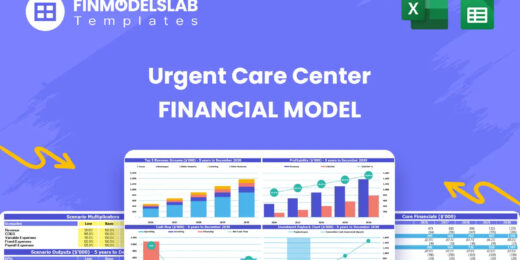
The Urgent Care Center Financial Model helps users turn a walk-in clinic concept into a structured financial forecast that can support planning, budge... read more

This Car Rental Business Financial Model Template in Excel offers an ideal basis for developing a business plan for a car rental company. The template... read more

The purpose of this Bundle of Business Forecasting and Financial Models is to assist Business Owners and Consultants with a consistent approach to for... read more

This comprehensive 40-year tool aid investors in evaluating potential risks and returns and assess the viability of setting up and investing in the pr... read more

The objective of the Geothermal Energy financial feasibility model template is to analyze a new Geothermal Energy project in quite some detail in orde... read more

The digital product marketplace model prepares a financial plan in Excel for online marketplace Startup businesses similar to concepts such as Themefo... read more

Average rating:Submit Rating
Financial model that performs a DCF & Relative valuation on Mining Company.

A collection of user-friendly Project Finance Models in the Renewable Energy Sector offered at a discounted price you can’t miss!

The E-Commerce Business Financial Model Template helps founders, online store owners, consultants, analysts, and business planners turn an e-commerce ... read more
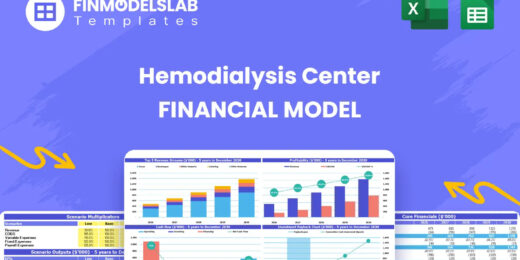
The Hemodialysis Center Financial Model helps users evaluate the financial feasibility of launching, funding, or expanding a dialysis clinic with a st... read more

Average rating:Submit Rating
The toolkit is an essential resource for any organization, providing a comprehensive collection of tools and templates designed to streamline financia... read more
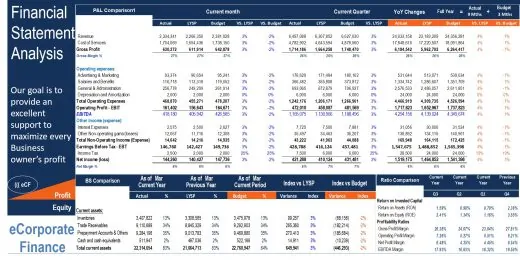
The main purpose of the model is to allows user to easily compare the financial performance result from one period to the next or between actual and b... read more
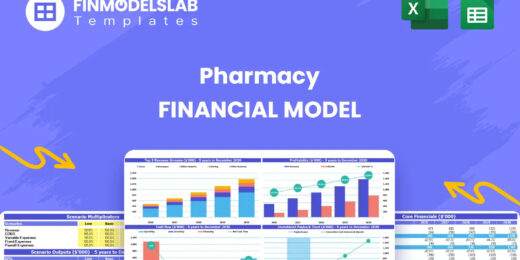
The Pharmacy Financial Model template helps entrepreneurs, pharmacy owners, consultants, analysts, and business plan writers turn a retail pharmacy co... read more
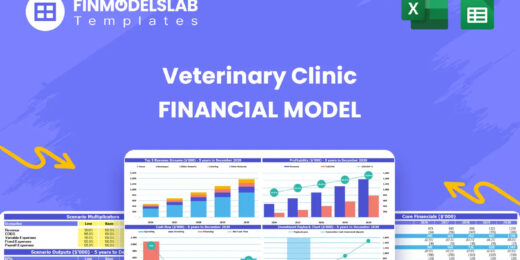
The Veterinary Clinic Financial Model Financial Model Template helps entrepreneurs, clinic owners, consultants, analysts, and business planners turn a... read more

The Liquor Store Financial Model helps entrepreneurs, store owners, consultants, analysts, and business plan writers turn a retail alcohol business co... read more

The goal of this model is to assist you with starting or buying a coffee farm. The financial spreadsheet templates assist in analysing and forecasting... read more
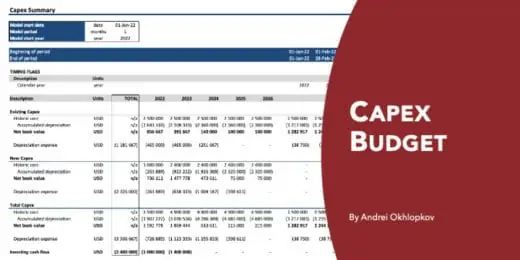
A professional template to budget investing cashflow, fixed asset book values and depreciation

Highly versatile and user-friendly Excel model for the preparation of a rolling 3 statement (Income Statement, Balance Sheet and Cash flow Statement) ... read more


Average rating:
Fully-Vetted Comprehensive Youtube Content Creator Financial Model + Video Series + eBook

The Daycare Center Financial Model helps entrepreneurs, childcare founders, consultants, analysts, and business owners turn a daycare concept into a s... read more


Real Estate Financial Model to evaluate a development project, with Equity Waterfall and Advanced Scenarios Modeling

This Real Estate Development Bundle is a collection of real estate calculators or tools in MS Excel that will help with real estate development proje... read more

Budgeting & Forecasting Template suitable for either a Trade or Service company in any type of industry.


Abacus is a bankable, easy-to-use, debt-sculpting financial model for use in renewable (solar, wind, etc.) energy as well as PPP transactions.
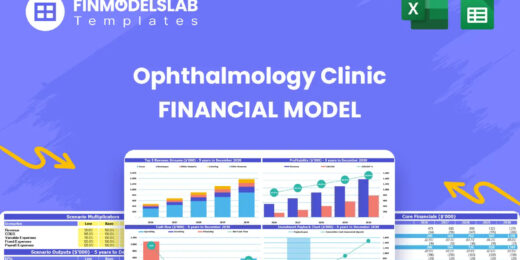
The Ophthalmology Clinic Financial Model is a ready-to-use financial model template designed to help founders, clinic owners, consultants, analysts, a... read more

The Nightclub Financial Model helps users turn a nightlife business concept into a structured financial forecast that can be used for planning, budget... read more

The Rice Farming Financial Model enables rice farmers and investor to evaluate an investment into a rice farming operation via Discounted Free Cash Fl... read more

A collection of templates suitable for various types of businesses/industries, covering major accounting, financial analysis, business valuation, and ... read more

Average rating:Submit Rating
3 statement 5 or 8 year rolling financial projection Excel model for an investment holding company holding investments in up to 8 portfolio companies ... read more

The Purpose of the 4 Step Budget Analysis Spreadsheet Template is to offer a user-friendly solution to track your budget on a monthly basis. The budge... read more

The Gift Shop Financial Model helps users build a structured financial forecast for a retail gift store without starting from a blank spreadsheet. It ... read more

3-Statement 5 year rolling financial projection Excel model with valuation for existing/startup Asset Management business managing customer investment... read more
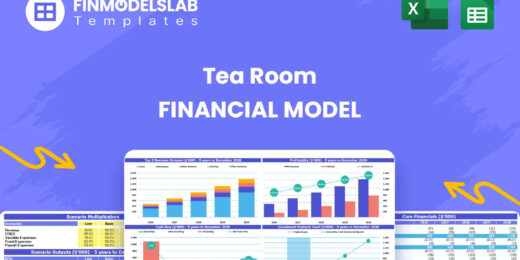
The Tea Room Financial Model helps entrepreneurs, operators, consultants, and business planners turn a tea room concept into a structured financial fo... read more

The Financial Business Plan Template for starting a Nail Salon was developed to obtain a comprehensive view on the economics and financial prospects o... read more

Average rating:Submit Rating
Cash Flow Projection Template Highlights One-year Cash Flow Projection template is a useful tool for cash flow forecasting and for effectively plannin... read more

The Dairy Farm Valuation Model forecasts the expected financials for a dairy farm and calculates the resulting DCF value.

Average rating:Submit Rating
3 statement 5 year rolling financial projection Excel model for a startup /existing business engaged in construction or engineering projects

The Preschool Financial Model helps entrepreneurs, childcare founders, preschool owners, consultants, and financial analysts turn an early childhood e... read more
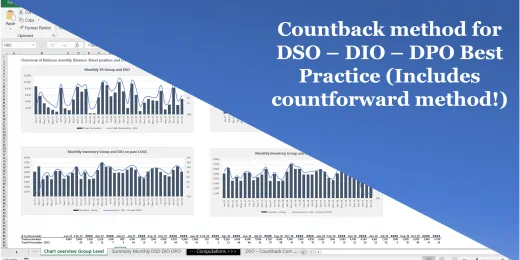
The right way to compute DSO DIO DPO - Using the countback method, fully automated!

Toll Road Build and Operate financial model is a project finance model for construction and operations of a toll concession

The forestry financial model is a comprehensive financial model in Excel which allows to calculate the financial viability (IRR, NPV, ROI multiple) f... read more

Average rating:Submit Rating
One Excel file for this bundle of Valuation and Financial forecasting models. Storage Parks, Hotels, Commercial Office Buildings, Retail Shopping Cent... read more

Average rating:
A detailed and user friend financial model that captures 5 years of Historical + 1 Year of Budget + 5 Years of the forecast period.

Average rating:Submit Rating
Financial model presenting a development scenario for a Hotel including construction, operation, and valuation phases.

Average rating:
User-friendly 3 statement 5 year rolling financial projection Excel model for existing/startup healthcare business

A Project-Level Financial Model to assess the financial feasibility of setting up and operating a Green Hydrogen Gas Production Plant with detailed NP... read more

The Daycare Center Financial Model helps entrepreneurs, childcare founders, consultants, analysts, and business owners turn a daycare concept into a s... read more


This financial report explained the trend in quantity sold, sales per day, number of pax, average spending per person, and customer turnover for the r... read more

Financial Model providing a dynamic up to 10-year financial forecast for a startup Manufacturing Company.

The Social Media Agency Financial Model helps users turn an agency concept, launch plan, or growth strategy into a structured five-year financial fore... read more

The Private Equity Acquisition Model provides a business valuation of a target company for investment. The Private Equity Acquisition Model allows for... read more
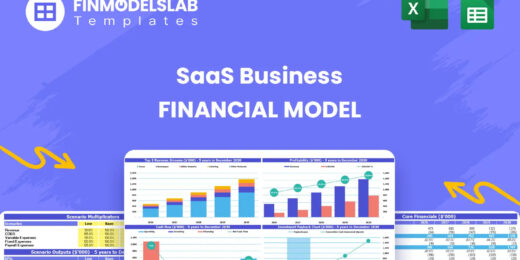
The SaaS Business Financial Model helps founders, entrepreneurs, consultants, analysts, and business owners build a structured financial plan for a so... read more

Average rating:Submit Rating
A fundamental and professional budget / business plan

Average rating:Submit Rating
Financial Model providing a dynamic up to 10-year financial forecast for a startup or existing Car Wash Business.
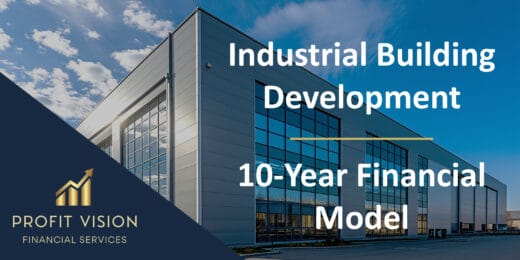
Financial model presenting a development scenario for a Multi-Tenant Industrial Building including construction, operation, and valuation phases.
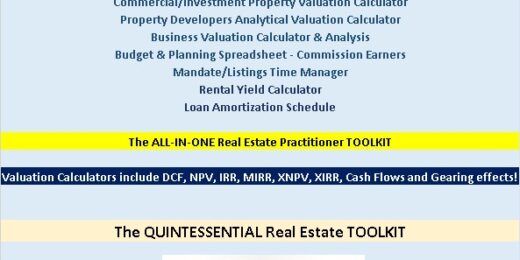
Professional Realtors need a professional Toolkit which allows them to operate at a higher level. The ALL-IN-ONE Quintessential Real Estate Toolkit in... read more

This banana tree plantation financial model serves as a financial planning tool for evaluating a banana farm's financial feasibility and fundraising p... read more
Average rating:
Highly versatile and user-friendly Excel model for the preparation of a rolling 3 statement (Income Statement, Balance Sheet and Cash flow Statement) ... read more

This detailed, yet easy to use three statement financial model will allow you to calculate your business' profit and loss, build a balance sheet and c... read more

The Fruit Farming Financial Model helps users turn a fruit farm concept, orchard expansion, or agricultural investment plan into a structured financia... read more
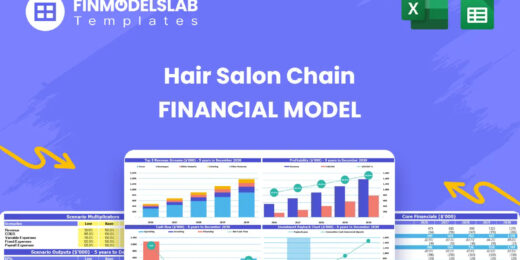
The Hair Salon Chain Financial Model helps entrepreneurs, salon owners, consultants, analysts, and business planners create a structured financial for... read more
You might also like:
- 10 Tips to Develop a First Class Business Valuation Report
- 10 Main Elements of a Business Plan
- Estimating Terminal Value in DCF
- Calculating Revenue Growth Rate: A Key Metric for Business Success
- Financial Statements – Definition, Uses, Contents and Templates
- Financial Ratios Analysis and Its Importance
- Understanding the Debt Service Coverage Ratio: An Essential Metric for Financial Analysis
- How to Make Smart Decisions with 6 Key Financial Metrics?
- 5 Steps to Create a Drop Down List Using Data Validation in Excel
- Financial Modeling with Excel: Fundraising Plan Tactics
- Commercial Real Estate Valuation Methods: Helping Investors in Taking Informed Decisions
- Startup Restaurant Business Plan: Flavors Redefined
- Top 5 Principles of Corporate Finance
- 10 Ideas to Increase Average Revenue Per User
- Financial Model Templates Easy to Use
- How to Calculate Net Present Value (NPV)?
- How Can You Make Your Startup Successful?
- Financial Modeling for Startups and Small Businesses
- Debt Amortization Table
- SaaS Business Financial Model

eFinancialModels Team
Content Manager
The eFinancialModels Team showcases the combined expertise of seasoned professionals in financial modeling, valuation, and business analysis. Our goal is to share practical knowledge, insights, and best practices drawn from real-world experience across industries such as renewable energy, real estate, SaaS, manufacturing, and finance.
Through our articles and templates, we aim to make complex financial modeling concepts accessible and actionable—helping entrepreneurs, investors, and finance professionals make smarter business decisions.


