
0 ITEMS

Bed And Breakfast Financial Model Excel Template
The Bed and Breakfast Financial Model is a ready-to-use financial model template built to help entrepreneurs, inn owners, consultants, analysts, and business planners evaluate the financial potential of a B&B before launch, acquisition, renovation, or expansion. Instead of starting with a blank spreadsheet, users get a structured model that connects room revenue, ancillary income, startup costs, operating expenses, payroll, cash flow, and profitability in one editable planning tool. It is designed to help turn assumptions about occupancy, average daily rate, room mix, events, bar sales, spa packages, staffing, and seasonal demand into a clear five-year financial forecast. This template is especially useful for people preparing business plans, lender packages, investor presentations, internal budgets, or feasibility studies for a bed and breakfast, guesthouse, boutique inn, or small hospitality property. The model helps users organize key revenue assumptions, estimate the capital required to open, forecast recurring operating expenses, and understand how profitability may develop as occupancy improves over time. It also supports practical decision-making by showing the relationship between pricing, booking volume, direct versus third-party sales, cost of goods sold, staff costs, and cash flow availability. The Bed and Breakfast Financial Model includes editable assumptions and automated calculations so users can adapt the forecast to their own property, location, room count, pricing strategy, and growth plan. It helps users test different business outcomes, review projected financial statements, assess break-even timing, evaluate funding requirements, and communicate the business case in a professional format. Whether you are validating a new B&B concept, planning renovations, seeking a loan, discussing investment, or reviewing the performance outlook of an existing inn, this template provides a practical framework for financial planning and profitability analysis. By bringing together dashboards, scenario planning, investor metrics, revenue detail, bank-ready reports, KPI tracking, startup cost planning, and break-even analysis, the template helps users move from rough estimates to a more disciplined financial planning process. It is fully customizable, compatible with Excel and Google Sheets, and designed for non-financial users as well as experienced advisors. The result is a time-saving, investor-ready tool that supports better budgeting, clearer forecasting, and more confident decision-making for a bed and breakfast business.
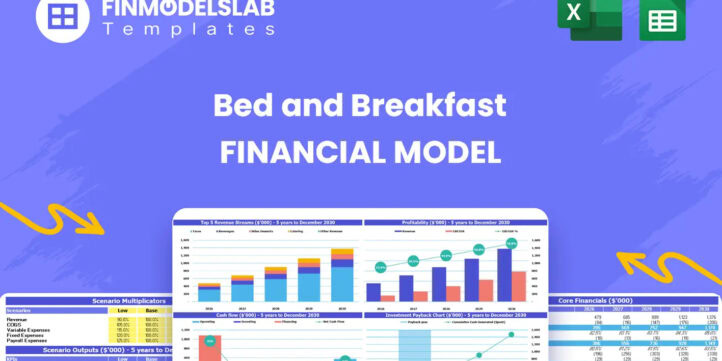


Financial Model Overview
The Bed and Breakfast Financial Model is a structured financial model template created for planning, launching, funding, or expanding a bed and breakfast business. A B&B has a unique financial profile because revenue depends on room capacity, occupancy, average daily rate, seasonal travel patterns, booking channels, guest services, and add-on experiences, while costs include property operations, housekeeping, breakfast ingredients, staffing, utilities, maintenance, commissions, insurance, marketing, and capital improvements. This template brings those drivers together in one editable workbook so entrepreneurs, owners, consultants, analysts, and business plan writers can estimate revenue, startup investment, operating expenses, cash flow, profitability, funding needs, and investor returns without building a model from scratch. It is designed to support practical decision-making, lender discussions, investor presentations, and internal planning by converting assumptions into organized financial projections.
All-in-One Dashboard
The all-in-one dashboard gives users a central view of the most important inputs and outputs in the Bed and Breakfast Financial Model. This section is useful because it brings together the core assumptions that drive the forecast, such as occupancy expectations, average daily rate, room capacity, operating cost assumptions, staffing levels, startup investment, and financing inputs, while also summarizing key outputs such as revenue, EBITDA, net income, cash balance, funding needs, and profitability indicators. For a bed and breakfast operator, the dashboard helps connect everyday business decisions with financial results, making it easier to understand how a change in room pricing, occupancy, cost structure, or launch budget affects the overall forecast. It also creates a convenient starting point for reviewing the model with partners, lenders, investors, or advisors because users can see the financial story at a glance before moving into detailed schedules. Instead of searching across separate tabs for important numbers, the dashboard provides a practical command center for financial planning, budgeting, and decision-making.
Low, Base, and High Scenario Analysis
The Low, Base, and High scenario analysis section helps users evaluate how the bed and breakfast may perform under different business conditions. A B&B can be affected by seasonality, local tourism trends, competition, travel demand, pricing strategy, renovation timing, and booking channel performance, so a single forecast is often not enough for serious planning. This component allows users to compare conservative, expected, and optimistic cases by adjusting key assumptions such as occupancy rate, average daily rate, ancillary service revenue, food and beverage margins, OTA commissions, payroll levels, and fixed operating expenses. The outputs help users see how each scenario affects revenue, cash flow, profitability, funding requirements, and return potential. This is especially valuable when preparing a loan application or investment discussion because stakeholders often want to understand both downside risk and upside opportunity. By testing multiple outcomes, users can make more informed decisions about pricing, staffing, marketing spend, capital investment, and cash reserves before committing resources to the business.
Professional Charts
The professional charts section turns financial projections into visual reports that are easier to understand, present, and discuss. A bed and breakfast financial plan often contains many detailed numbers, including monthly revenue, occupancy trends, operating expenses, cash flow, profitability, and return metrics, and charts help translate those figures into a clearer story. This component may visualize revenue growth by year, profitability progression, expense categories, cash balance movement, EBITDA improvement, revenue mix, or other performance trends that matter to owners, lenders, and investors. The inputs come from the connected forecast schedules, which means the charts update as assumptions are changed. This makes the section useful for presentations, business plans, stakeholder updates, and internal management reviews. Rather than relying only on rows of financial data, users can show how the B&B is expected to ramp up, when margins improve, where costs are concentrated, and how cash flow develops over time. The visual format supports faster decision-making and gives the financial model a more polished, professional appearance.
ROE Components and DuPont Analysis
The ROE components section uses DuPont-style analysis to help users understand what is driving return on equity in the bed and breakfast business. Return on equity is an important metric for owners and investors because it shows how effectively the business is expected to generate profit from the capital invested. This component breaks the return profile into underlying drivers, such as profitability, asset efficiency, and leverage, allowing users to see whether projected returns are coming from strong margins, efficient use of property and equipment, or the impact of financing structure. Inputs may include net income, revenue, total assets, equity investment, debt levels, and balance sheet assumptions, while outputs help explain changes in ROE over time. For a B&B, this is useful because the business is often capital-intensive, with significant upfront investment in property improvements, furnishings, systems, and working capital. By reviewing ROE components, users can evaluate whether planned renovations, pricing decisions, occupancy improvements, or financing choices are contributing to stronger investor returns and long-term financial performance.
Revenue Inputs
The revenue inputs section is where users build the commercial assumptions behind the bed and breakfast forecast. This component helps estimate income by capturing the key drivers of B&B revenue, including room types, available room-nights, occupancy rates, weekday and weekend pricing, average daily rate, seasonality, and ancillary services. Users can adjust assumptions for different suites, guest packages, bar sales, event fees, spa services, parking, or other add-on revenue streams that fit their property. The model then uses these inputs to calculate projected revenue over time, helping users understand how pricing, room mix, and booking volume affect total sales. This section is essential for realistic planning because even small changes in occupancy or average daily rate can materially affect cash flow and profitability. It also supports market research and business plan preparation by allowing users to document assumptions clearly and compare them against local hospitality conditions. For founders and advisors, the revenue inputs provide a transparent foundation for testing whether the B&B concept can generate enough sales to support its operating costs and investment needs.
Bank-Ready Reports
The bank-ready reports section organizes financial outputs into a format that is suitable for lenders, funding discussions, and formal business planning. Banks and financing partners typically want to see clear projections, realistic assumptions, repayment capacity, cash flow availability, profitability trends, and the capital required to launch or expand the business. This component helps users present projected profit and loss, cash flow, balance sheet figures, debt assumptions, key metrics, and summary financial results in a structured way. For a bed and breakfast, these reports are especially important because lenders may need to evaluate renovation costs, property-related investment, operating ramp-up, seasonal cash flow, and the borrower’s ability to service debt. The model helps connect assumptions to outputs so the financial case can be reviewed more easily. Users can use these reports when applying for a business loan, discussing property improvements, preparing a funding memo, or sharing projections with accountants and advisors. The purpose is not only to make the numbers look professional, but also to make the forecast easier to audit, explain, and defend.
Revenue Breakdown
The revenue breakdown section provides a detailed view of how total income is generated across the bed and breakfast’s different revenue streams. Instead of showing only one combined sales figure, this component separates revenue into meaningful categories such as room rentals, suite types, weekday stays, weekend stays, events, bar sales, spa packages, parking, and other guest services. Inputs may include room count, number of available nights, expected occupancy, price by room type, ancillary purchase rates, event volume, and service pricing. Outputs help users see which activities contribute most to revenue and which areas may offer the greatest opportunity for growth. This is valuable for decision-making because a B&B can improve profitability not only by increasing occupancy, but also by improving the revenue mix through higher-margin add-ons, direct bookings, premium packages, and local events. The revenue breakdown helps users compare core room income against ancillary income, assess pricing strategies, and identify whether the business is too dependent on a single revenue source. It also makes the forecast more credible by showing exactly how sales assumptions are built.
KPI Dashboard
The KPI dashboard tracks the performance metrics that matter most for a bed and breakfast business. Key performance indicators may include occupancy rate, average daily rate, revenue per available room, total revenue, gross margin, EBITDA margin, cash balance, break-even progress, payroll as a percentage of revenue, cost of goods sold, and return metrics. This component helps users monitor whether the business is performing in line with expectations and compare projected results against hospitality benchmarks or internal targets. Inputs flow from the forecast assumptions and operating schedules, while outputs create a concise performance view that supports management decisions and stakeholder communication. For B&B owners, KPI tracking is useful because operational details can quickly affect financial results, including booking mix, seasonal demand, direct versus OTA reservations, food costs, staffing efficiency, and guest service revenue. The dashboard makes it easier to identify issues early, such as weaker occupancy, rising expenses, declining margins, or cash pressure. It also helps present the business more professionally by focusing attention on the metrics investors, lenders, and operators commonly review.
Startup Cost and Funding Requirements
The startup cost and funding requirements section helps users estimate the initial investment needed to open, acquire, renovate, or relaunch a bed and breakfast. A B&B often requires substantial upfront capital before the first guest is served, including building renovation, room furnishings, kitchen equipment, HVAC upgrades, booking systems, licenses, deposits, signage, pre-opening marketing, insurance, professional fees, initial inventory, and working capital. This component allows users to itemize those costs and calculate the total funding requirement needed to reach opening day and support the early ramp-up period. The outputs help users understand how much owner equity, bank debt, investor capital, or other financing may be required. This is useful for planning because underestimating startup costs can create cash shortages before the business has stable occupancy. It also strengthens loan and investor discussions by showing that the launch budget has been organized and considered in detail. Users can adjust each cost item to match their property, renovation scope, location, and service level, making the template suitable for both small guesthouses and more premium inn concepts.
Break-Even Analysis
The break-even analysis section helps users identify when the bed and breakfast is expected to generate enough revenue to cover its fixed and variable costs. This component uses assumptions from the revenue forecast, cost of goods sold, payroll plan, operating expenses, startup investment, and cash flow schedules to estimate the point at which the business moves from loss-making to profitable operations. Inputs may include occupancy rate, room pricing, ancillary revenue, food and beverage costs, commissions, utilities, rent or mortgage-related costs, staffing, insurance, maintenance, and marketing spend. Outputs may include the break-even month, revenue required to break even, occupancy level required to cover costs, and the relationship between cash burn and profitability timing. This is important for a bed and breakfast because the business may start with lower occupancy while it builds reviews, local awareness, and repeat bookings. Knowing the break-even point helps users plan launch funding, set booking targets, manage pricing, control expenses, and decide how much cash reserve is needed. It also gives lenders and investors a clear milestone for evaluating the path to sustainable profitability.
File types:
Excel – Single-User: .xlsx
Excel – Multi-User: .xlsx
Similar ProductsOther customers were also interested in...



 Andreas
Airbnb Financial Model
Air BnB Financial Model Template presents the business case of the purchase of up to 5 properties wi... Read more

 Giorgos
Short Term Rentals (Airbnb) Financial Model –...
A short-term rental is a furnished living space available for short periods of time, from a few days... Read more
 HenrySheykin
Vacation Rentals Hotel Financial Model Excel Templ...
The Vacation Rental Financial Model helps users turn a short-term rental concept, property managemen... Read more
Condo Hotel Financial Model Excel Template
The Condo Hotel Financial Model helps users turn a condo hotel concept, launch plan, or investment o... Read more

 anthony
Hotel/Guesthouse/Resort Development Model and Valu...
This Hotel / Holiday Resort Development Model will take you through a 20-year period of Three Statem... Read more

Hotel Acquisition – 10 Year Financial Model
10-Year financial model for a hotel acquisition projecting revenue, operating expenses, and cash flo... Read more
Real Estate Development Bundle
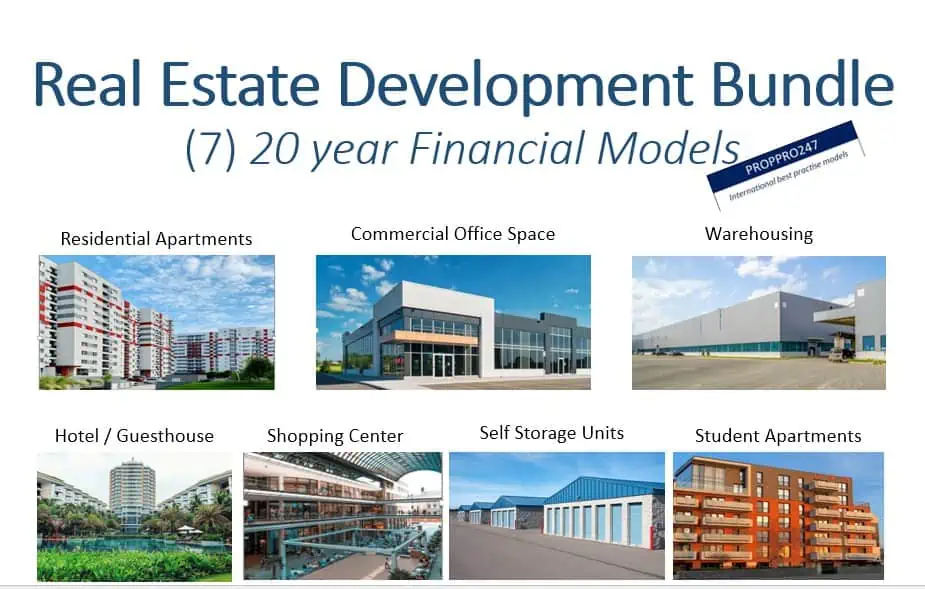
This Real Estate Development Bundle is a collection of real estate calculators or tools in MS Excel ... Read more

 D'Errico Financial S...
Boutique Hotel Financial Model Template in Excel
The Boutique Hotel Financial Model provides a 5-year annual forecast along with a month-by-month for... Read more

Real Estate Development Financial Models Bundle
A collection of seven Real Estate Development Financial Models offered at a discounted price you can... Read more

Real Estate Acquisition Financial Models Bundle
A collection of six Real Estate Development Financial Models offered at a discounted price you can�... Read more
You must log in to submit a review.