
0 ITEMS

Vacation Rentals Hotel Financial Model Excel Template
The Vacation Rental Financial Model helps users turn a short-term rental concept, property management plan, or Airbnb-style portfolio strategy into a structured five-year financial forecast. Instead of building formulas from scratch, buyers can enter key assumptions such as nightly rates, occupancy levels, property counts, operating costs, revenue share, ancillary services, and staffing needs, then review the financial impact through connected projections. It is designed to support financial planning for vacation rental operators, short-term rental founders, real estate entrepreneurs, consultants, analysts, and business owners preparing business plans, funding materials, or internal growth strategies. This financial model template is especially useful for evaluating the economics of multiple property types, including studios, apartments, homes, and luxury villas. Users can model core rental income alongside guest fees and add-on services, then connect those revenue assumptions to direct costs, payroll, marketing, software, insurance, maintenance, and other operating expenses. The model helps clarify how much revenue the business may generate, how much it may cost to launch, what level of occupancy is required, and whether the projected profit margins are strong enough to support a scalable vacation rental business. The template also supports practical decision-making by showing projected cash flow, profitability, break-even timing, payback period, and investor return metrics. Entrepreneurs can use it to test low, base, and high scenarios, compare assumptions against operating targets, and understand how changes in ADR, occupancy, property growth, or cost structure affect the business. This makes it valuable for planning a new launch, expanding an existing short-term rental operation, reviewing funding needs, or preparing lender-ready and investor-ready financial summaries. Built for Excel and Google Sheets, the Vacation Rental Financial Model is editable, presentation-friendly, and structured for users who want a professional financial planning tool without hiring a consultant. It brings together revenue modeling, startup costs, operating expenses, payroll, cash flow, profitability, break-even analysis, and visual reporting in one ready-to-use workbook, giving users a clearer view of the risks, opportunities, and financial requirements behind their vacation rental strategy.
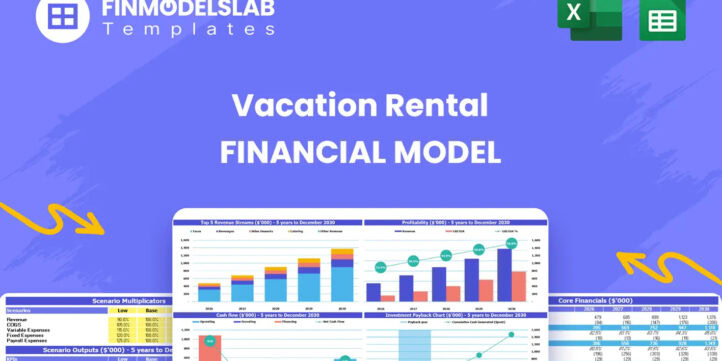


Financial Model Overview
The Vacation Rental Financial Model is a ready-to-use financial model template built for planning, analyzing, and presenting the financial performance of a short-term rental or vacation rental management business. It gives entrepreneurs, property operators, consultants, analysts, and business owners a structured way to forecast revenue, expenses, profitability, cash flow, startup investment, and investor returns over a multi-year period. The model is designed around the key drivers of the vacation rental business, including property count, property type, occupancy, average daily rate, weekday and weekend pricing, guest fees, ancillary services, revenue share agreements, operating expenses, and capital expenditures. By connecting these assumptions into a complete forecast, the template helps users understand whether their vacation rental strategy can generate sustainable cash flow, reach profitability, support expansion, and meet the expectations of banks, investors, or internal stakeholders.
All-in-One Dashboard
The all-in-one dashboard brings the most important inputs and outputs into a single planning view so users can quickly understand how the vacation rental business is expected to perform. This section is useful because it connects core operating assumptions such as rates, occupancy, property count, revenue mix, operating costs, and investment requirements with key outputs such as total revenue, EBITDA, cash flow, break-even timing, payback period, and return metrics. For a vacation rental operator, this type of dashboard reduces the need to search through multiple tabs to understand the business case. Users can adjust assumptions, review the resulting performance, and identify whether the model supports the intended strategy. It is especially helpful for founders preparing a business plan, consultants building financial projections for clients, and owners who need a concise summary for lenders or partners. The dashboard also supports decision-making by showing how operational changes translate into financial outcomes, making it easier to compare growth plans, pricing strategies, and investment scenarios before committing capital.
Low, Base, and High Scenario Analysis
The low, base, and high scenario analysis section helps users evaluate how the vacation rental business could perform under different market and operating conditions. Instead of relying on a single forecast, users can compare conservative, expected, and optimistic cases by changing assumptions such as occupancy rates, average daily rate, property growth, marketing spend, revenue share costs, staffing levels, and ancillary service adoption. This is particularly valuable in short-term rentals because revenue can be affected by seasonality, local competition, travel demand, platform algorithms, regulations, and economic cycles. A low scenario can help users stress-test the business and understand downside risk, while a high scenario can show the upside potential of stronger pricing, higher occupancy, or faster portfolio expansion. The base case can serve as the most realistic planning view for budgets, funding discussions, and operating targets. This component helps users make better decisions by showing the range of possible outcomes and by preparing them for both cash flow pressure and growth opportunities.
Professional Charts
The professional charts section translates the financial forecast into visual outputs that are easier to understand, present, and discuss with stakeholders. Charts can show revenue growth, EBITDA trends, cash flow movement, occupancy progression, profit margin changes, cost structure, and other key financial metrics over time. For a vacation rental financial plan, visual reporting is useful because many important decisions depend on trends rather than isolated numbers. Users can see whether revenue is scaling faster than operating expenses, whether margins improve as the property portfolio grows, and whether cash reserves remain strong throughout the forecast period. These charts are also valuable for investor presentations, lender meetings, board updates, and internal planning sessions because they simplify complex spreadsheet outputs into clear, presentation-ready visuals. Instead of explaining every line of the model manually, users can use charts to communicate the financial story of the business, highlight growth potential, and support the credibility of the projections with organized and professional reporting.
ROE Components and DuPont Analysis
The ROE components and DuPont analysis section helps users understand what is driving return on equity within the vacation rental business. Rather than looking only at a single return percentage, this component breaks performance into underlying drivers such as profitability, asset efficiency, and leverage. This is useful for evaluating whether returns are being generated by healthy operating margins, efficient use of assets and capital, or financing structure. For a vacation rental operator, the analysis can help clarify whether improvements should come from increasing ADR, improving occupancy, reducing operating costs, expanding higher-margin ancillary services, or optimizing capital investment. Investors and financial stakeholders often want to understand not only whether returns are attractive, but why those returns exist and how sustainable they may be. By including ROE components, the model supports deeper investment analysis and helps users identify which parts of the business model create value. This can improve funding discussions, strategic planning, and long-term performance management.
Revenue Inputs
The revenue inputs section is where users define the commercial assumptions that drive the vacation rental forecast. It may include the number and type of properties under management, weekday and weekend pricing, average daily rate, occupancy rates, booking volume, guest fees, ancillary services, and growth in the property portfolio over time. For this type of business, revenue planning must reflect both capacity and demand. The model allows users to connect available rental nights, expected occupancy, and pricing assumptions to projected room revenue, while also adding other income streams such as pet fees, late check-out fees, private chef services, event fees, in-home spa services, or other guest experience add-ons. This section is important because small changes in occupancy or ADR can significantly affect revenue, profitability, and cash flow. By making the assumptions editable, the template allows users to customize the forecast for different markets, property types, positioning strategies, and growth plans. It gives users a practical foundation for building a realistic short-term rental business plan.
Bank-Ready Reports
The bank-ready reports section provides structured financial outputs designed to support lender review, financing applications, and stakeholder presentations. These reports may include profit and loss projections, cash flow forecasts, balance sheet summaries, operating assumptions, debt-related metrics, and clear financial summaries that explain how the vacation rental business is expected to perform. Lenders typically want to understand whether the business can generate sufficient revenue, maintain positive cash flow, manage fixed and variable costs, and service any required debt. This component helps users present that information in a clean and organized format instead of relying on scattered calculations or informal estimates. For vacation rental founders seeking loans, property expansion financing, working capital, or investor-backed growth, bank-ready reporting can make the financial plan more credible and easier to review. It also helps business owners communicate their assumptions transparently, showing how pricing, occupancy, costs, and investment needs combine to create the projected financial results.
Revenue Breakdown
The revenue breakdown section gives users a detailed view of the different income streams within the vacation rental business. Instead of treating all revenue as one total number, the model separates major sources such as room revenue by property type, ancillary services, guest fees, and other add-on income. This is valuable because different revenue streams may have different margins, growth rates, and operational requirements. For example, rental income from studios, one-bedroom apartments, two-bedroom homes, and luxury villas may vary based on capacity, pricing, occupancy, and target guest segment. Ancillary services such as private chef experiences, spa services, event fees, pet fees, and late check-out fees may add high-margin income that improves overall profitability. A detailed revenue breakdown helps users identify which property types or services contribute the most to sales and which areas may deserve more marketing attention. It also supports pricing strategy, service design, capacity planning, and investor communication by showing the financial role of each revenue stream within the overall business model.
KPI Dashboard
The KPI dashboard focuses on the operational and financial metrics that matter most for tracking a vacation rental business. It can include indicators such as occupancy rate, average daily rate, revenue per available night, gross revenue, EBITDA, EBITDA margin, cash balance, return metrics, payback period, property growth, and cost ratios. This section is useful because vacation rental performance depends on both financial discipline and operational execution. A business may generate strong bookings but still underperform if costs rise too quickly, occupancy falls below target, or revenue share agreements reduce margins. The KPI dashboard helps users monitor performance in a concise format, compare results against assumptions, and identify areas that need attention. It is also useful for stakeholder reporting because it presents the health of the business in a way that is easier to digest than full financial statements. For founders, managers, and analysts, this component supports ongoing decision-making by turning the forecast into a performance management tool.
Startup Cost and Capital Expenditure Planning
The startup cost and capital expenditure planning section helps users estimate the upfront investment required to launch or expand the vacation rental business. This may include initial property furnishings, luxury furnishing upgrades, vehicle purchases, website platform development, booking technology, deposits, licenses, legal setup, branding, pre-launch marketing, equipment, and initial working capital. For a short-term rental business, startup costs can be substantial because guest experience depends heavily on the quality of furnishings, property readiness, operational systems, and service infrastructure. This component separates one-time launch expenses from ongoing operating costs so users can understand how much capital is needed before revenue begins and how future reinvestment may affect cash flow. It is valuable for funding preparation because banks and investors often want to see a clear use of funds and a realistic estimate of capital needs. By organizing startup costs and capital expenditures, the model helps users avoid underfunding the business and gives them a clearer view of the total investment required to execute the plan.
Break-Even and Payback Analysis
The break-even and payback analysis section helps users identify when the vacation rental business is expected to cover its costs and recover its initial investment. Break-even analysis compares projected revenue with direct costs, operating expenses, payroll, and other required spending to determine the point at which the business becomes profitable. Payback analysis looks at how long it takes for cumulative cash flow to repay the original investment. These outputs are especially useful for entrepreneurs and investors because they show the timing of financial viability, not just the final profit number. In a vacation rental model, break-even can be influenced by occupancy, ADR, property count, revenue share agreements, staffing, marketing costs, and the level of upfront investment. Users can adjust these assumptions to see how quickly the business can move from launch to profitability and how sensitive the payback period is to changes in pricing or demand. This component supports funding decisions, launch planning, risk assessment, and investor conversations by making the path to profitability clear and measurable.
File types:
Excel – Single-User: .xlsx
Excel – Multi-User: .xlsx
Similar ProductsOther customers were also interested in...



 Giorgos
Real Estate Development Financial Models Bundle
A collection of seven Real Estate Development Financial Models offered at a discounted price you can... Read more
 HenrySheykin
Condo Hotel Financial Model Excel Template
The Condo Hotel Financial Model helps users turn a condo hotel concept, launch plan, or investment o... Read more
 anthony
Real Estate Development Bundle
This Real Estate Development Bundle is a collection of real estate calculators or tools in MS Excel ... Read more

Real Estate Acquisition Financial Models Bundle
A collection of six Real Estate Development Financial Models offered at a discounted price you can�... Read more

Serviced Apartments Financial Model Excel Template
The Serviced Apartments Financial Model is a ready-to-use financial model template built for the ope... Read more
Bed And Breakfast Financial Model Excel Template
The Bed and Breakfast Financial Model is a ready-to-use financial model template built to help entre... Read more

 Andreas
Airbnb Financial Model
Air BnB Financial Model Template presents the business case of the purchase of up to 5 properties wi... Read more

Short Term Rentals (Airbnb) Financial Model –...
A short-term rental is a furnished living space available for short periods of time, from a few days... Read more

Hotel/Guesthouse/Resort Development Model and Valu...
This Hotel / Holiday Resort Development Model will take you through a 20-year period of Three Statem... Read more
You must log in to submit a review.