
0 ITEMS

Clinic Financial Model Excel Template
The Healthcare Clinic Financial Model helps founders, clinic owners, consultants, analysts, and business planners turn a healthcare clinic concept into a structured financial forecast. Instead of starting from a blank spreadsheet, users can work from a ready-to-use template designed around the economics of an outpatient clinic, including patient volume, practitioner capacity, service pricing, operating expenses, payroll, startup costs, cash flow, and profitability. It provides a practical framework for estimating whether a clinic can generate enough revenue to support its cost base, fund growth, and reach sustainable financial performance. This Healthcare Clinic Financial Model Financial Model Template is useful for entrepreneurs preparing to open a new medical practice, operators evaluating an expansion, consultants building a client forecast, or founders preparing funding documents for lenders and investors. The model helps organize revenue assumptions around clinic services, practitioner utilization, treatment capacity, and pricing, while also accounting for the real costs of running a healthcare facility. Users can adjust assumptions to reflect their market, staffing plan, service mix, capital investment, and operating strategy. The template supports financial planning by connecting core business drivers to projected results. Users can evaluate startup costs, monthly operating expenses, payroll needs, cost of goods sold, profit margins, cash flow, and break-even analysis in one connected model. This makes it easier to understand how changes in patient volume, pricing, staffing, supplier costs, or reimbursement timing may affect profitability and liquidity. The model is built to help users test assumptions, compare scenarios, and make better decisions before committing capital or presenting a plan to stakeholders. Designed for practical business planning and funding preparation, the Healthcare Clinic Financial Model gives users a professional structure for building forecasts, reviewing financial statements, and communicating the financial story of the clinic. It can support loan applications, investor discussions, internal budgeting, strategic planning, and ongoing decision-making. With editable inputs, pre-built formulas, dashboard views, and presentation-ready outputs, the template saves time while helping users create a more credible, organized, and decision-ready healthcare clinic financial plan.
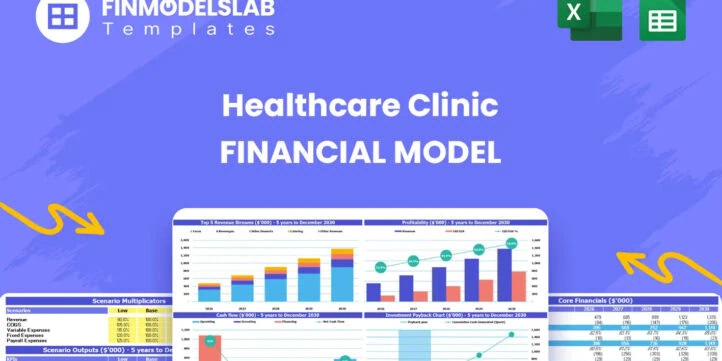


Financial Model Overview
The Healthcare Clinic Financial Model is a ready-to-use financial model template designed to help entrepreneurs, clinic owners, consultants, analysts, and business planners evaluate the financial viability of an outpatient healthcare clinic. It brings together the major financial drivers of a clinic, including practitioner capacity, patient visits, service pricing, startup investment, payroll, operating expenses, cash flow, profitability, and investor returns. A healthcare clinic has a unique cost structure because revenue depends on practitioner availability, appointment volume, utilization rates, treatment pricing, service mix, and billing efficiency, while expenses can include medical supplies, staffing, rent, systems, equipment, insurance, and administrative support. This template gives users a structured way to organize those assumptions and turn them into financial projections that can support planning, lender conversations, investor presentations, and internal decision-making. It is fully editable, compatible with Microsoft Excel and Google Sheets, and built to help users replace guesswork with a clearer financial roadmap for launching, funding, or expanding a medical practice.
All-in-one Dashboard
The all-in-one dashboard gives users a central view of the most important inputs and outputs in the Healthcare Clinic Financial Model. It is designed to summarize the clinic’s financial plan in a way that is easy to understand without reviewing every underlying worksheet. Users can enter or review core assumptions such as the number of practitioners, treatment capacity, utilization rate, average price per treatment, startup investment, operating costs, and financing assumptions, then see how those inputs flow into revenue, profit, cash flow, margins, and return metrics. This component is especially useful for founders and advisors who need a quick but structured view of the business model before moving into deeper analysis. For a healthcare clinic, the dashboard helps connect clinical capacity with financial outcomes, showing whether the practice can generate enough patient volume and service revenue to cover payroll, fixed costs, medical supplies, technology, and debt obligations. It also supports faster decision-making because users can update assumptions and immediately evaluate the impact on the clinic’s financial outlook. For presentations, the dashboard acts as a management summary that can be shared with lenders, partners, investors, or internal stakeholders to communicate the financial story in a concise and professional format.
Low Base High Scenario Analysis
The Low Base High scenario analysis component allows users to test how the healthcare clinic may perform under different operating conditions. Rather than relying on one fixed forecast, the model can compare a conservative case, a base case, and an optimistic case by adjusting assumptions such as patient volume, practitioner utilization, treatment pricing, reimbursement timing, staffing levels, and cost growth. This is important because a clinic’s financial performance can change significantly if patient demand ramps more slowly than expected, if service pricing differs from local market assumptions, or if payroll and operating expenses increase faster than planned. The scenario analysis helps users understand the range of possible outcomes for revenue, EBITDA, net income, cash flow, and funding needs. It also supports risk management by showing which assumptions have the greatest effect on profitability and liquidity. For example, a lower utilization rate may delay break-even and reduce cash reserves, while a stronger utilization ramp may improve margins and shorten the payback period. This component is useful for entrepreneurs preparing a business plan, consultants advising clients, and lenders evaluating repayment capacity because it shows that the clinic plan has been stress-tested rather than built on a single optimistic projection.
Professional Charts
The professional charts component translates the financial projections into clear visual reports that can be used for planning meetings, investor presentations, lender discussions, and internal reviews. Healthcare clinic financial projections can involve many connected figures, including revenue by service line, expense categories, cash flow trends, margins, patient volume growth, and profitability over time. Charts make those trends easier to understand by presenting the data visually instead of requiring stakeholders to interpret detailed spreadsheet outputs. This section may include views of revenue growth, EBITDA progression, profit margins, cash balances, operating costs, and key financial metrics across the forecast period. For a healthcare clinic, charts are valuable because they help users explain how practitioner capacity, utilization, and service mix translate into long-term financial performance. They also make it easier to identify trends, such as whether revenue is growing faster than expenses, whether cash flow remains stable during expansion, or whether the clinic is becoming more efficient as patient volume increases. The professional formatting helps users present a more polished and credible financial plan, especially when the model is used as part of a pitch deck, loan package, feasibility study, or board-level planning document.
ROE Components and DuPont Analysis
The ROE components and DuPont analysis section helps users understand what is driving return on equity in the Healthcare Clinic Financial Model. Return on equity is an important investor and owner metric because it shows how effectively the clinic uses shareholder capital to generate profit. A DuPont-style analysis breaks this return into underlying drivers, such as profitability, asset efficiency, and financial leverage, making it easier to see whether returns are being created through strong margins, efficient use of clinic assets, or the capital structure of the business. For a healthcare clinic, this can be especially useful because the business may require meaningful upfront investment in build-out, equipment, technology, and working capital before it reaches full capacity. Users can review how net income, revenue growth, asset investment, and financing decisions influence overall equity returns across the forecast period. This component is helpful for investors, founders, and financial analysts who want to go beyond simple profit figures and evaluate the quality of the clinic’s returns. It can also support strategic decisions about expansion, debt financing, owner contributions, and reinvestment by showing how different financial choices affect the clinic’s ability to generate value for equity holders.
Revenue Inputs
The revenue inputs section is one of the most important parts of the Healthcare Clinic Financial Model because it defines how the clinic earns money. This component allows users to build revenue assumptions around key healthcare operating drivers, such as the number of practitioners, monthly treatment capacity, utilization rates, appointment volume, service pricing, and the timing of growth. A clinic may offer multiple services, such as general practitioner consultations, pediatric visits, dermatology services, physiotherapy sessions, or other specialty treatments, and each stream can have its own pricing and volume assumptions. By separating these drivers, users can create a more realistic revenue forecast than a simple top-down estimate. The section helps answer practical planning questions, such as how many patient visits are needed each month, how quickly practitioners must reach target utilization, and how changes in pricing or service mix affect total sales. It is also useful for testing operational capacity because revenue is tied to available practitioner hours rather than unlimited demand. For business planning and funding, the revenue inputs section creates a transparent basis for the forecast, allowing lenders, investors, and internal stakeholders to understand exactly where projected clinic income comes from and which assumptions matter most.
Bank-Ready Reports
The bank-ready reports component organizes the financial outputs in a format suitable for lenders, investors, advisors, and other stakeholders who need to evaluate the clinic’s financial strength. A lender will typically want to review startup costs, revenue assumptions, profit and loss projections, cash flow forecasts, repayment capacity, and break-even timing before considering financing. This section helps present those outputs in a clear and structured way, reducing the time required to prepare a professional funding package. The reports may include projected income statements, cash flow statements, balance sheet summaries, profitability metrics, capital requirements, and key ratios that help stakeholders assess the business. For a healthcare clinic, bank-ready reporting is valuable because the startup may involve significant upfront spending on renovation, diagnostic equipment, EHR systems, IT infrastructure, medical supplies, licenses, and working capital. The reports help show whether the clinic can support those initial investments and still maintain adequate liquidity as operations ramp up. This component supports loan applications, investor discussions, partner reviews, and internal approvals by giving users a more complete financial picture than a basic budget. It also helps communicate the plan in a lender-friendly way, showing how assumptions connect to projected results and funding needs.
Revenue Breakdown
The revenue breakdown component provides a detailed view of how each service line contributes to the clinic’s total revenue. Instead of showing only one consolidated sales figure, this section helps users analyze revenue by category, such as primary care consultations, pediatric visits, dermatology services, physiotherapy sessions, or other clinical offerings. Users can adjust assumptions for price, patient volume, utilization, capacity, practitioner count, and growth timing for each revenue stream, then review how each service contributes to overall sales. This is useful because not every clinic service has the same margin, demand pattern, capacity requirement, or staffing need. A detailed revenue breakdown can help identify which services are likely to drive growth, which may require additional practitioners or equipment, and which could improve profitability if marketed or priced differently. For planning, it helps users evaluate the impact of launching new services, increasing specialist capacity, or shifting the service mix toward higher-margin treatments. For funding and stakeholder communication, the revenue breakdown makes the forecast more credible because it shows the underlying composition of sales rather than presenting revenue as a single unexplained number. It also supports operational decision-making by linking clinical strategy with financial performance.
KPI Dashboard
The KPI dashboard component tracks the key performance indicators that matter most for a healthcare clinic. While financial statements show the overall results, KPIs help users understand the operational drivers behind those results. This section may monitor metrics such as revenue per practitioner, patient volume, utilization rate, gross margin, EBITDA margin, cash balance, expense ratios, payback period, return on equity, and other performance benchmarks relevant to the clinic’s plan. By reviewing KPIs regularly, users can see whether the clinic is moving toward its financial goals or whether certain assumptions need to be adjusted. For example, if utilization is lower than expected, the model can help reveal the impact on revenue, profitability, and cash flow. If payroll or medical supply costs are higher than planned, the KPI dashboard can highlight margin pressure before it becomes a larger issue. This component is especially useful for ongoing management because it gives owners and operators a quick way to compare actual or projected performance against targets. It also supports investor and lender communication by presenting the clinic’s financial health in a compact, measurable format. For decision-making, the KPI dashboard helps turn the model into a management tool rather than just a one-time forecast.
Break-Even Analysis
The break-even analysis component helps users understand when the healthcare clinic is expected to cover its fixed and variable costs and begin generating profit. This is one of the most important questions for founders, lenders, and investors because it shows how much revenue the clinic must generate before the business becomes financially sustainable. The analysis may use assumptions such as patient visit volume, average treatment price, gross margin, payroll, rent, administrative expenses, medical supplies, marketing, insurance, and other operating costs to estimate the break-even point. For a healthcare clinic, break-even timing is closely linked to practitioner utilization and patient acquisition. If the clinic fills appointments faster, reaches stronger utilization, or offers higher-margin services, it may reach break-even sooner. If patient demand ramps slowly or fixed costs are too high, the break-even point may be delayed and additional working capital may be required. This component helps users evaluate whether the planned cost structure is realistic, whether pricing is sufficient, and whether the clinic has enough cash reserves to operate during the early months. It is useful for planning, budgeting, and funding conversations because it gives stakeholders a clear milestone for financial viability and helps identify the actions needed to improve the path to profitability.
Startup Cost and Funding Requirements
The startup cost and funding requirements component helps users estimate the initial capital needed to launch the healthcare clinic and prepare it for operations. A clinic can require substantial upfront investment before generating revenue, including build-out and renovation, diagnostic equipment, furniture, medical equipment, EHR system implementation, IT infrastructure, licensing, deposits, legal and professional fees, initial marketing, insurance, pre-opening payroll, medical supplies, and working capital. This section organizes those costs so users can understand the total funding requirement and avoid underestimating the cash needed before opening. It can also help separate one-time capital expenditures from ongoing operating expenses, which is important for building a realistic financial plan. For entrepreneurs and business owners, this component supports budgeting and funding strategy by showing how much capital may be needed from owner contributions, loans, investors, or other financing sources.
File types:
Excel – Single-User: .xlsx
Excel – Multi-User: .xlsx
Similar ProductsOther customers were also interested in...

 HenrySheykin
Medical Practice Financial Model Excel Template
The Medical Practice Financial Model helps users turn a clinic concept, expansion plan, or healthcar... Read more
Urgent Care Center Financial Model Excel Template
The Urgent Care Center Financial Model helps users turn a walk-in clinic concept into a structured f... Read more

Ophthalmology Financial Model Excel Template
The Ophthalmology Clinic Financial Model is a ready-to-use financial model template designed to help... Read more
Dental Practice Financial Model Excel Template
The Dental Clinic Financial Model helps users turn a dental practice concept, launch plan, or expans... Read more
Physiotherapy Financial Model Excel Template
The Physiotherapy Clinic Financial Model helps founders, clinic owners, consultants, analysts, and b... Read more
Outpatient Clinic Financial Model Excel Template
The Outpatient Clinic Financial Model helps users turn a clinic business concept into a structured, ... Read more

Gynecology Financial Model Excel Template
The Gynecology Clinic Financial Model Financial Model Template helps entrepreneurs, clinic founders,... Read more
Veterinary Financial Model Excel Template
The Veterinary Clinic Financial Model Financial Model Template helps entrepreneurs, clinic owners, c... Read more

Nutritionist Financial Model Excel Template
The Nutritionist Financial Model Financial Model Template helps turn a nutrition practice, dietitian... Read more
Dialysis Center Financial Model Excel Template
The Hemodialysis Center Financial Model helps users evaluate the financial feasibility of launching,... Read more
You must log in to submit a review.