
0 ITEMS

How to Use Excel for Financial Analysis?

Starting a cabin rental business involves more than just owning a property in a desirable location.
- Market research helps identify demand, competition, and seasonal trends in your area.
- Choosing the right location requires assessing accessibility, nearby attractions, and local regulations.
- Financial planning includes estimating startup costs and building reliable revenue projections through financial modeling.
- Effective marketing strategies, like high-quality imagery and SEO, can boost visibility and bookings.
- Providing a memorable guest experience and building relationships encourages repeat stays and positive reviews.
A strategic approach combines these elements to turn your cabin rental into a profitable and rewarding venture.
What is Financial Analysis with Excel?
Financial analysis evaluates financial statements and other key data to assess an organization’s viability, stability, profitability, and future performance. The process includes analyzing the three main financial statements and other documents to understand the company’s performance and make informed decisions. The insights gained from financial analysis are crucial for investors, management, and stakeholders to make decisions about investments, management strategies, or operational improvements.
Excel is widely considered the backbone of financial analysis due to its versatility and capacity for handling large datasets. Financial analysis with Excel enables working with vast amounts of data and provides users with a wide array of functions for summarizing and analyzing that data, making it invaluable. Excel’s array of functions, formulas, and analytical tools helps users perform budgeting, forecasting, trend analysis, and scenario planning tasks. From simple calculations like ratios to more complex tasks such as building discounted cash flow models, Excel can handle a wide range of financial analysis needs. Moreover, the ability to visualize data through charts, graphs, and dashboards enhances the ability of financial analysis with Excel to present findings clearly and effectively to stakeholders.
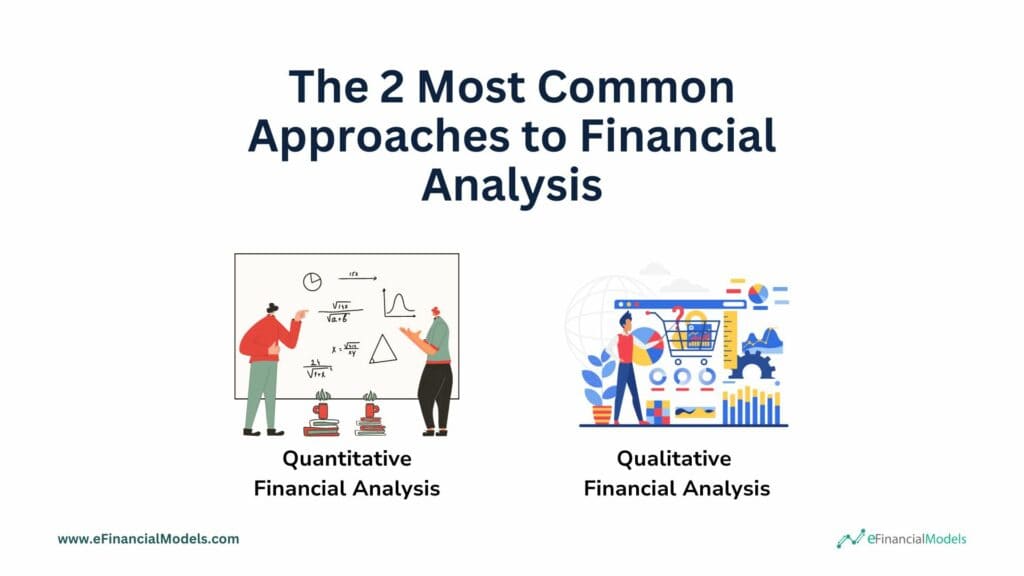
The 2 Most Common Approaches to Financial Analysis
Financial analysis typically falls into two key categories: quantitative financial analysis and qualitative financial analysis. Each method offers unique insights, with quantitative study focusing on numerical data and metrics, while qualitative analysis examines non-numerical factors like management quality and market conditions.
Quantitative Financial Analysis
Quantitative financial analysis uses numerical data and mathematical models to evaluate a company’s financial performance. It includes techniques like ratio analysis (e.g., profitability, liquidity, and solvency ratios), trend analysis, and forecasting. This method focuses on objective, measurable data in financial statements, such as revenue, expenses, and net income. By analyzing these figures, analysts can assess the financial health of an organization, predict future performance, and make investment or management decisions based on concrete data. Excel’s powerful formulas, pivot tables, and built-in financial functions make it a versatile tool for performing large-scale numerical analysis. It allows for easy manipulation of financial data, dynamic updates, and real-time modeling, which is crucial for quantitative financial analysis involving frequent calculations and scenario planning.
Qualitative Financial Analysis
Qualitative financial analysis, on the other hand, evaluates non-numerical factors that can influence a company’s financial performance, such as management quality, brand strength, competitive positioning, regulatory environment, and market conditions. It helps analysts understand the broader context behind the numbers, allowing for more informed judgments about the company’s prospects. This approach is often used alongside quantitative analysis to give a more holistic view of the organization. Excel can be customized to track qualitative data through text analysis, dashboards, and integrated notes. It also facilitates combining qualitative insights with quantitative data, offering flexibility in creating models that reflect non-numerical factors, making it an excellent tool for more holistic financial assessments.
In general, both quantitative financial analysis and qualitative financial analysis benefit from Excel’s ability to integrate, analyze, and present both numerical and non-numerical information, making it a go-to tool for financial analysts.
Why Use Excel for Financial Analysis?
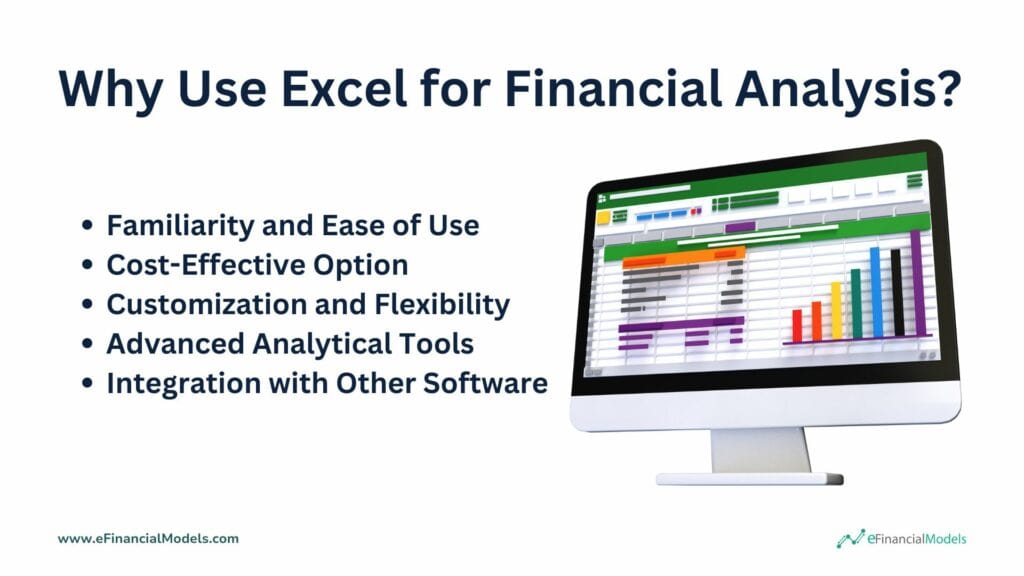
Excel for financial analysis remains a powerful tool due to its accessibility, robust functionalities, and versatility. As a universally accepted tool across industries, Excel enables seamless collaboration between teams and stakeholders, ensuring that complex financial information is easily communicated and understood. It is an indispensable resource for professionals managing financial data.
- Familiarity and Ease of Use: Many people are already familiar with Excel, making it an accessible tool for financial analysis. Its user-friendly interface, combined with the widespread availability of training resources, reduces the learning curve. Analysts, accountants, and even non-financial professionals can comfortably use Excel to analyze financial data without learning new, specialized software.
- Cost-Effective Option: Excel for financial analysis is a relatively inexpensive option compared to specialized financial software or enterprise tools. As part of Microsoft Office, many businesses already have access to it without additional costs. For small businesses, startups, or even larger enterprises, Excel for financial analysis offers powerful capabilities without requiring a significant investment in other costly financial modeling tools or systems.
- Customization and Flexibility: Excel for financial analysis is highly customizable. You can build tailored financial models, adjust formulas, and create charts to meet specific needs. This flexibility allows for personalized solutions to unique business problems, putting you in control of your cash flow projections, budgeting, or forecasting. Excel’s open framework also means it can be used across different industries and financial contexts with ease.
- Advanced Analytical Tools: Excel for financial analysis offers a wide range of advanced analytical tools, such as pivot tables, data visualization options, and complex financial formulas that make it more accessible and accurate. With features like Goal Seek, Solver, and statistical functions, users can analyze deep data, create models, and explore scenarios. This versatility makes it invaluable for financial analysts who must make highly precise data-driven decisions.Integration with Other Software: Excel integrates seamlessly with various other software tools, such as accounting programs, CRM systems, and databases. This connectivity allows users to import, export, and analyze data more efficiently, streamlining the financial analysis process. Its compatibility with other Microsoft products, as well as third-party applications, enhances its value as a tool for comprehensive financial management and analysis.

















































Master Financial Analysis with Excel: A Step-by-Step Guide
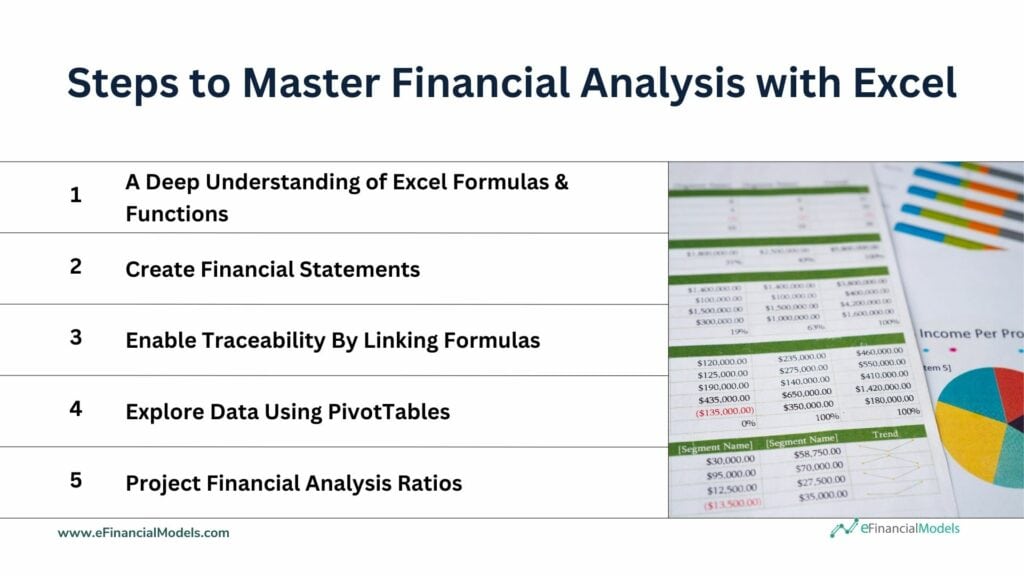
Mastering financial analysis is the heart of sound business decision-making. It can help you transform raw data into valuable insights. Here’s a step-by-step guide to mastering financial analysis and elevating your proficiency in building dynamic financial models.
Step 1 – A Deep Understanding of Excel Formulas and Functions
The first step in using Excel for financial analysis is understanding Excel formulas and functions, which are the foundation for performing complex calculations and analyses. Excel formulas allow you to perform basic arithmetic operations. At the same time, Excel functions offer a wide range of pre-built capabilities, such as summing data, finding averages, performing lookups, and calculating financial metrics. They enable users to analyze data efficiently, automate processes, and most importantly, make informed financial decisions, providing a sense of confidence and security.
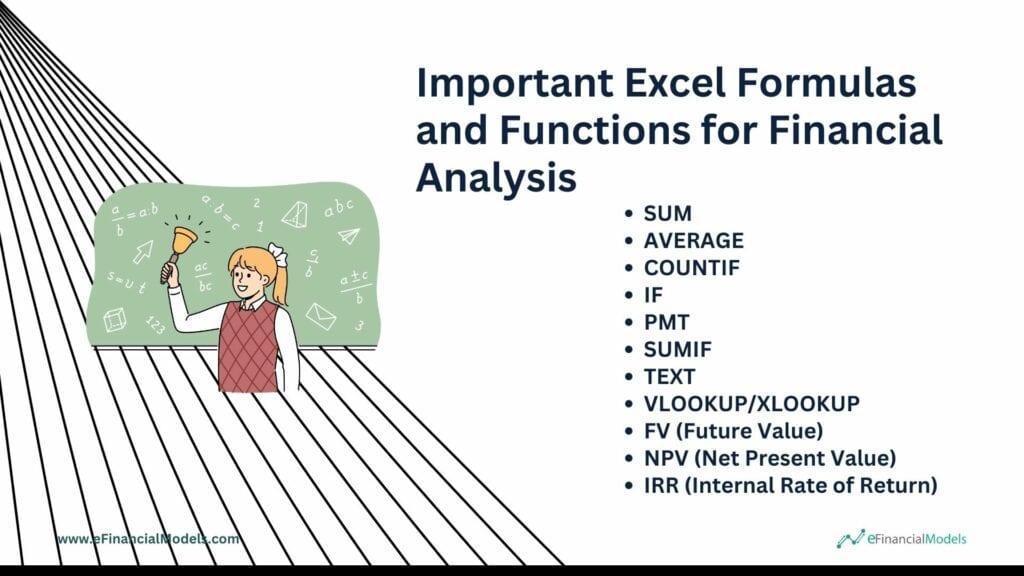
Some important Excel formulas and functions for financial analysis are:
- SUM: Adds a range of numbers.
- AVERAGE: Calculates the mean of a set of values.
- COUNTIF: Counts cells based on a condition.
- IF: Performs conditional logic.
- PMT: Calculates loan payments.
- SUMIF: Sums cells that meet specific criteria.
- TEXT: Format numbers and dates for financial reporting.
- VLOOKUP/XLOOKUP: Looks up values in a table.
- FV (Future Value): Calculates the future value of an investment.
- NPV (Net Present Value): Calculates the present value of an investment.
- IRR (Internal Rate of Return): Determines the return rate for cash flows.
Step 2 – Create Financial Statements
Using Excel for financial analysis involves creating financial statements essential for evaluating a company’s financial health. Start by organizing raw data from the company’s accounting records, such as revenue, expenses, and asset details, into structured formats like the income statement, balance sheet, and cash flow statement. Then, automate calculations for net income, equity, or cash flow projections. This step helps provide a clear financial snapshot, enabling deeper analysis and informed decision-making.
The Basis: Financial Statements
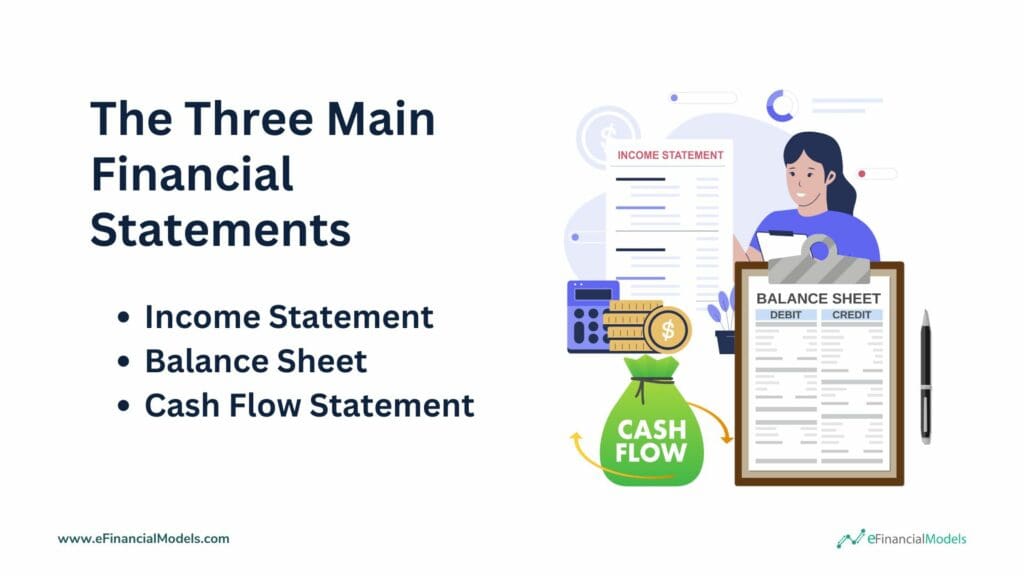
Financial analysis based on the analysis of the company’s financial statements as per the yearly period end or interim accounts. These statements are the record or report of all the financial activities and standing of a business or entity. It is created in a structured and managed manner which will make it easy to understand. There are 3 main financial statements.
Income Statement
They are also known as a statement of comprehensive income, statement of revenue and expense, P&L, or profit and loss report. This showcases the record of a company’s income, expenses, profits, or loss over some time, as well as represents the underlying profitability of a company. Of all the financial statements, the income statement is the simplest to understand because it simply shows the revenue earned by the business as well as the operating costs expended related to generating the said revenue. Another thing that differentiates the income statement from the other financial statements is that each column refers to only one period. Most income statements are built every month; some are also annual. With a cash flow or a balance sheet, you need to carry over the amount from the previous period, but with an income statement, each period starts fresh. It can also be used to compare current performance, track performance, and provide data to create a forecast or budget. To build a financial model, knowing how to create an income statement and its common format is a must. Below is the format of how an income statement is usually built. In a financial model, the income statement’s component is used for ratio analysis, such as calculating the profit margin, also known as the return on sales or gross profit ratio. Such ratios are good indicators of the business’ standing or position. The profit margin is one of the many ratios that investors and creditors use to check a company’s financial health. Dividends and returns are paid from profit, so if an investor buys shares in the company, they would like to know how likely it is to receive dividends. Banks or other creditors use the profit margin to see whether they will likely get their money back.
Balance Sheet
Also known as a statement of financial position, the balance sheet showcases the company’s assets, liabilities, and owner’s equity at a given time. The accounting equation shown on the balance sheet is perhaps the most important concept to understand regarding financial statement modeling: Assets = Liabilities + Shareholders’ Equity. The balance sheet shows a company’s financial position at any given moment. Just as with the income statement, the elements of a balance sheet need to be arranged in a specific order: the assets, liabilities, and shareholder’s equity, which are comprised of several accounts that represent the specifics of a company’s finances. However, the nature of the business and the industry will vary. It will have more components, such as different kinds of stocks, tangible and intangible assets, payables, taxes, etc. We typically see a balance sheet checker at the bottom part of a balance sheet. It is the most important part to add since it is commonplace for some errors to surface, especially for balance sheets with more components added. It will be very helpful for the user to fix why the accounts do not balance.
Cash Flow Statement
As straightforward as its name implies, it reports on all the cash flow activities, especially its operating, investing, and financing activities. It is used to understand the movements of cash, especially where it has been used or generated. Simply building a cash flow statement can help with planning your business’ cash flow such as identifying and eliminating shortfalls or overflow in cash projections. To model the cash flow, start with the opening cash balance, add income, and deduct outflows from payments. This will give you an idea of whether you have a surplus or a deficit for that period. If financing is needed, you’ll add that as an amount coming into the bank account and then calculate any repayments or interest payable going forward. As shown below, the closing balance of one period becomes the opening balance of the next, like a corkscrew cash flow modeling.
Step 3 – Enable Traceability By Linking Formulas
Enabling traceability by linking formulas ensures that all calculations and data references are connected and easy to follow. You create a dynamic and interconnected model that updates automatically when underlying data changes by linking formulas between different cells, worksheets, or workbooks. It saves time and reduces errors, as changes in one part of the model are reflected across the entire analysis. Additionally, linked formulas make it easier to audit and verify the accuracy of your work, providing a high level of transparency and making it simpler for others to understand and validate the model.
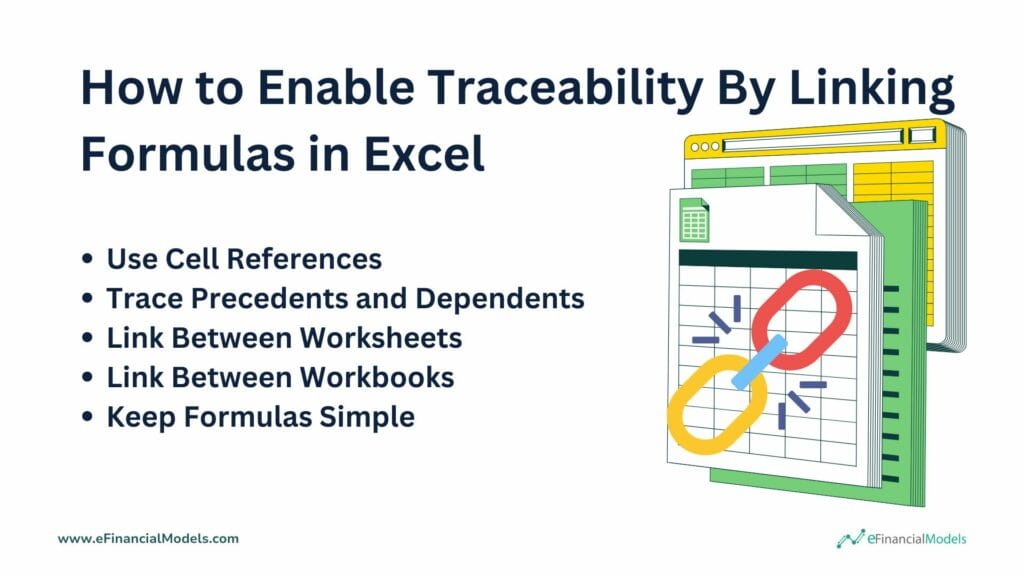
To enable traceability by linking formulas in Excel, follow these steps:
- Use cell references: Instead of manually entering values in formulas, reference other cells containing the data. For example, use =A1 + B1 rather than typing numbers directly.
- Trace precedents and dependents: Use Excel’s built-in auditing tools under the “Formulas” tab to trace precedents (cells that feed into a formula) and dependents (cells affected by a formula).
- Link between worksheets: When working with multiple worksheets, reference cells across them. For instance, if you need data from “Sheet2,” use =Sheet2!A1 in “Sheet1.”
- Link between workbooks: You can reference cells in other Excel workbooks using formulas like =[WorkbookName.xlsx]Sheet1!A1.
- Keep formulas simple: Avoid overly complex formulas to make tracking changes easier, enhancing traceability and transparency.
These steps ensure that your data remains connected, dynamic, and easy to track throughout your financial analysis.
Step 4 – Explore Data Using PivotTables
Exploring data in Excel using PivotTables is a powerful way to facilitate data grouping and insight discovery. PivotTables allow users to quickly summarize, analyze, and organize large datasets by grouping data into categories, applying filters, and calculating metrics like sums, averages, and percentages. This powerful tool empowers you to slice and dice the data in various ways to uncover trends, patterns, and key insights without altering the raw data. Using PivotTables, you can efficiently analyze complex financial datasets, highlight critical information, and make informed decisions based on your findings.
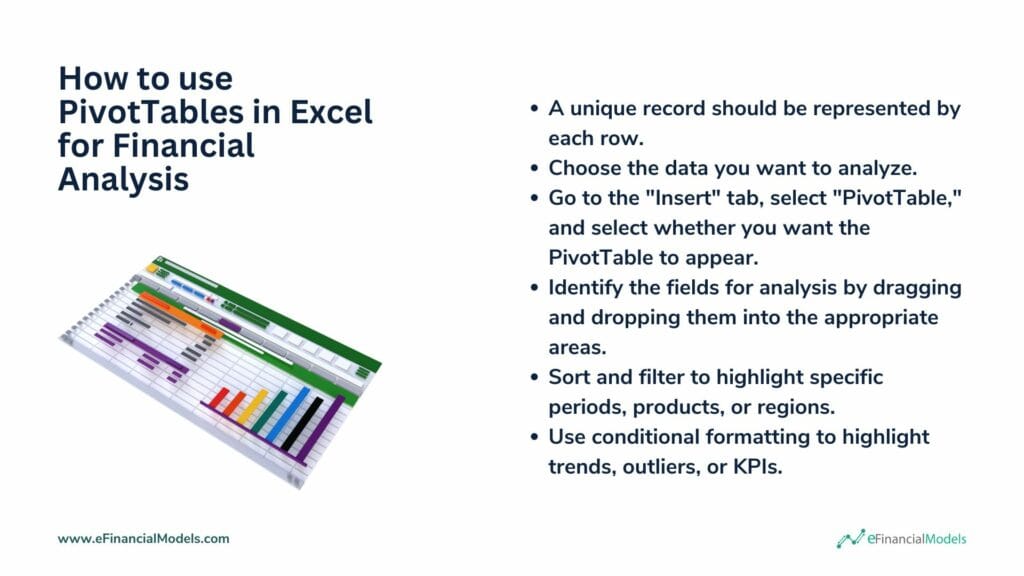
Here’s a step-by-step guide on how to use PivotTables in Excel for financial analysis:
- A unique record should be represented by each row. Ensure your financial data is organized in a structured table format with clear column headers (e.g., Date, Revenue, Expenses, Profit).
- Choose the data you want to analyze, including column headers.
- Go to the “Insert” tab, select “PivotTable,” and select whether you want the PivotTable to appear in a new or current worksheet.
- Identify the fields for analysis. Fields are the individual data points in your dataset, such as ‘Date ‘, ‘Revenue ‘, ‘Expenses ‘, and ‘Profit ‘. Drag and drop these data fields into the appropriate areas (rows, columns, values, or filters),
- Sort and filter to highlight specific periods (e.g., months, quarters), products (e.g., product categories), or regions (e.g., countries, states).
- Use conditional formatting to highlight trends, outliers, or important Key Performance Indicators (KPIs) for a quick visual analysis. To do this, select the data range you want to format, go to the ‘Home’ tab, and choose a formatting option from the ‘Conditional Formatting’ menu.










































Step 5 – Project Financial Analysis Ratios
Using Excel for financial analysis involves projecting financial analysis ratios. This step entails calculating key financial ratios based on the three main financial statements: liquidity, profitability, solvency, and stability ratios. You can use formulas to automate these calculations by linking them to the relevant data cells in Excel. They can offer insights into the company’s future financial health, helping analysts evaluate performance trends and make informed business decisions. Project financial analysis ratios mean to better understand the financial statements by investigating the company’s financial situation around the following topics:
- Liquidity – positive cash flow for immediate obligations [cash flow statement]
- Profitability – yield capability in both short and long-term [income statement]
- Solvency – debt payment capability to creditors and third parties in the long term [balance sheet]
- Stability – remain in business in the long run without losses [all financial statements]
Below, we provided some of the most relevant financial analysis ratios that can be used to analyze nearly any business, as well as their corresponding formulas for calculating such ratios.
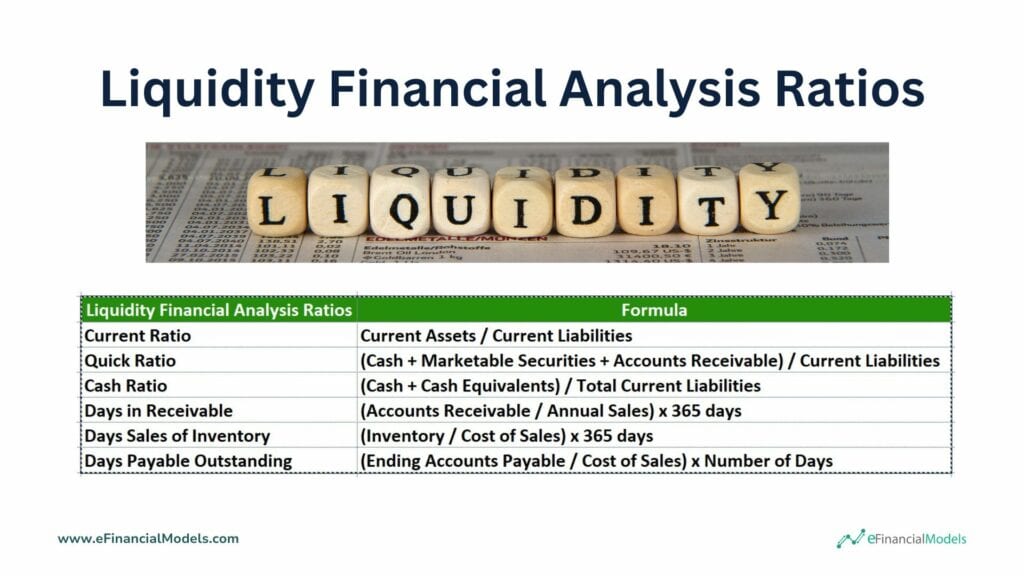
Liquidity Financial Analysis Ratios
- Current Ratio: The working capital ratio measures a company’s ability to repay short-term and long-term debts. This ratio ensures that the company can pay its short-term and long-term liabilities.
- Quick Ratio: The acid-test ratio measures a company’s ability to pay its short-term debts using its most liquid assets. This ratio focuses more on measuring if the company can pay its liabilities in the short term using liquid assets, which means inventories are excluded from the current assets.
- Cash Ratio: This ratio measures a company’s ability to pay its short-term liabilities using only cash and cash equivalents. Testing a company’s ability to handle paying the full brunt of all current debts immediately without liquidating any assets.
- Days in Receivable: Commonly known as Days Sales Outstanding (DSO), is used to calculate the estimation of a company’s average collection period. Basically, this will represent a company’s management condition of their accounts receivables.
- Days in Inventory: Commonly known as Days’ Sales in Inventory (DSI), it measures the average number of days a company could sell the average number of inventories they held during that period of a year. Basically, this will serve as proof of a company’s ability to turn its inventory into sales.
- Days in Payable: Commonly known as Days Payable Outstanding (DPO), it is used to measure a company’s ability to pay its invoices or bills to its suppliers, vendors, or creditors. The ratio derived from this will be the company’s average payable period, depicting the proper management of its cash flows in a given number of days to pay off its account payables.
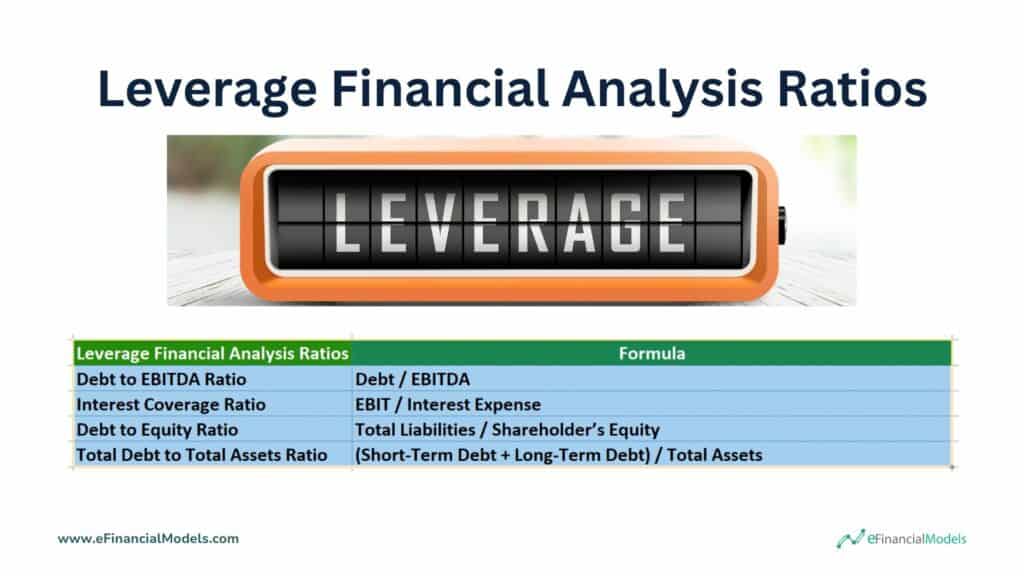
Leverage Financial Analysis Ratios
- Debt to EBITDA Ratio: This ratio refers to the relationship between Debt to Earnings before Interest Depreciation and Amortization. It is a ratio leverage measurement to calculate how long it would take for a company to pay back its debt if its Debt/ EBITDA is held constant.
- Interest Coverage Ratio: It is a ratio to measure a company’s credit worth both by rating agencies and in debt-financed takeovers. It ensures that the company can pay its interest expenses on its outstanding debt by comparing how often EBIT covers the interest expenses.
- Debt to Equity Ratio: This ratio is used to assess the company’s debt to finance its assets relative to the value of the shareholders’ equity. This ratio will help measure a company’s debt relative to the total value of its stock.
- Debt to Total Assets: This ratio assesses the total percentage of all assets that creditors, liabilities, or debt-financed. It is a broad ratio since it includes short-term and long-term debts and tangible and intangible assets. Hence, analysts often prefer using Debt to Equity instead of Debt to total assets.
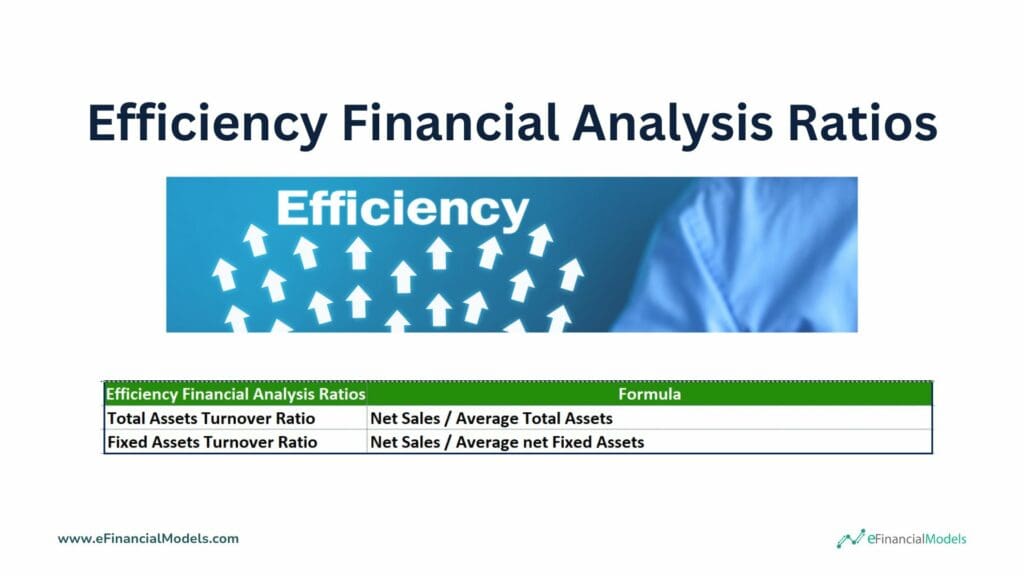
Efficiency Financial Analysis Ratios
- Total Assets Turnover: This ratio measures a company’s ability to yield sales from its assets by comparing net sales with the average total assets.
- Fixed Assets Turnover: This is the ratio of sales referred from the Profit and Loss Account to the value of Fixed Assets in the Balance Sheet. It measures a company’s ability to generate sales from its fixed assets.
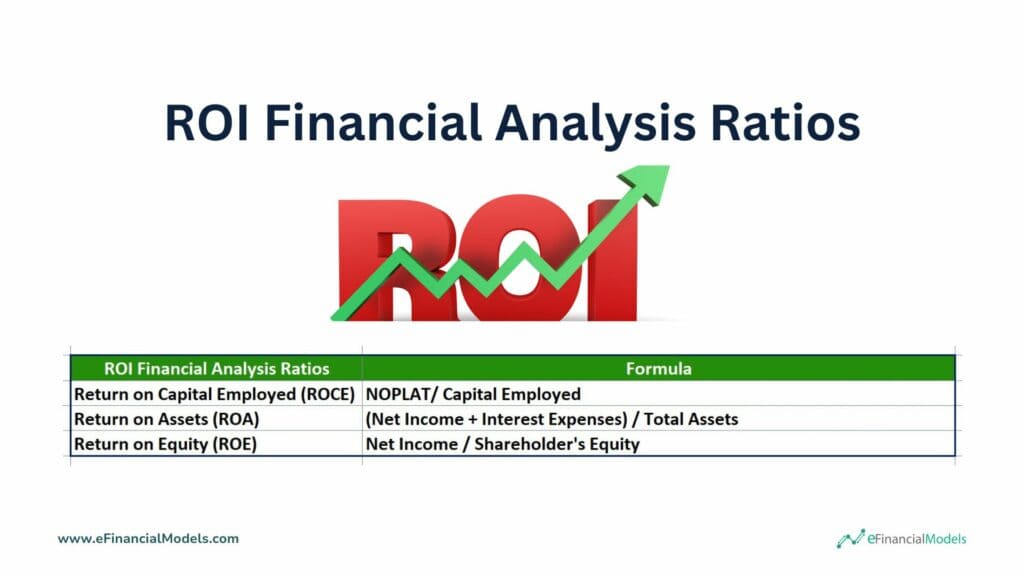
ROI Financial Analysis Ratios
- Return on Capital Employed (ROCE): This ratio assesses a company’s ability to earn a return on all the capital it employs. It helps investors see through growth forecasts and determine how reliable a company’s performance is without including the effect of debt financing. This ratio is also used to measure comparable companies’ relative profitability and compares the Net Operating Profit Less Adjusted Taxes (NOPLAT) to the Capital Employed (or Invested Capital).
- Return on Assets (ROA): This ratio, sometimes referred to as return on investment, is used to assess a company’s ability to earn profit relative to its overall resources. It determines if a company is profitable due to its asset yield.
- Return on Equity (ROE): It is also known as return on net worth and is used to measure a company’s profitability by assessing its ability to generate sales using the funding given by investors or shareholders. It is the net income returned as a ratio of the shareholder’s equity.
Financial Analysis Excel Template: Streamline Your Business Insights
In conclusion, mastering Excel for financial analysis is essential for professionals seeking to make informed business decisions. Excel provides powerful tools for organizing, analyzing, and interpreting financial data, enabling users to identify trends, forecast outcomes, and make strategic recommendations.
By leveraging formulas, functions, and data visualization techniques, Excel becomes an indispensable asset for building robust financial models and delivering insights that drive performance and growth. As a result, knowing how to use Excel effectively enhances analytical capabilities and contributes to better decision-making in today’s data-driven business environment.
Aside from fundamental analysis, many factors affect the accuracy of the analysis of the financial data, especially when using comparisons of financial ratios. Hence, the results will still vary depending on how you conducted your financial analysis and on what basis you’re following. The financial analysis with Excel can be done by building a financial model, but only some are experts in financial modeling. It is a good thing that downloading a Financial Analysis Excel Template is easy, simply by going to a financial modeling platform, offering you choices from different businesses in different industries to use these Excel templates as your base on where and how to start your financial analysis. The financial analysis Excel template is also linked to the financial statements and all ratios are dynamically updated. Ensuring you stay focused on what is relevant for your business model and what is not, making it easy, and helping you save more time.
If you’re interested and need an Excel financial analysis template, please check eFinancialModels.com. We offer a wide range of industry-specific financial model templates in Excel made by skilled and experienced financial modeling experts. These templates are used by different users, such as executives, entrepreneurs, CFOs, accountants, analysts, finance-related professionals, etc., from countries such as the USA, UK, Canada, Australia, Japan, and many more who need help with their financial modeling tasks.














You might also like:
- 10 Tips to Develop a First Class Business Valuation Report
- Financial Ratios Analysis and Its Importance
- Financial Modeling for Startups and Small Businesses
- Mastering Business Finance: The Three-Statement Financial Model
- Financial Statements – Definition, Uses, Contents and Templates
- How to Calculate Net Present Value (NPV)?
- How to Do Cohort Analysis in Excel
- Financial Planning for Small Business Owners – Taking an SBA Loan
- Business Valuation
- Revenue Projections
- Financial Services
- Real Estate
- How to build a financial model for a mobile app?
- How to Prepare a Financial Plan for a Chicken Egg Farm?
- The Purpose of a Financial Model
- How Can You Make Your Startup Successful?
- Five Critical Financial Metrics for Your Business
- Financial Modeling for Startups: Key Considerations
- 12 Funding Sources for Businesses and Startups
- 10 Main Elements of a Business Plan
