How to build a financial model for a mobile app?

Building a financial model for a mobile app can be quite cumbersome. Let us shortly explain how a straightforward and userfriendly financial model can be built and how it can be well structured.
Download the LITE app financial model template here if you want to follow the explanations in more detail. In short the following aspects need to be considered when building a financial model for a mobile app:
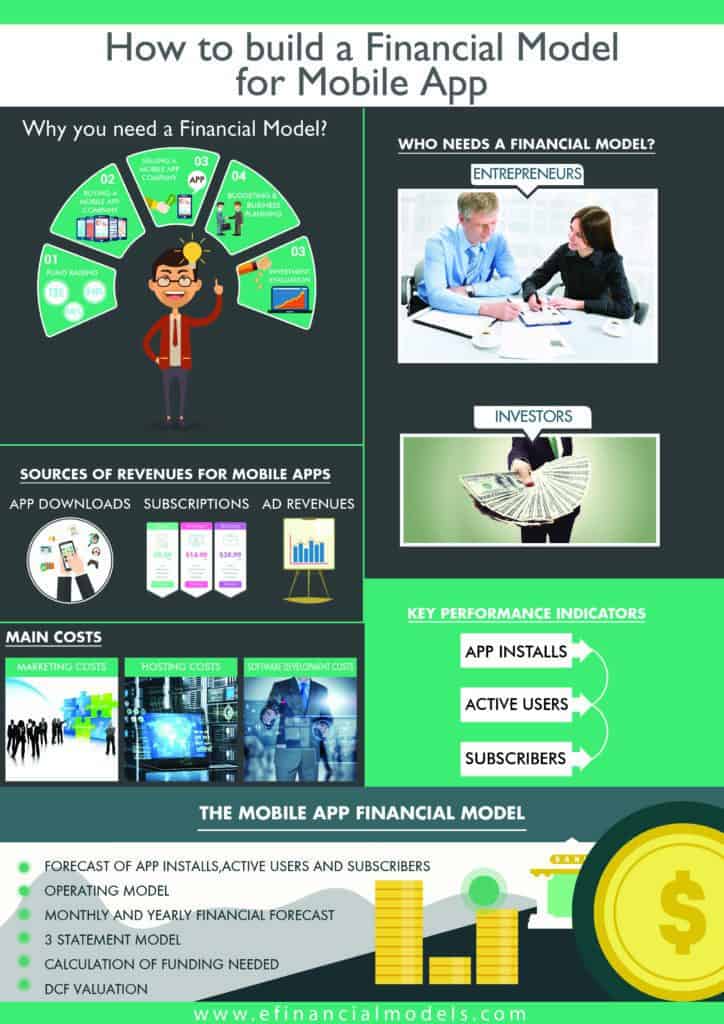
A Short Wrap up on App specific Revenues and Cost Drivers
The first point to consider when modeling the financial projections of a mobile app is where the revenues from the app originate. Normally app revenues origin from the following sources:
- Downloads of a paid version of the app
- In app advertising
- Revenues from in-app subscriptions
On the cost side, we have two main cost items which are the customer acquisition costs (CAC) and the commissions of the revenue share paid to the app stores such as iTunes and Google Play.
Customer acquisition costs are the expenses made to motivate customers to download the app. Normally this will be an advertisement campaign inside other apps or on the internet, where basically one has to pay for each click made to bring visitors on the app download page. Customer acquisition costs are now those costs per click (CPC) divided by the conversion rate (the % of visitors who actually decide to download the app). When using other forms of online marketing, such as SEO, Newsletter Marketing or Press releases one can still estimate the implied cost per click. For this reason its the easiest to assume marketing budget, cost per click and how much downloads you can expect.
Commissions paid to the app stores are normally in the range of 30% and the costs need to be linked to the sale of the apps and in-app subscriptions.
We now have a detailed look how we can build the financial model template for our mobile app.
Monthly Projections of the Key App Metrics
App Developers will most likely need to follow a monthly plan to develop their app (ca. 1 – 3 months development period) and to roll it out and market the app. For this reason we build a monthly financial model, projecting income and expenses on a monthly basis. In order to keep the model consistent, we just do it for the whole forecast period as we can then simply take the sums to build the yearly financial projections later on.
A short comment how we differentiate between input and output in our model financial projections:
- Assumptions we mark with gray dotted lines as we link them later on to the Executive Summary / Assumption Sheet
- Calculations we leave in black font
Here are the variables and the model logic we need to focus on:
- Time period for the App Development (only expenses, no installs for a particular period of months)
- Number of downloads (output) which are driven by the marketing budget (input) for customer acquisition via Cost per Click Estimate (CPC) (input)
- Downloads split in Free and Paid Downloads where we simply assume a % split
- App Installs calculated at any given point in time by adding the monthly new downloads to the previous months number of installed apps and subtract the number of app deinstalls
- The number of App deinstallations we simply estimate by taking a % of the last months total app installations to keep our model simple for the time being.
- Active / Inactive Users we also estimate by a simple % split estimation. Obviously not everybody who downloads the app will use it. So we need the % estimate to determine the number of users which are using the app during a certain period of time (e.g. on a weekly basis)
- Conversion % to paying subscribers – we also need an estimation how many of the active users can be converted to paid in-app subscribers
- The advertisement revenues are estimated via the hours spent in the app per month, average number of ads per hour displayed, the click rate and the cost per click charged to advertisers. Thus by multiplying those factors we can estimate the monthly advertisement income.


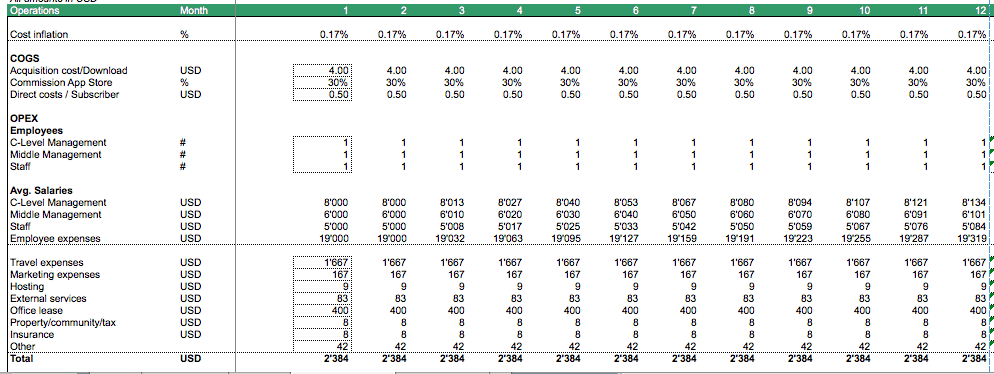
Monthly Estimate of the Costs to Develop and Maintain the App
- We link the acquisition costs to the number of downloads by multiplying with the Customer Acquisition Cost per User
- The commission fees to be paid to the app stores (e.g. the 30% fee from iTunes) are linked to their % fee share from paid app downloads and subscription revenues
- Employee cost are estimated by forecasting three categories of salaried employees
- The other operating costs are driven by yearly cost estimates which are broken down on a monthly basis
- Same for the estimation of other operating expenses
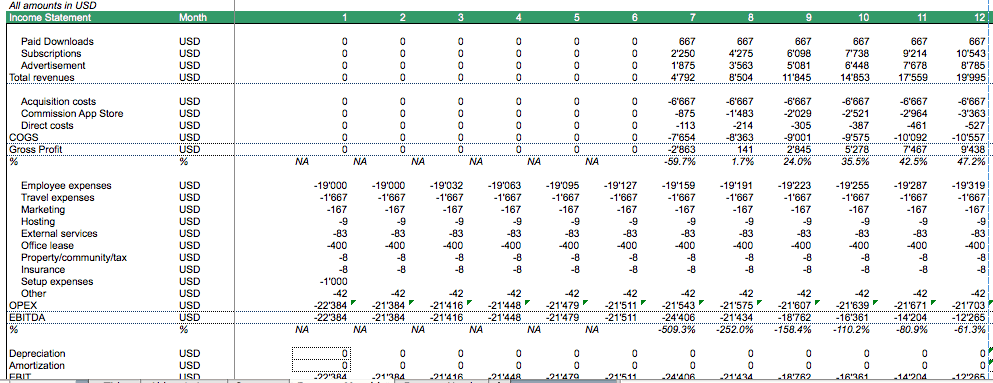
Projection of the Monthly Income Statement
We now simply arrange the monthly income statement by adding the three different revenue sources to total revenues and subtract all direct and indirect costs till Earnings Before Interest, Taxes and Depreciation (EBITDA).
This allows to calculate the monthly EBITDA so that we know in which month EBITDA becomes positive. Some additional comments:
- The revenues from subscriptions equal to the Monthly Recurring Revenues
- For line items below EBITDA we will need the estimates from the Yearly Financial Statement by taking the amortization and depreciation schedules and distribute the cost on an equal monthly basis
- Same for interest expenses
- Tax expenses we calculate on a yearly basis later on and simply assume them to be paid in the last month
- Our calculation allows to calculate the monthly EBITDA and point in time where EBITDA will breakeven
Projection of Monthly Balance Sheet
We now even go as far to project a monthly balance sheet. The reason is simply that we want to have consistency between our monthly and yearly financial projections to make the app financial model better readable.
- Net Working Capital items such as receivables, payables etc. are estimated based on the days outstanding and dividing by 12
- Fixed Assets are estimated by adding the monthly capital expenditures (assumed to occur in the first month of the year) and by deducting the monthly depreciation expenses
- Dito for software development expenses and their amortization expenses
- Initial equity is calculated based on the required funding amount to cover all costs (the minimum of cumulated Free Cash Flows to Firm during our financial projections)
- The Balance Sheet allows to track and compare the monthly cash balance so that we ensure there is sufficient money raised

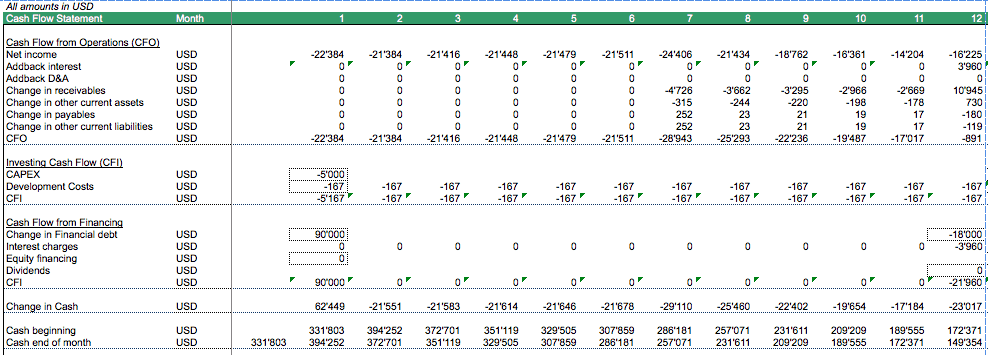
Projection of the Monthly Cash Flow Statement
Now as we have built the monthly balance sheet, we can build the monthly cash flow projections:
- Cash Flow from Operation includes the change in Net Working Capital which is due to the change in receivables, payables and other net working capital items
- Cash Flow from Investing to include capital expenditures (CAPEX) and software development costs (in this example assumed to be activated on the Balance Sheet and amortized over time)
- Cash Flow from Financing also allows to run a scenario where some form of debt financing can be used
Projection of EBITDA Breakeven and Payback Period
We now simply add a function to figure out in which month EBITDA becomes positive to calculate the breakeven point of EBITDA.
To calculate the payback period, we calculate first Free Cash Flows to Firm (FCFF) and add a function to track in which month the cumulative Free Cash Flows become positive again, meaning by when the investment is paid back. This allows investors to compare the project with other investment project.

Projection of Yearly Financial Statements and Key Metrics for the Mobile App
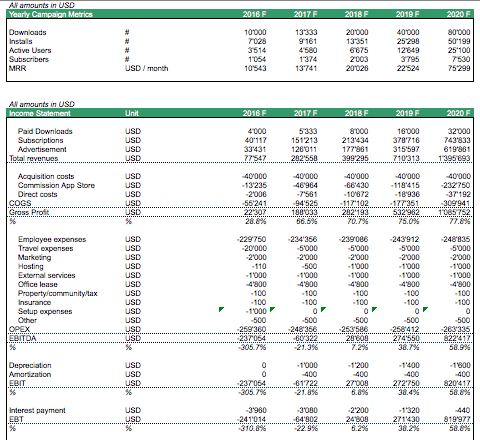
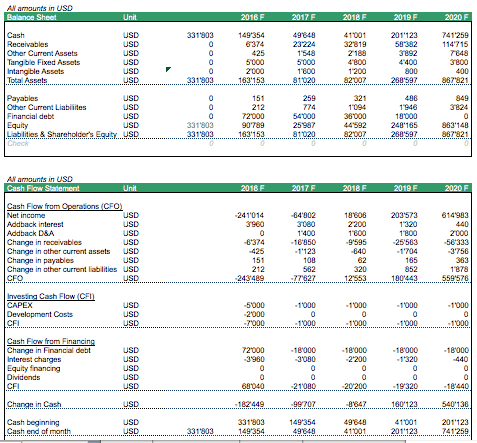
We now have finished forecasting the financials on a monthly basis for our mobile app. Thus we add a second worksheet in excel to now build the yearly financial forecast. As we actually have all the monthly financials ready, we now simply can aggregate the monthly financials to project the yearly financial statements for the mobile app.
Here the factors we aggregate from the monthly financials:
- Number of Downloads, Installs, Active Users, Subscribers and MRR
- Income Statement, Balance Sheet and Cash Flow Statement
DCF Valuation and Project IRR
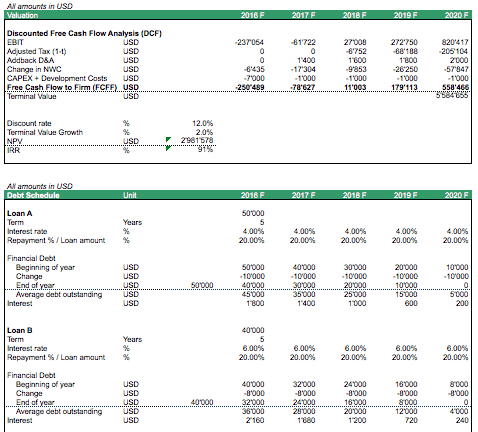
This means we now have all the yearly financials ready to build the yearly Free Cash Flows to Firm which we need to estimate the value of the app via the Discounted Free Cash Flow Method (DCF).
Project IRR, a measure which is also of high relevance to investors (allows investors to compare this project to alternative investment projects), is calculated based on the Free Cash Flows to Firm.
Depreciation and Amortization Schedule
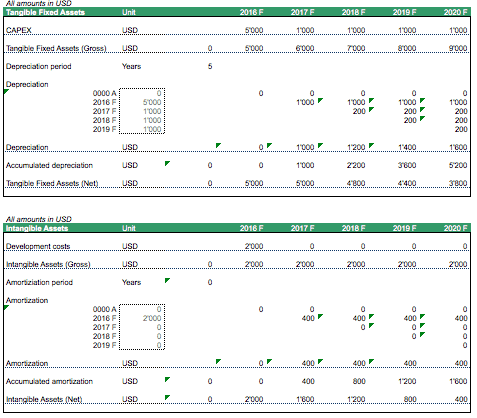
A short note with respect to the estimation of depreciation and amortization expenses. For this we need a respective depreciation and amortization schedule where we simply use the linear depreciation method to estimate depreciation. From a valuation point of view, depreciation expense have an effect on taxes but otherwise should not impact the DCF value or Project IRR calculation. So lets not spend too much time with this and use the simplest method possible.
Building the Executive Summary
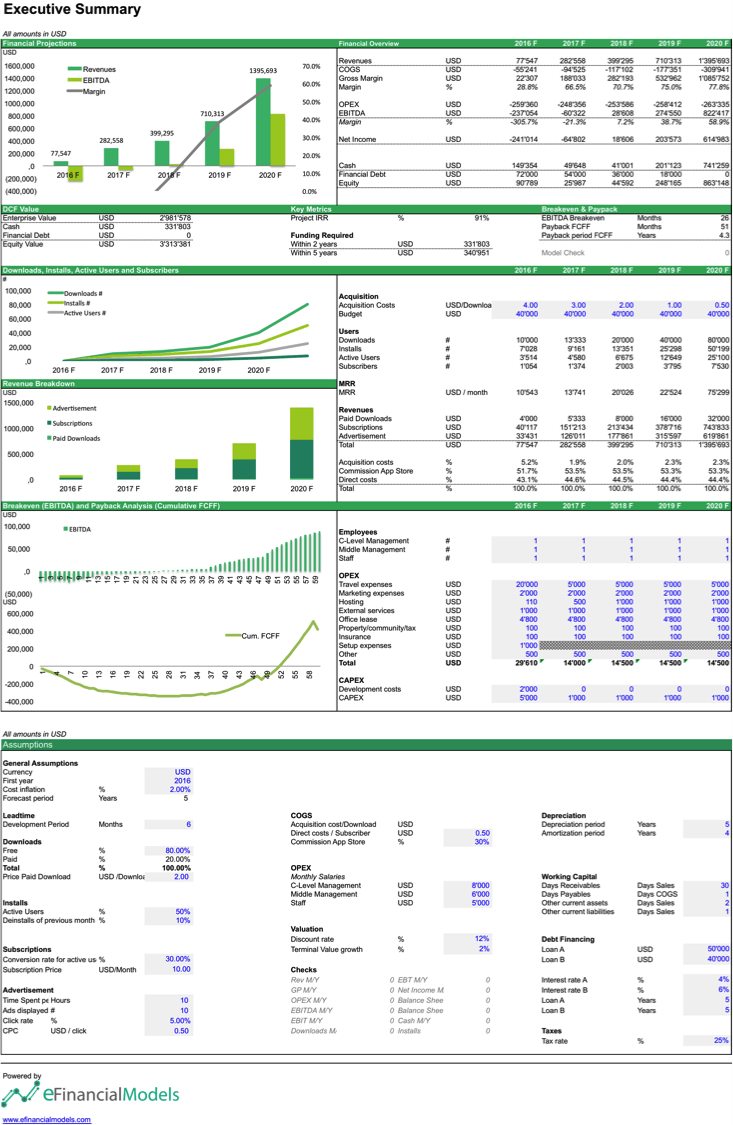
The Executive Summary is easiest to build when all the other data is available. We now add assumptions in blue and replace the cells marked with dotted line on on the monthly and yearly financial sheets with links to our assumptions marked in blue on the Executive Summary Sheet. This way we have a cockpit view and can easier run simulations when using different assumptions.
In addition we also show a short financial overview of the main projections and the calculated key financial metrics. You can finetune the Executive Summary as you like or add an additional sensitivity analysis to it later on.
We hope this provides a concise explanation How to build a financial model for a mobile app.
If you like to save time you can simply download the app financial model template here.
Enjoy!

