
0 ITEMS

How to Measure the Return on Investment
Table of Content

Choosing the right return on investment metric is essential for making informed financial decisions.
- IRR measures the annualized profitability of short-term or sell-focused investments by factoring in cash flow timing.
- Cash-on-Cash Yield highlights steady income and is ideal for buy-and-hold strategies with ongoing cash flow.
- Comparing unlevered and levered IRR reveals how financing impacts project returns, especially in industries like solar energy.
- Calculating these metrics at both company and investor levels helps align financial analysis with your specific goals.
- Understanding the differences allows you to select the most relevant metric for your investment type and strategy.
Keep reading to see how these performance measures can inform smarter investment decisions.
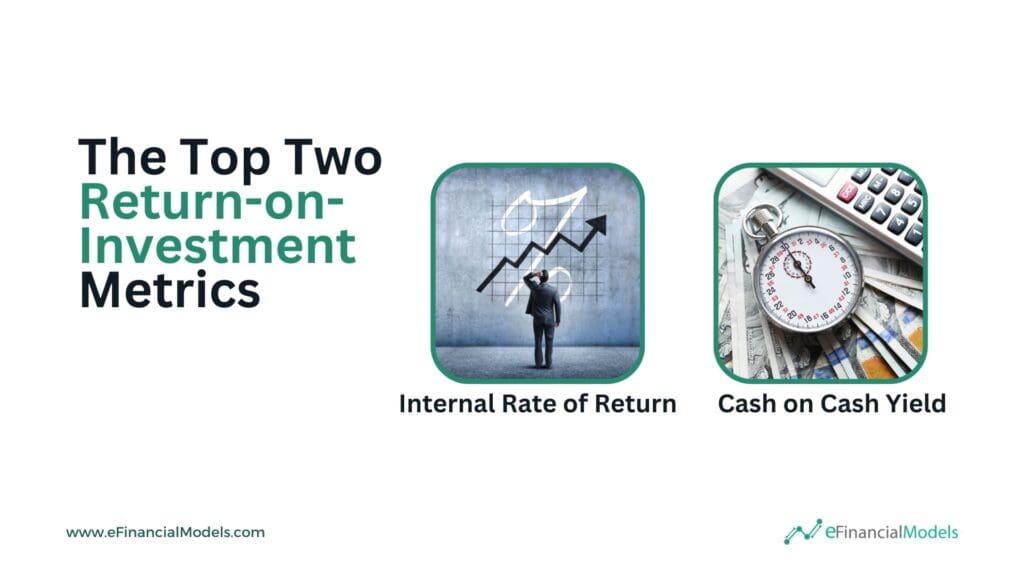
The Top Two Return-on-Investment Metrics
Two key financial metrics stand out when evaluating investments. The Internal Rate of Return (IRR) and Cash-on-Cash Yield are the top two return-on-investment metrics. IRR measures the annualized return, making it ideal for buy-and-sell strategies. In contrast, Cash-on-Cash Yield focuses on cash flow, which suits buy-and-hold investments.
When evaluating investments you plan to sell in the future, the Internal Rate of Return (IRR) is essential. Unlike the basic ROI, the IRR accounts for the timing of cash flows, giving a more accurate picture of long-term performance. It helps you understand how much your investment grows annually, considering the length of time you hold it. It makes it the ideal tool for comparing projects with different time horizons.
If you plan to hold an asset indefinitely, consider using the Annual Cash-on-Cash Yield instead. This return on investment metric focuses on how much cash you receive annually compared to your initial investment. Since there’s no future sale to factor in, the time horizon is less relevant. Instead, this approach helps measure the yearly steady return, making it perfect for buy-and-hold investments like rental properties or long-term equity stakes.
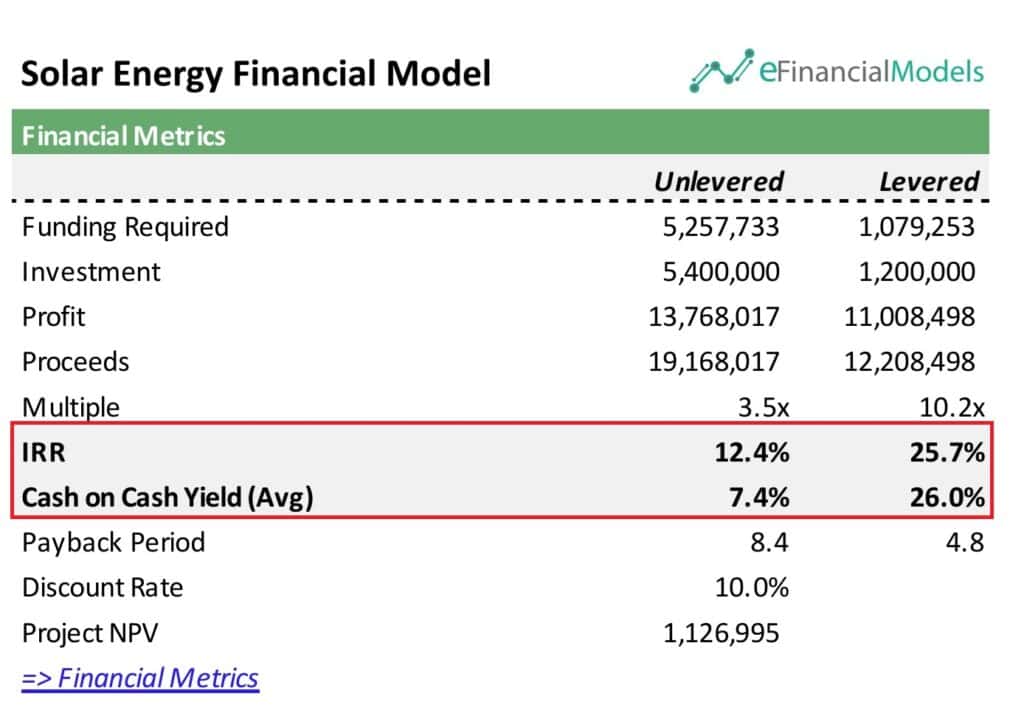
The chart above compares the unlevered and levered return on investment from a Solar Energy Financial Model. It showcases the IRR and Cash-on-Cash Yield. The unlevered IRR of 12.4% reflects the project’s overall profitability without debt, while the leveraged IRR jumps to 25.7%, highlighting how borrowing can amplify returns. Similarly, the unlevered cash-on-cash yield of 7.4% contrasts with 26.0% when leveraging, emphasizing stronger cash flow benefits for investors using debt. These measures provide a clear view of financial performance, making them essential in industries like solar energy, where upfront costs are high, but returns become more attractive with strategic financing.
Furthermore, you can calculate these top two return-on-investment metrics at the company or investor levels. At the company level, the focus is on the overall performance of the entire investment project. At the investor level, the focus shifts to individual returns based on the investor’s share and cash contributions. This flexibility helps align the analysis with your specific financial goals and perspectives.
Cash on Cash Yield vs. IRR: Key Differences Explained
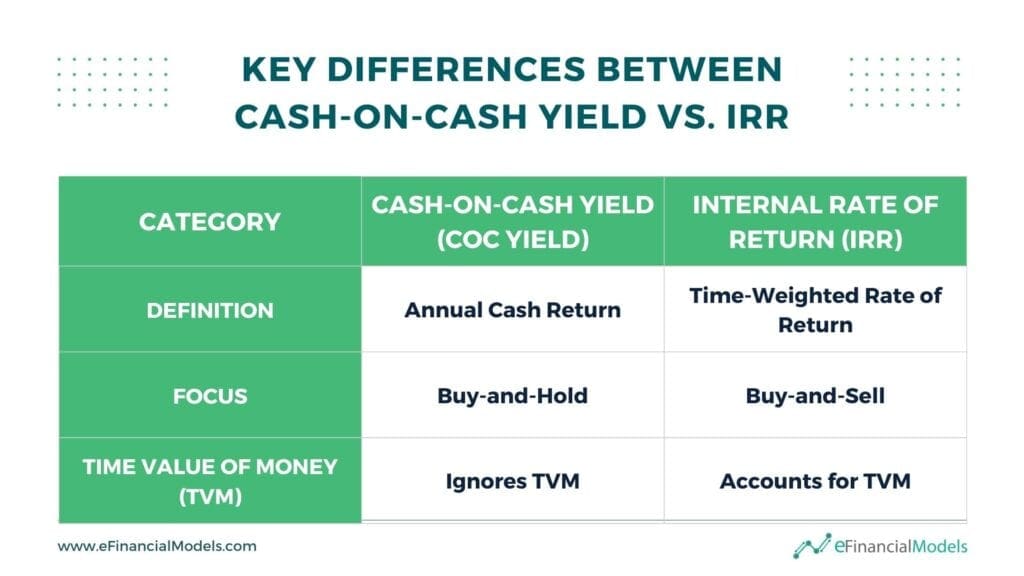
Understanding the distinction between Cash-on-Cash Yield (CoC Yield) and Internal Rate of Return (IRR) is crucial for evaluating investment opportunities. Both return-on-investment metrics help assess investment performance but serve different purposes. Here are some key differences between Cash-on-Cash Yield vs. IRR:
Definition: Cash-on-Cash Yield measures the annual return on investment based on the actual cash earned compared to the cash invested, providing a snapshot of yearly profitability. In contrast, the Internal Rate of Return (IRR) captures the overall percentage return by factoring in the time value of money and all future cash flows throughout the investment’s life. While Cash-o- Cash Yield calculation focuses on immediate, straightforward returns, IRR evaluates long-term performance by calculating the discount rate that sets the net present value (NPV) to zero. Cash-on-Cash Yield answers, “What am I earning this year?” while IRR answers, “What is my total return over time?“
Focus: Cash-on-Cash Yield vs. IRR varies in focus. Cash-on-Cash Yield focuses on annual cash returns relative to the cash invested, making it ideal for buy-and-hold strategies where investors seek steady income. It tracks ongoing profitability without considering the full lifecycle of the investment. In contrast, the Internal Rate of Return (IRR) measures the total percentage return, factoring in all cash flows and the eventual sale, making it better for buy-and-sell strategies. IRR shows how profitable the entire investment is over time, including the exit value. Put Cash-on-Cash Yield answers, “What am I earning now?” while IRR answers, “Was the investment worth it in the end?“
Time Value of Money: Cash-on-Cash Yield ignores the time value of money (TVM) and only looks at the annual cash return compared to the initial investment, treating each dollar earned as equal, no matter when it’s received. This makes it a simple measure of current income but less accurate for long-term value. In contrast, the Internal Rate of Return (IRR) fully accounts for TVM by discounting future cash flows, recognizing that money earned today is more valuable than later. As a result, IRR provides a clearer picture of overall profitability over time, factoring in both early and late-stage returns.



















































The Internal Rate of Return on Investment: Measuring ROI for Buy-and-Sell
The internal rate of return on investment is the rate that makes your net present value (NPV) equal zero, showing the exact return your investment earns over time. A higher IRR signals a stronger return, making it easier to compare multiple opportunities. Whether you’re assessing a business project or a stock investment, IRR provides a clear snapshot of financial performance. It simplifies decisions by highlighting how profitable an investment is relative to its costs and timing.
Calculating the internal rate of return on investment for buy-and-sell investing is an iterative process. Start by listing the initial investment cost as a negative cash flow and the returns from future sales as positive cash flows. The IRR represents the discount rate that makes these cash flows’ net present value (NPV) equal to zero. Use trial and error, spreadsheets, or financial calculators to adjust the rate until the total cash inflows and outflows break even. A higher IRR means a more profitable investment relative to its cost, effectively helping you compare different buy-and-sell opportunities. Excel is a powerful tool for calculating the internal rate of return (IRR) on investments. Using the built-in =IRR() function, Excel automatically finds the discount rate where your net cash flow equals zero. It saves time and reduces manual errors.
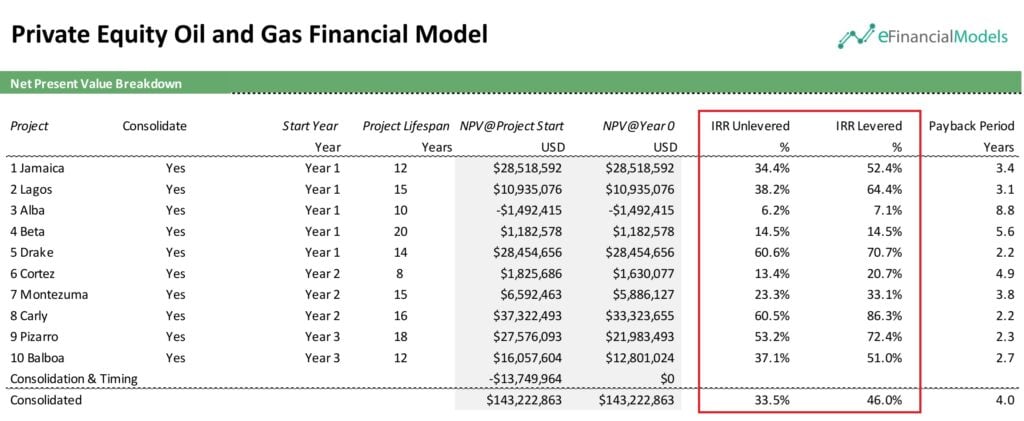
Private equity involves investing directly in private companies to boost growth and generate high returns. It focuses on buying, improving, and eventually selling businesses for profit. The chart above from a Private Equity Oil and Gas Financial Model evaluates the internal rate of return on investment for both unlevered and levered cash flows across multiple projects. It highlights differences between the unlevered IRR (excluding debt impact) and levered IRR (including debt influence), helping investors understand the effects of financing choices. By comparing IRR values alongside project lifespans, Net Present Value (NPV), and payback periods, stakeholders can identify which projects provide the best balance of risk and return, supporting informed investment decisions.
Based on the chart, the projects that offer the best balance of risk and return are Drake, Carly, and Pizarro. Drake stands out with a 60.6% unlevered IRR, 70.7% levered IRR, and a 2.2-year payback period, indicating high profitability and quick returns. Carly excels with an 86.3% levered IRR and the same 2.2-year payback period, making it highly attractive when leveraging debt. Pizarro follows closely with a 53.2% unlevered IRR, 72.4% levered IRR, and a 2.3-year payback period, demonstrating strong returns and low risk.
Cash-on-Cash Yield Calculation: Measuring ROI for Buy-and-Hold
Cash-on-cash Yield calculation measures the annual return on your invested cash. It shows how much cash flow you earn compared to your upfront investment. This metric focuses only on cash returns, ignoring loan payments or property value changes. It’s simple: helping investors quickly gauge short-term profitability. A higher yield means your investment is generating stronger cash returns.
Measuring ROI using the cash-on-cash yield calculation focuses on the actual cash returns compared to the cash invested. It’s a straightforward calculation: divide the annual pre-tax cash flow by the total cash invested and multiply by 100 to get the percentage.
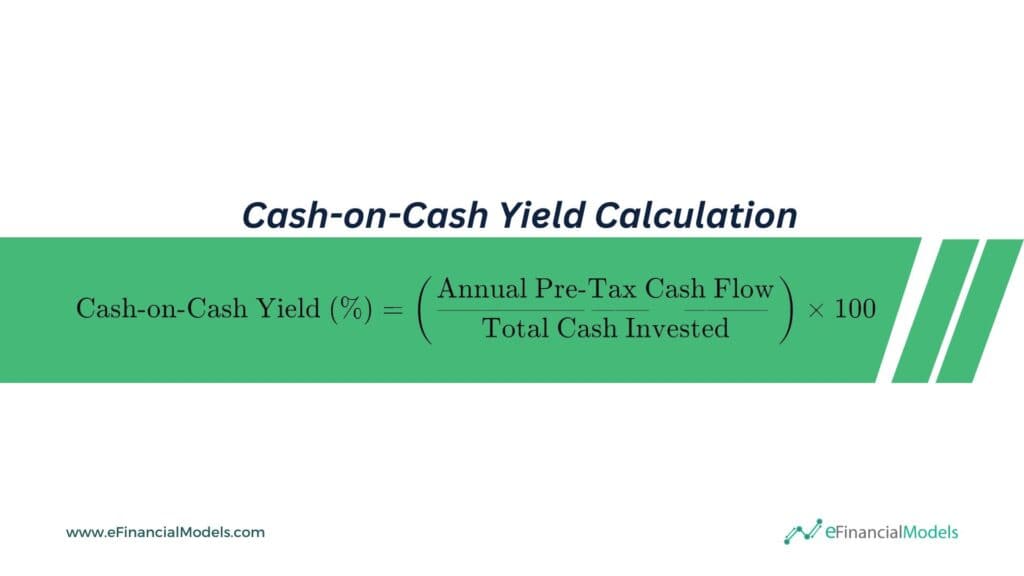
Cash-on-cash Yield calculation highlights real-time performance, making it easier to see how much return your investment generates yearly. Unlike more complex return-on-investment metrics, cash-on-cash yield calculation focuses solely on cash input and output, making it especially useful for evaluating real estate or projects with ongoing income streams. This clear, focused approach helps investors make smarter, data-driven decisions quickly.
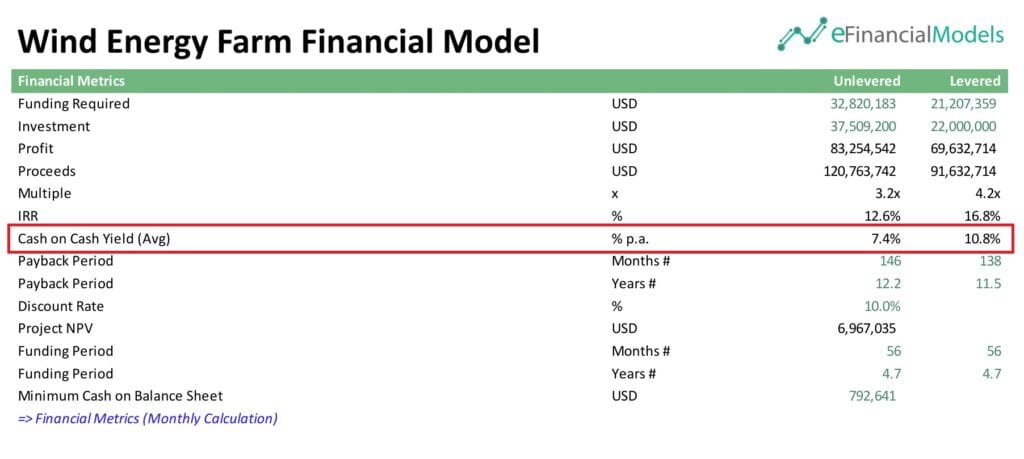
A wind energy farm is a strong example of buy-and-hold investing because it generates steady, long-term cash flows once operational. The chart above highlights how cash-on-cash yield measures ROI by comparing unlevered (no debt) and levered (with debt) scenarios in a Wind Energy Farm Financial Model. The unlevered yield is 7.4% annually, while the levered yield reaches 10.8% due to the financial leverage’s impact, boosting returns from borrowed capital. A higher levered yield suggests that the project benefits from financing but also reflects higher risk. This example signals a potentially strong investment since both yields exceed typical hurdle rates. However, investors must assess the associated debt risk and market stability to ensure this performance is sustainable.
Measure ROI and Make Data-Driven Decisions for Future Growth
In summary, measuring return on investment (ROI) requires the right approach based on your strategy. To measure ROI effectively, use IRR for buy-and-sell strategies to assess total profitability and cash-on-cash (CoC) yield for buy-and-hold investments to track annual returns on capital. Both metrics provide valuable insights into performance and help identify growth opportunities. By incorporating these calculations into financial modeling, you can make data-driven decisions that sharpen your strategy and drive future success.
Financial modeling goes beyond crunching numbers—it reveals trends, highlights risks, and uncovers potential. Measuring ROI using IRR and CoC yield gives you a clearer picture of your investment’s strengths and weaknesses. It empowers you to adjust your approach, seize opportunities, and stay resilient in a competitive market. A strong financial model turns data into action.
Let your numbers tell the story and guide your next steps.








































You might also like:
- 10 Ideas to Increase Average Revenue Per User
- 10 Main Elements of a Business Plan
- 10 Tips to Develop a First Class Business Valuation Report
- 12 Funding Sources for Businesses and Startups
- 14 Best Practices in Financial Modeling
- A Step-By-Step Guide to Economic Profit Calculation
- Airbnb
- Banking
- Fundraising
- Scenario Analysis
- Cash Flow Analysis in Excel
- Creating a Budget Plan – Using the Best Excel Budget Template
- Financial Model Templates Easy to Use
- Why Financial Forecasting Models Are Vital for Your Business
- How to Value a Business Using a Discounted Cash Flow Model
- Business Valuation
- E-Commerce & Web Shops
- IRR vs NPV in the Context of Financial Decision-Making
- Payback Period Calculator
- Top 5 Tips For a Good Financial Due Diligence