
0 ITEMS

10-Step Financial Planning Checklist for Smart Executives

As Bertie Charles Forbes, founder of Forbes magazine, wisely noted, “If you don’t drive your business, you will be driven out of business.” This emphasizes the importance of proactive leadership and strategic direction in achieving lasting success. Ensure you stay in the driver’s seat with a solid financial planning checklist to guide your business to success.
- Accurate financial planning involves defining clear objectives, such as raising capital, valuing assets, or budgeting for future operations.
- Gathering at least three years of historic financial statements provides insights into revenue trends, profitability, and growth patterns.
- Reliable assumptions, backed by research and industry benchmarks, are essential for building realistic financial forecasts.
- Bottom-up income forecasting focuses on detailed revenue drivers like unit sales and pricing, leading to more precise projections.
- A comprehensive cost plan categorizes direct and fixed expenses to identify profitable areas and improve resource allocation.
Smart investing isn’t just about picking the right stocks or timing the market perfectly—it’s about having a strategic plan that guides your financial journey every step of the way. This 4-Step Financial Planning Checklist is designed to help you make informed choices, stay disciplined, and keep sight of your long-term goals. Whether aiming to build wealth or ensure financial security, following these essential steps can transform uncertainty into confidence. By breaking down the process into manageable parts, this checklist empowers you to make calculated decisions that align with your aspirations, ensuring a smoother path toward financial success.

What is an Annual Financial Plan?
An annual financial plan is a strategic roadmap for a business, outlining its projected income, expenses, and investment activities over the course of a year. It brings clarity to financial objectives and helps businesses steer in the right direction, making it an essential tool for entrepreneurs, executives, and finance professionals alike. The financial plan not only sets the course for revenue generation and profitability but also highlights potential pitfalls and areas for optimization, giving a structured overview of expected performance.
An annual financial plan is much more than a simple budgeting exercise. It reflects a comprehensive vision for the business’s future, backed by realistic projections and data-driven insights. A well-crafted financial plan is the cornerstone for achieving growth while managing risks and resource allocation, ultimately allowing businesses to thrive in a competitive environment. It emphasizes the need for a financial planning checklist to ensure all critical aspects are covered.
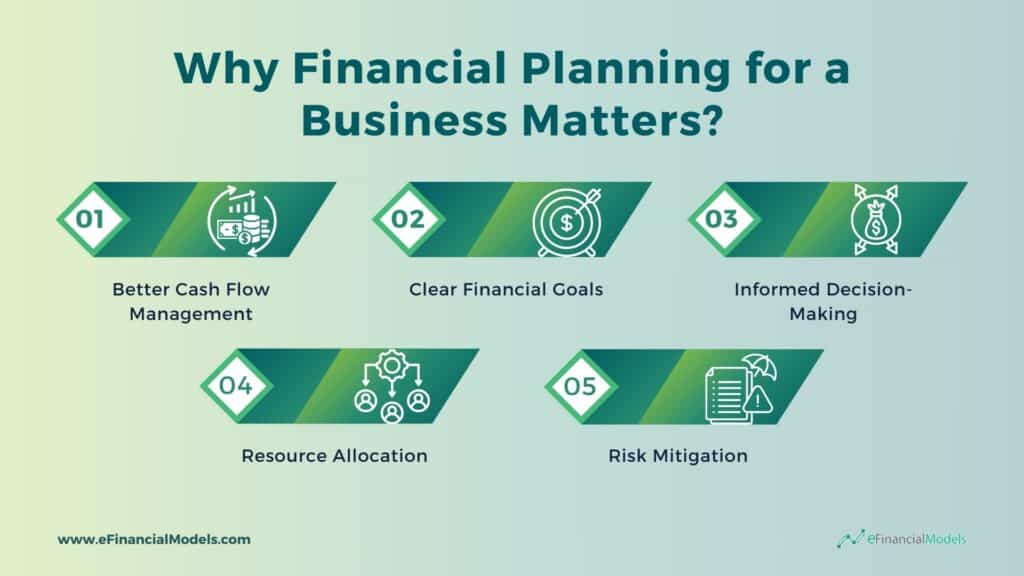
Why Financial Planning for a Business Matters?
- Better Cash Flow Management: Understanding cash flow is one of the most critical aspects of financial planning for a business. With a solid annual financial plan, entrepreneurs can predict when cash inflows will occur and manage cash outflows accordingly. It enables the business to navigate any liquidity crunches, maintain operational efficiency, and avoid the common pitfalls of poor cash management.
- Clear Financial Goals: Having clearly defined financial goals helps businesses stay focused. Whether aiming for a certain revenue figure, reducing costs, or improving profit margins, financial planning for a business helps set specific objectives that are measurable and actionable. It ensures everyone is working towards the same target and allows for better tracking of progress throughout the year.
- Informed Decision-Making: Financial planning for a business provides critical data that supports decision-making. By reviewing projections and understanding how changes in the business environment may impact financial performance, entrepreneurs and investors are equipped to make informed decisions on scaling operations, hiring staff, or entering new markets.
- Resource Allocation: Efficient resource allocation is a significant benefit of financial planning for a business. It helps businesses decide where to invest their money for maximum return and ensures that funds are well-spent on low-priority areas. By aligning resources with strategic goals, businesses can achieve sustainable growth and avoid unnecessary expenditures.
- Risk Mitigation: Financial planning allows businesses to anticipate and prepare for potential risks. By forecasting cash flow and profitability, businesses can build contingency plans to handle adverse situations, such as economic downturns or unexpected expenses. This proactive approach minimizes risks and ensures the company remains resilient.
The Essential Financial Planning Guide
Financial planning for a business can often feel overwhelming, but having a clear and structured financial planning guide can make all the difference. An essential financial planning checklist is your road map, guiding you through each key step to secure your financial future. Whether you aim to build savings, grow your business, or reduce debt, this financial planning guide simplifies the complex world of financial management, giving you confidence and clarity in your journey.
Step 1 – Define the Objective of the Financial Plan
The first step in a financial planning checklist is defining the plan’s objective. It is crucial, as it sets the foundation for every subsequent step. Ask yourself: “What is the purpose of my financial plan?” Objectives could vary from valuing a business for acquisition, raising capital, preparing a budget, determining your company’s value for future sale, or assessing the feasibility of a new venture. Each of these objectives shapes the structure and focus of your plan, influencing the specific analyses and decisions you will need to make. In addition to determining the objective, consider the planning timeline required. For instance, creating a budget might involve a shorter-term focus, such as a year or less, while planning for a new venture could require a 3-5 year horizon. Similarly, long-term objectives, such as the valuation of a business for a future exit, might necessitate a 10-year financial outlook. Defining the objective clarifies the path forward and helps determine the timeline that best supports achieving your goals.

At eFinancialModels, our planning approach emphasizes the reliability of bottom-up financial planning. This method starts with detailed inputs like volumes and prices, building a forecast based on tangible metrics that reflect a business’s actual operations and potential growth. By focusing on these granular details, the resulting financial plan becomes highly precise and practical, offering a clear roadmap for implementation. In contrast, top-down planning—such as estimating revenue by calculating market size and projected market share—provides only a broad overview. While this approach can quickly indicate potential opportunities, it lacks the depth needed to understand the specific actions and resources required to achieve the projected results. Therefore, our preference for bottom-up financial planning ensures a more actionable and reliable financial forecast.
Step 2 – Gather Historic Financials
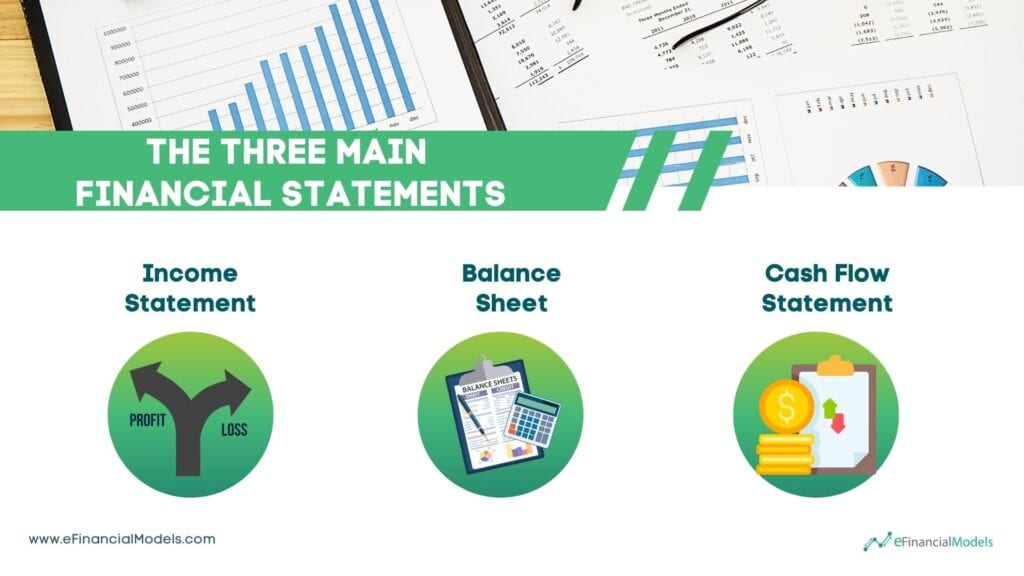
Typically, this involves collecting at least three years of past three main financial statements—income statements, balance sheets, and cash flow statements. This historical data is the foundation for understanding the business’s past performance and provides critical insights that inform future planning and decision-making. By analyzing trends in revenues, expenses, profitability, and cash flow over time, you can identify periods of growth, profitability, or challenges. Understanding what drives success or creates bottlenecks is crucial for effective planning. With historical data, a company can calculate important financial ratios like profitability ratios (e.g., gross margin, net profit margin), liquidity ratios (e.g., current ratio), and leverage ratios (e.g., debt-to-equity). These ratios are key to understanding operational efficiency, liquidity, and overall financial leverage, and they serve as benchmarks for assessing the company’s financial status compared to industry standards. With this data, you can use trends in revenues and expenses to create a realistic plan for future growth, making forecasts more precise and actionable.
You can refer to our Financial Ratio Cheat Sheet to identify the financial ratios you need to collect, depending on your financial planning objectives. For startups or early-stage businesses that lack historical financials, financial planning for a business will instead focus on projections and assumptions. They should prepare pro forma financial statements, typically three to five years into the future, based on the business plan, market research, and reasonable assumptions. These can use industry benchmarks to gauge expected revenue levels, costs, profit margins, and growth. These averages act as a baseline to understand their industry’s achievable goals and avoid overly optimistic or pessimistic projections.
Step 3 – Collect Accurate Assumptions
Don’t just guess; collect and validate all relevant assumptions to comprehensively forecast income, expenses, and investments. Accurate financial planning for a business succeeds with well-grounded assumptions backed up by thorough research. Investors should collect assumptions used in preparing a financial plan forecast by considering historical data, expert interviews, market trends, and economic conditions. This approach results in more reliable financial projections and better forecasting quality. Inputting as accurate assumptions as possible in financial planning is crucial because it directly impacts the projections’ accuracy in making financial decisions.
We need to collect information and get input from topic experts about:
- Volumes / Subscribers/Users
- Prices
- Direct Costs
- Fixed Costs
- Taxes
- CAPEX (investments)
- Debt Financing
- And other relevant assumptions, e.g., Discount Rate, EV/EBITDA multiples for exit valuation
Steps to Collect Assumptions
Collecting and inputting assumptions in a financial plan must be approached methodically to ensure accuracy and reliability. Here’s a step-by-step process you can follow:
- Determine the Key Elements Needed: Identify key variables and categories so you know what assumptions are needed. Revenue drivers include growth rates, market size, pricing, and sales volume. Costs and expenses, including production costs, salaries, and overheads. Capital Requirements such as capital expenditure, funding needs, and working capital. Financial Metrics such as debt ratios, growth rates, profit margins, and return on investment (ROI) assumptions.
- Gather Historical Data: Collect historical data from past financial statements or performance reports if available. Use this data to help establish realistic assumptions based on actual figures.
- Research Industry Benchmarks: Conduct market research to collect benchmarks and industry standards. It provides a reference for sales growth, cost margins, or other metrics to ensure your assumptions are not overly optimistic or unrealistic.
- Record Assumptions Clearly: Create a comprehensive list of all assumptions, including the rationale behind each one. Make sure they are documented with sources and supporting data. Be explicit about any estimates, external sources, and uncertainties associated with the assumptions. Group related assumptions together and use a structured approach for inputting data into your financial model, such as a spreadsheet’s dedicated “Assumptions” tab.
- Test and Validate the Assumptions: Perform scenario analysis or sensitivity testing to understand how changing each assumption affects financial outcomes. It helps identify critical assumptions that need to be carefully managed. Revisit your assumptions periodically as new data becomes available or market conditions change. Regular updates ensure that the financial plan remains relevant and realistic. By systematically collecting, documenting, and inputting your financial assumptions, you ensure that your financial plan is grounded in data and adaptable to change.

Sample Assumptions
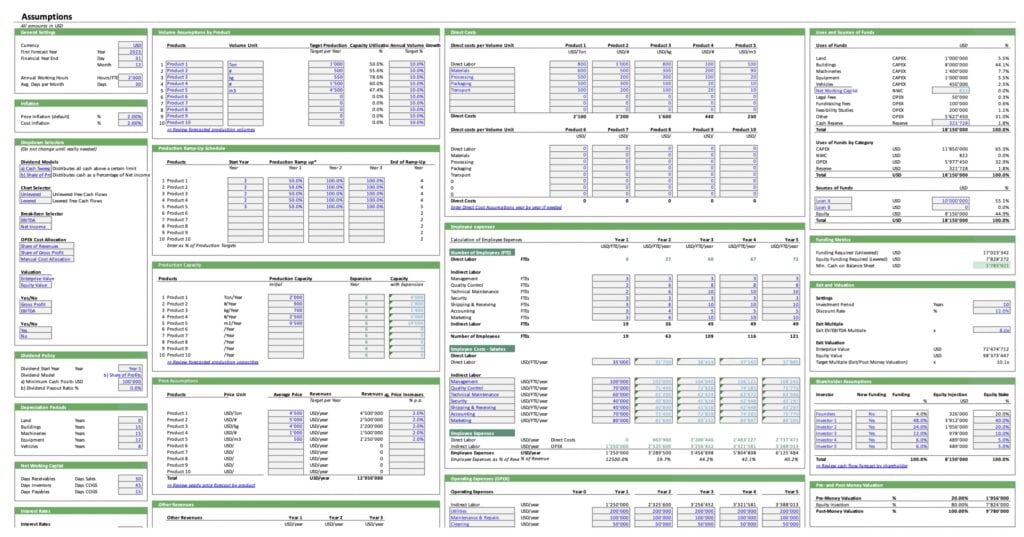
This sample assumptions page from a Manufacturing Startup Feasibility Model is an essential tool for financial planning as it consolidates key operational, financial, and production data. It includes parameters like general settings (currency, inflation, and working hours), volume assumptions by product, production ramp-up schedules, direct costs, and employee expenses. Additionally, it details the funding sources, uses of funds, depreciation periods, and valuation metrics. These assumptions form the foundation for creating projections such as production capacity, employee requirements, and costs, enabling a comprehensive assessment of the startup’s feasibility, cash requirements, and profitability. By systematically organizing data, this model helps startup founders plan funding, assess potential risks, and make informed decisions to support sustainable growth.


















































Step 4 – Put Up an Income Plan
Putting up an income plan involves determining your expected revenue by making informed estimates of the number of products or services you will sell (volume) and the price at which you will sell them. This step is crucial in developing a financial plan that is realistic and effective, as it gives you insight into how much money you can expect to generate, which in turn affects budgeting, cash flow planning, and strategic decision-making. Detail revenue sources from the bottom-up by focusing on revenue drivers. Start by detailing all potential revenue sources and the factors that drive them, such as sales volume, pricing, and customer retention. Once revenue projections are set, adapt your cost structure to ensure alignment between income and spending. This method prevents overspending and keeps growth expectations realistic.
The bottom-up approach helps ensure that revenue projections are grounded in the operational realities of the business rather than relying on high-level assumptions, as often happens with the top-down approach. By focusing on individual revenue drivers, entrepreneurs can adjust their cost structure in line with anticipated revenue, which is key for keeping budgets in check and avoiding unrealistic growth expectations. This level of detail also gives a clearer picture of potential challenges, making it easier to identify the actions required to achieve revenue targets.
How to Conduct Bottom-Up Income Forecasting
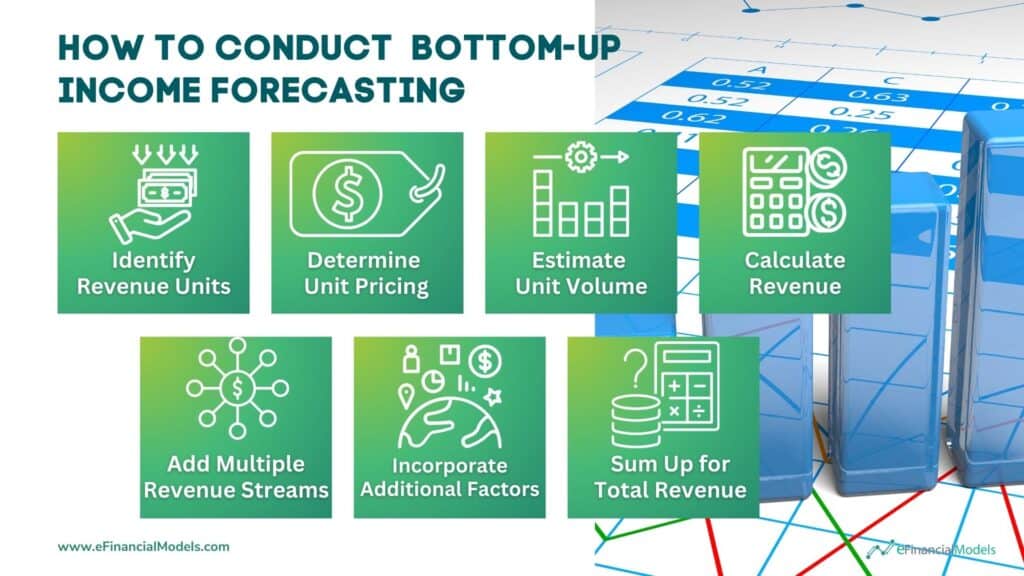
- Identify Revenue Units: The first step in the bottom-up approach is clearly defining the smallest unit that generates revenue for your business. It could be a product you sell, a service you provide, a subscription, or any other offering that generates income. It’s important to think of all possible units that can bring in revenue, as this is the foundation of your estimate.
- Determine Unit Pricing: Once you have identified your revenue units, the next step is to determine the pricing associated with each unit. It means calculating the exact price a customer will pay, which may include considerations like discounts, tiered pricing models, or different price levels for varying versions of a product or service. If you have multiple pricing options, you need to include each one in your calculation.
- Estimate Unit Volume: The third step involves estimating the volume of units that you expect to sell. It can be based on historical sales data, or market research and assumptions if you’re a startup.
- Calculate Revenue: With the unit price and expected volume of sales in hand, you can calculate the expected revenue per product or service by simply multiplying these two numbers. This step is key because it provides a basic revenue forecast for each component of your business.
- Add Multiple Revenue Streams: If your business generates revenue from different products, services, or other streams, you will need to repeat steps 1-4 for each stream. The next step is to add all these revenues together to get an overall revenue estimate. This holistic approach allows you to see how each offering contributes to the business as a whole.
- Incorporate Additional Factors: After calculating basic revenue projections, you need to fine-tune your estimate by incorporating additional factors that can influence revenue. These can include churn rate, which refers to the percentage of customers who discontinue their subscriptions, affecting recurring income. It would help if you also considered potential revenue from upselling and cross-selling, where existing customers are encouraged to purchase additional products or upgrade to a higher level of service.
- Sum Up for Total Revenue: Finally, you combine all the individual revenue estimates to determine the total projected revenue for the business. It gives you a complete and realistic overview of how much revenue you can expect based on detailed, bottom-up calculations.
Sample Bottom-Up Income Forecasting
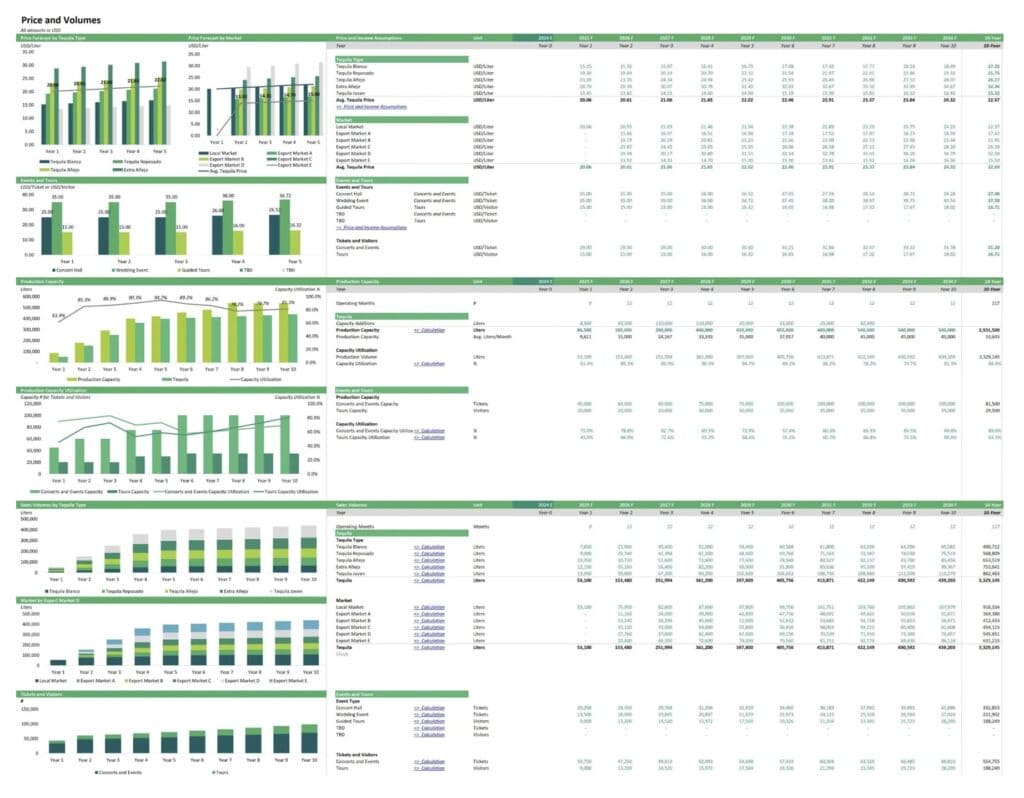
This sample bottom-up income forecast from a Brandy Distillery Business financial model breaks down various price, volume, and capacity metrics over multiple years. This type of forecast helps in financial planning by comprehensively analyzing pricing strategies, production capacity, sales volume, and expected revenue growth. By modeling these key financial drivers from the ground up, the forecast offers insight into how individual components like pricing per liter, event sales, and production efficiency impact overall profitability. It is an essential tool for business owners and financial planners to understand growth trends, make informed decisions about scaling production, and optimize resource allocation, thereby supporting better strategic planning and operational control.
Step 5 – Put Up a Cost Plan
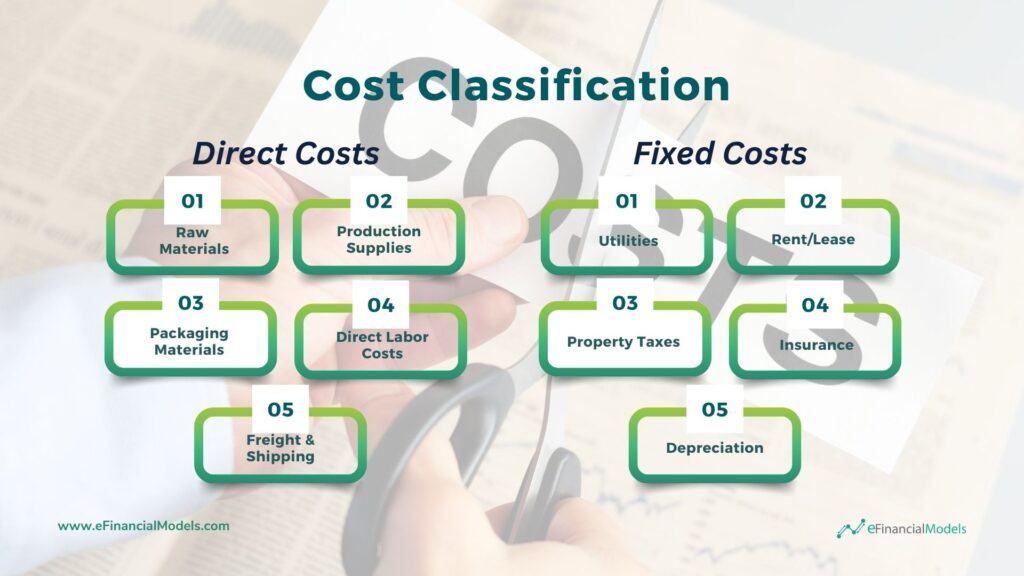
Creating a detailed cost plan is essential in financial planning as it helps you understand the expenses involved in running your business. In this step, you will itemize and categorize costs, which provides a clearer picture of your break-even point and profitability. The cost plan typically involves dividing expenses into two main types: direct costs and fixed costs.
- Direct costs can be directly linked to the production or delivery of a product or service. These costs usually fluctuate based on the level of production or sales activity. Some key components of direct costs are raw materials, production supplies, packaging materials, direct labor costs, freight & shipping, etc.
- Fixed costs, on the other hand, do not change regardless of the level of production or sales. These costs are ongoing and need to be covered regardless of business performance. Key examples of fixed costs include utilities, rent or lease payments, property taxes, insurance, depreciation, etc.
In addition to categorizing direct and fixed costs, a comprehensive cost plan should include contingency planning or setting aside a budget for unexpected expenses, such as emergency repairs, fluctuating raw material prices, or unplanned operational costs. By thoroughly itemizing all costs, you gain a detailed understanding of the financial requirements of your business.
Sample Cost Plan
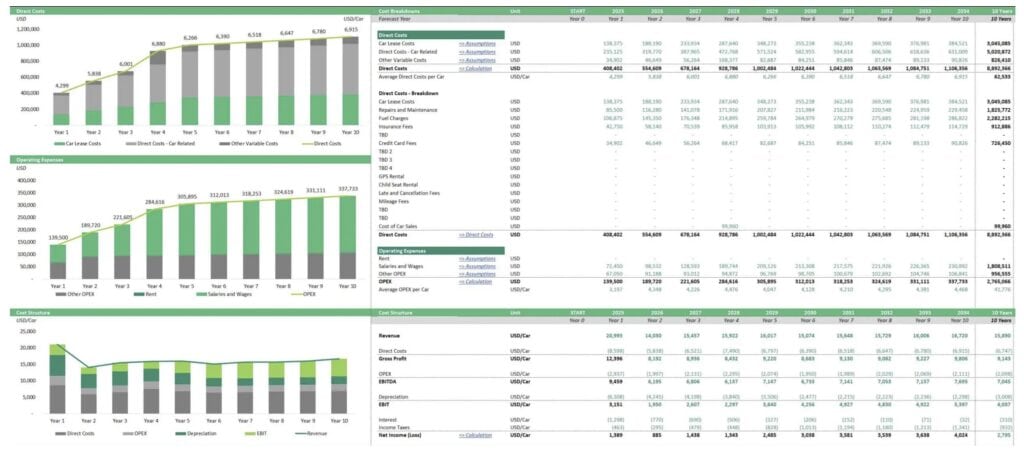
The sample cost plan from a Car Rental Business Financial Model provides a detailed breakdown of the various cost components, including direct costs, operating expenses, and cost structure per car over a 10-year forecast period. Direct costs cover car lease, maintenance, and fuel charges while operating expenses include rent, salaries, and other operating costs. The visual presentation of these expenses allows for easy comparison across different years, helping forecast trends and manage resources effectively. By analyzing direct and indirect expenses, the model supports financial planning by identifying cost drivers, assessing profitability (EBIT and Net Income), and aiding decision-making to optimize expenses for sustained growth.
Step 6 – Forecast Your Required Net Working Capital
Net working capital (NWC) represents a company’s current assets and liabilities. It indicates short-term financial health and operational efficiency. It highlights the liquidity available to meet day-to-day obligations, pay suppliers, and fund inventory, ensuring smooth business operations. Forecasting NWC is essential for effective financial planning because it helps businesses balance growth and solvency. Accurate management of NWC can optimize cash flow, reduce reliance on external financing, and provide greater agility in responding to market opportunities or challenges, which ultimately contributes to the business’s overall financial stability and success.
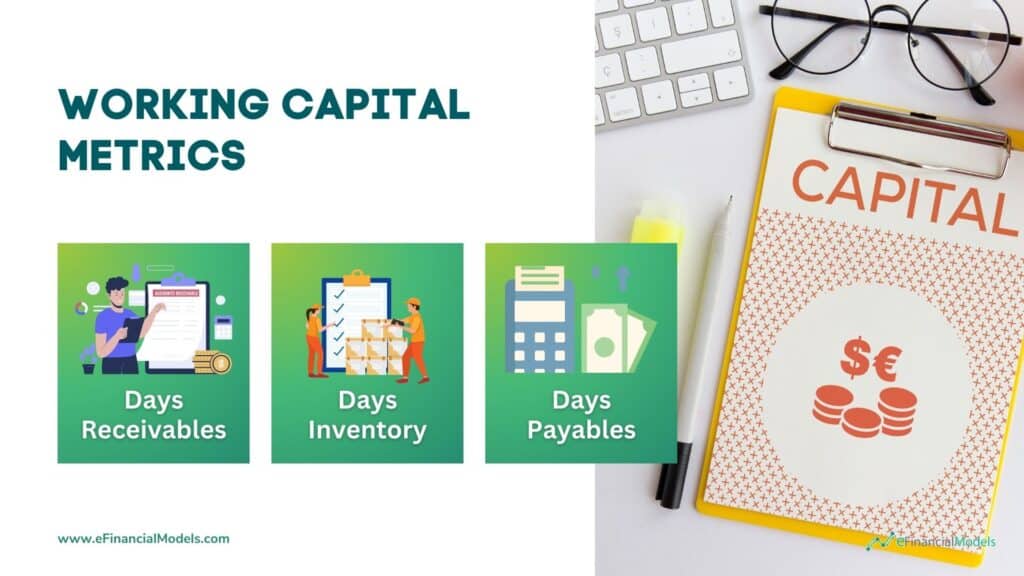
Forecasting your Net Working Capital involves a detailed analysis of three crucial metrics: Days Receivables, Days Inventory, and Days Payables. These are commonly found under the efficiency analysis section of a financial model.
- Days Receivables measure how long it takes for a company to collect payment after making a sale. Reducing Days Receivables accelerates cash inflows, shortening the cash conversion cycle.
- Days Inventory tracks the average time inventory stays before being sold. Optimizing Days Inventory minimizes holding costs and potential losses from obsolescence.
- Days Payables indicates how long it takes the company to pay its suppliers. Extend Days Payables to improve cash flow while maintaining strong supplier relationships to avoid negative consequences.
However, beyond just these metrics, you need a thorough understanding of industry-specific ratios to refine your forecast. It means diving into bank liquidity, efficiency, growth, and profitability ratios, which reveal the broader financial health of your business and how it stacks up against industry norms. For example, SaaS businesses might focus on Average Revenue Per User (ARPU) and Customer Lifetime Value (CLV). At the same time, broiler poultry companies could look at operational metrics such as Average Weight Per Bird. These specific ratios offer a detailed perspective on your company’s performance, ensuring your NWC forecast is accurate and tailored to your industry’s unique demands.
Again, you can refer to our Financial Ratio Cheat Sheet to identify the financial ratios you need to collect, depending on your financial planning objectives.
Sample Working Capital Metrics
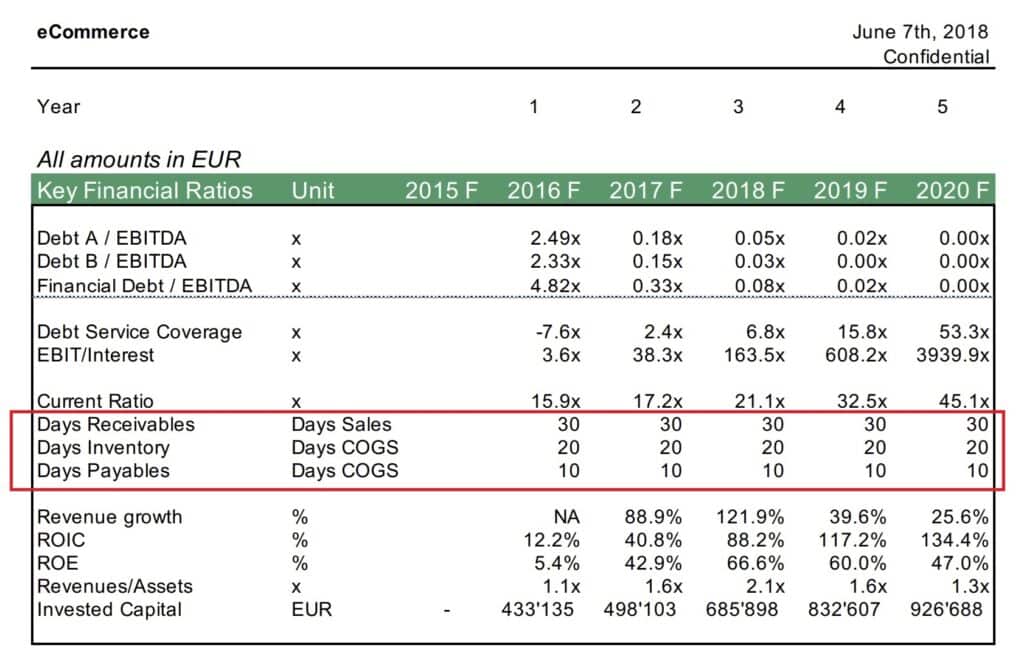
The working capital ratios—Days Receivable, Days Inventory, and Days Payables—are important indicators of how efficiently the company manages its cash flow cycle. In this eCommerce Valuation Model sample, the Days Receivable shows that the company collects customer payments within 30 days. Days Inventory indicates that the inventory is held around 20 days before being sold. At the same time, the Days Payables shows that the company pays its suppliers within 10 days. The consistent values over the forecast period suggest stability in working capital management, with efficient collection and inventory turnover. However, shorter days payables than days receivables may indicate cash flow constraints, as the company pays its suppliers faster than it collects payments. It could impact liquidity, making it a less favorable sign for investors looking for strong cash management practices.




























Step 7 – Forecast your Debt Balance
Forecasting debt obligations is about strategically managing both current and future debts to ensure that your financial standing remains stable while supporting your business’s growth objectives. In this step, you evaluate your existing debt structure, assess repayment requirements, and determine opportunities for acquiring new financing under favorable conditions. Planning drawdowns and withdrawals, assessing debt capacity, and managing debt service are integral components of debt management strategy.
First, it’s crucial to identify the debts currently on your balance sheet. It includes loans, credit lines, and any outstanding bonds. You need to examine repayment terms, due dates, collaterals, and covenants carefully. The next step involves evaluating whether additional debt financing is feasible or necessary. Analyze your current debt service coverage ratio. DSCR is a key metric used to assess a company’s ability to meet its debt obligations, calculated by dividing the available cash flow by the debt service (principal and interest payments). Overleveraging can increase risk, especially during economic downturns, while under-leveraging might mean you need to utilize growth opportunities fully. Moreover, negotiate better rates and select the most cost-effective options for your business. The interest rate on new or existing debt significantly impacts your cost of borrowing and, thus, your profitability.
Understanding debt capacity allows businesses to determine the maximum amount of debt they can sustainably carry without adversely affecting operations or creditworthiness. Efficient debt service planning, which includes managing the timing of interest and principal repayments, is key to maintaining a healthy cash flow, meeting obligations promptly, and avoiding liquidity crunches that could jeopardize the business’s financial health.
Sample Debt Service Coverage Ratio Calculation
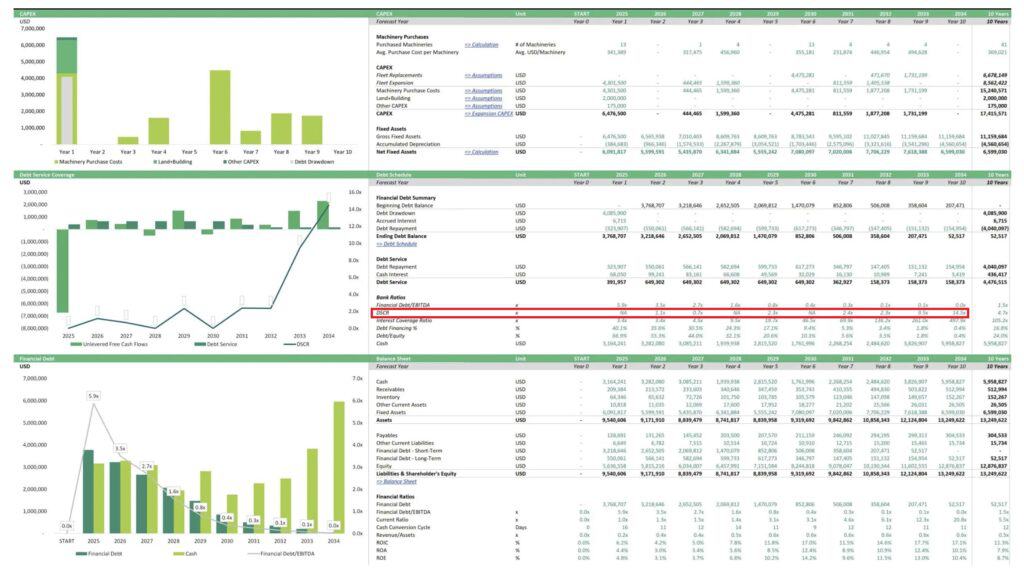
This Debt Service Coverage Ratio (DSCR) from theDebtt Schedule section of a Construction Machinery Rental Company Financial Model shows significant fluctuations over the 10-year projection period. In the initial years (Year 1 – Year 5), the DSCR is below 1, indicating that the company does not generate enough cash flow to fully cover its debt obligations, meaning that the company may struggle to make timely debt payments during this time. However, starting from Year 6, the DSCR consistently exceeds 1, with Year 10 showing a DSCR of 14.5, implying that the company generates substantial cash flow relative to its debt obligations. A DSCR above 1 generally means the company can comfortably pay its debt. At the same time, higher values suggest potential capacity for taking on more debt if needed, as it demonstrates strong financial health and debt repayment capability.
Step 8 – Tax Planning
Tax planning is crucial to financial planning because it helps individuals and businesses minimize their tax liabilities, allowing them to retain more of their earnings and enhance their wealth. By strategically managing income, expenses, investments, and deductions, effective tax planning enables more efficient allocation of resources, leading to improved financial outcomes. It ensures taxpayers use all available tax benefits, such as credits and deductions while aligning their financial decisions with long-term goals like retirement, education funding, or business expansion. Ultimately, tax planning reduces financial stress and helps optimize cash flow, build financial resilience, and achieve greater financial freedom.
Tax Planning Steps
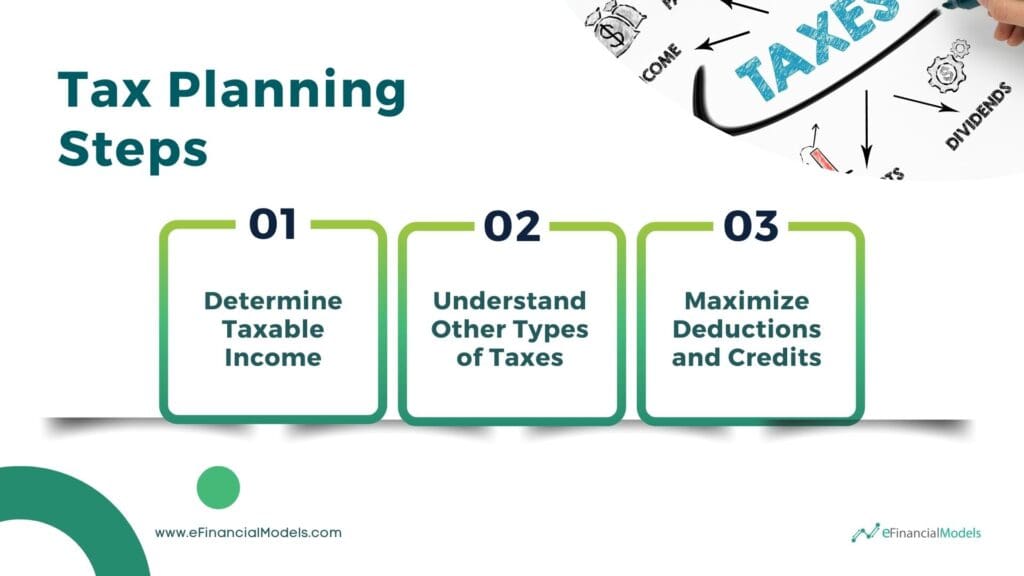
- Determine Taxable Income: Your income tax liability depends on your total taxable income, which includes wages, business income, capital gains, and even passive sources like rental income. Calculating taxable income after deductions and exemptions allows you to understand better what you owe. Understanding the tax rates that apply to different income levels is important. In most countries, tax systems are progressive, meaning higher income is taxed at higher rates. Knowing the brackets you fall into helps you make more informed decisions about managing and reducing your taxable income effectively. Use an income tax calculator or consult a tax professional to estimate how much you must pay.
- Understand Other Types of Taxes: You might have to pay beyond income tax. Being aware of these taxes allows you to manage and reduce your overall tax burden:
- Capital Gains Tax: If you sell investments such as stocks, bonds, or property, you may incur capital gains taxes. These rates can vary depending on how long you have held the set—short-term gains are generally taxed at higher rates than long-term gains.
- Property Taxes: Property taxes are a significant cost to consider if you own real estate. These taxes are based on the value of your property and are used to fund local services such as schools and infrastructure. Understanding property taxes can help you make decisions when purchasing or selling property.
- Sales and Use Taxes: Depending on your location, sales and use taxes can be a considerable expense, especially for major purchases. Being aware of these can help you make smarter buying decisions.
- Maximize Deductions and Credits: With a comprehensive understanding of the different types of taxes, it becomes easier to adopt tax strategies that work in your favor. Identify tax deductions and credits you are eligible for. Credits are especially valuable as they directly reduce your tax bill. Consider the tax implications of your investment holding periods to take advantage of favorable long-term capital gains rates. Holding assets for longer can reduce taxes on any potential gains.
Tax planning is a crucial step in your financial planning checklist to ensure you are well-prepared for your tax responsibilities while making the most of available opportunities to reduce them.
Step 9 – Quantify Investment Metrics from Financial Plan
Investing is critical to financial planning because it helps your money grow, outpacing inflation and building wealth over time. These investments include stocks, bonds, mutual funds, real estate, or even business reinvestment, such as upgrading equipment or expanding operations. Quantifying investment metrics allows individuals and businesses to evaluate their investments’ potential performance and risk. They are powerful tools that provide a quick snapshot of the attractiveness of a financial plan. By assessing key financial metrics, you can understand the feasibility and profitability of their investment opportunities. They provide valuable insights into cash flows, returns over time, and the amount of risk involved, enabling sound decision-making and prioritization of investments that align with their financial goals.
Key Financial Metrics to Measure Investment Success
Calculating key metrics is essential before putting money into investments. They provide measurable benchmarks that help track progress over time. Without these metrics, financial planning lacks clarity and direction, making it difficult to determine whether your business is on the right path. Key metrics enable proactive identification of potential issues, guide necessary adjustments, and ensure that your financial strategy remains focused on achieving the desired outcomes. Let’s break down each of the key financial metrics to measure investment success:
- Net Present Value: Net Present Value (NPV) is a financial metric used to assess the profitability of an investment by calculating the difference between the present value of cash inflows and outflows over a certain period. NPV considers the time value of money, meaning that it adjusts future cash flows to their value today. A positive NPV indicates that an investment is expected to generate more value than its cost, making it a favorable opportunity. Conversely, a negative NPV suggests that the project may not cover its costs, signaling a potentially risky investment.
- Internal Rate of Return: Internal Rate of Return (IRR) represents the discount rate at which the net present value of an investment’s cash flows equals zero. Essentially, IRR indicates the average annual return expected from an investment, expressed as a percentage. It is particularly useful when comparing different investment opportunities, as a higher IRR usually indicates a more attractive investment.
- Cash-On-Cash Yield: Cash-On-Cash Yield, also known as the cash-on-cash return, measures the cash income generated by an investment relative to the amount of capital invested. Cash Yield is calculated by dividing the annual cash flow by the initial investment, providing investors with an idea of how much cash they are earning on their investment each year. This metric, often expressed in percentage, is particularly helpful in assessing the short-term income potential of an investment.
- Payback Period: The Payback Period is the amount of time it takes for an investment to recover its initial cost. It is a straightforward metric that helps investors understand how quickly they can recoup their investment. The shorter the payback period, the less risky the investment is perceived as the capital is recovered faster.
- Cash-On-Cash Multiple: Cash-On-Cash Multiple, also known as the equity multiple, measures an investor’s total cash return relative to their initial investment. It is calculated by dividing the total cash inflows from the investment by the initial cash outlay. For example, a cash multiple of 2x means the investor doubled their initial investment. This metric simply measures how much an investment returns in total, regardless of how long it takes to realize those returns. It makes it valuable for assessing overall profitability rather than the speed of returns.
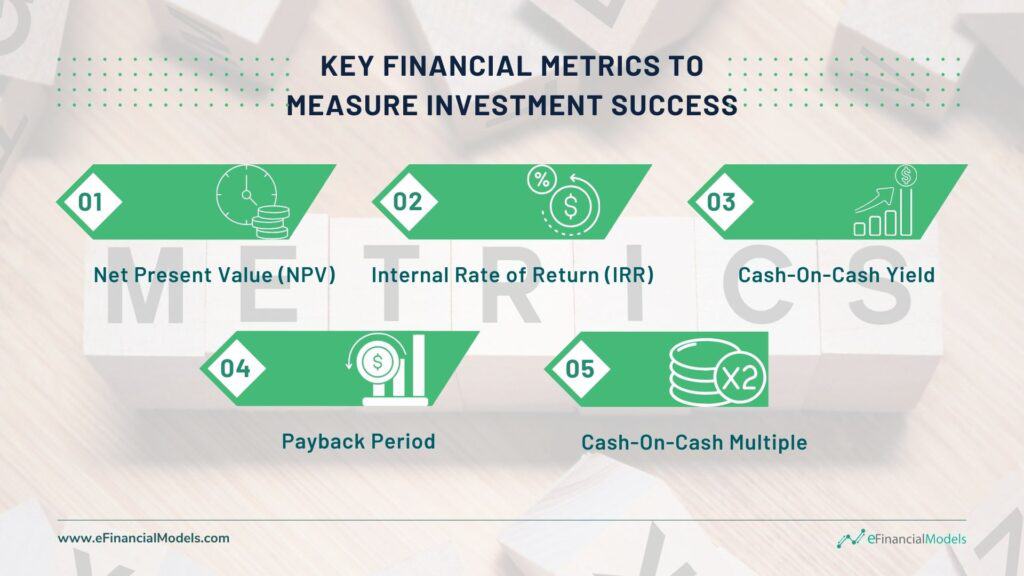
These metrics help investors determine whether an investment is worth pursuing by providing different perspectives on profitability, risk, and the time required to achieve returns.
Sample Financial Metrics Calculation
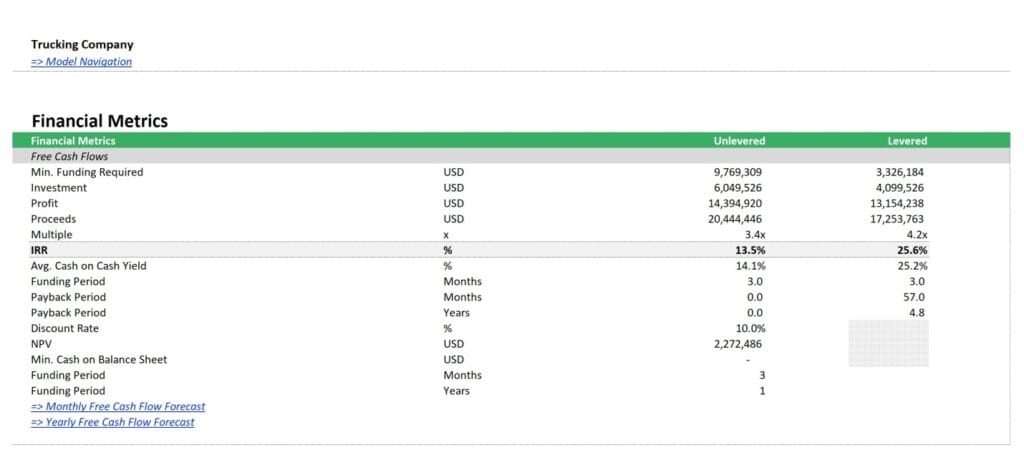
The financial metrics calculation for this Trucking Company Financial Model includes key indicators such as NPV, IRR, Cash-On-Cash Yield, and Payback Period. The NPV measures the profitability of future cash flows discounted at a given rate, here yielding a value of $2,272,486, highlighting the potential profitability. The IRR shows the return percentage on the project, with an unlevered IRR of 13.5% and a levered IRR of 25.6%, reflecting improved returns when leverage is used. The average Cash-On-Cash Yield, a measure of cash flow returns to investors, indicates returns of 14.1% (unlevered) and 25.2% (levered). The Payback Period shows how quickly the investment will be recovered, with a levered payback in 4.8 years. Including these metrics is vital in financial planning because they provide a comprehensive view of profitability, investment risks, return expectations, and liquidity, helping stakeholders make informed decisions about the viability of the trucking project.
Step 10 – Study for Action
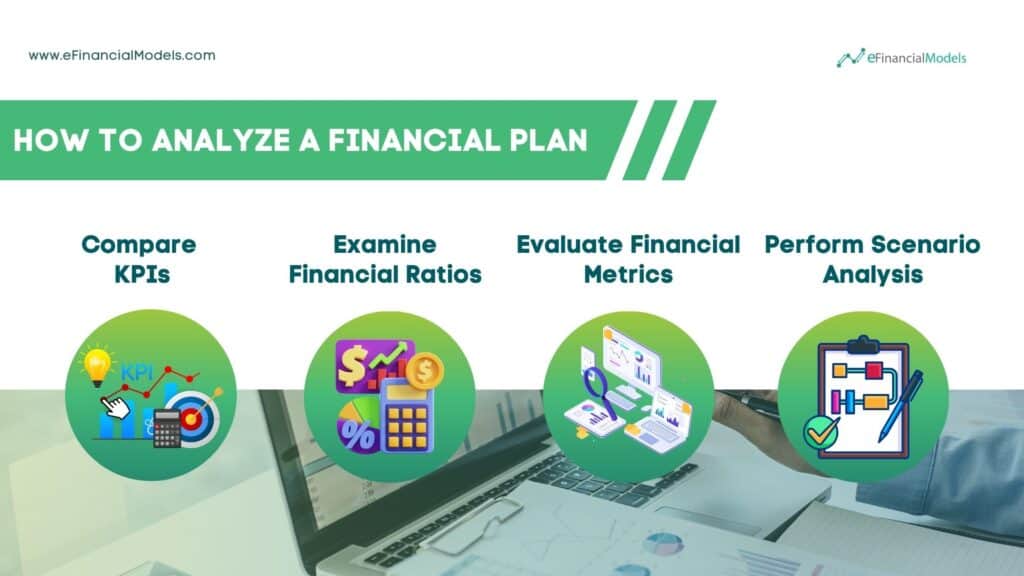
The final step in our financial planning checklist is to analyze your annual financial plan. It is crucial to assess its feasibility and robustness before implementation. It involves a detailed plan analysis by benchmarking key performance indicators (KPIs) against industry standards and conducting scenario analysis to prepare for future outcomes.
Compare your financial plan to key performance indicators (KPIs) that similar companies in your industry use. This benchmarking helps you gauge whether your targets are realistic, ambitious, or need adjustment. For example, compare metrics like customer acquisition cost, EBITDA margin, gross margin, or return on equity to ensure your projections align with peers. This comparison also allows you to identify strengths and weaknesses relative to industry norms, giving insight into areas where you may need to improve or focus additional resources.
Examining financial ratios is also important, as these ratios provide a snapshot of a company’s financial health, efficiency, and performance. You can gain valuable insights into the business’s ability to meet its short-term obligations, generate profit, and efficiently use its assets. Financial ratios help you understand how the company compares to industry benchmarks or historical performance, making it easier to identify areas of strength or weakness.
Furthermore, evaluating financial metrics provides quantitative measures of a company’s operational efficiency, profitability, and overall financial health. They enable stakeholders to assess how effectively the business executes its strategy and whether it is on track to achieve its financial objectives. By comparing these metrics to industry standards or past performance, you can identify trends, potential problems, and opportunities for improvement.
Scenario analysis is another integral part of this step. It involves creating different financial projections based on possible future scenarios, such as changes in market conditions, economic downturns, or significant growth opportunities. Doing so lets you see how different variables would impact your financial outcomes and prepare contingency plans. Scenario analysis ensures that your action plan is flexible and capable of navigating uncertainties, thus enabling your business to adapt and thrive under varying circumstances.
Sample Scenario Analysis
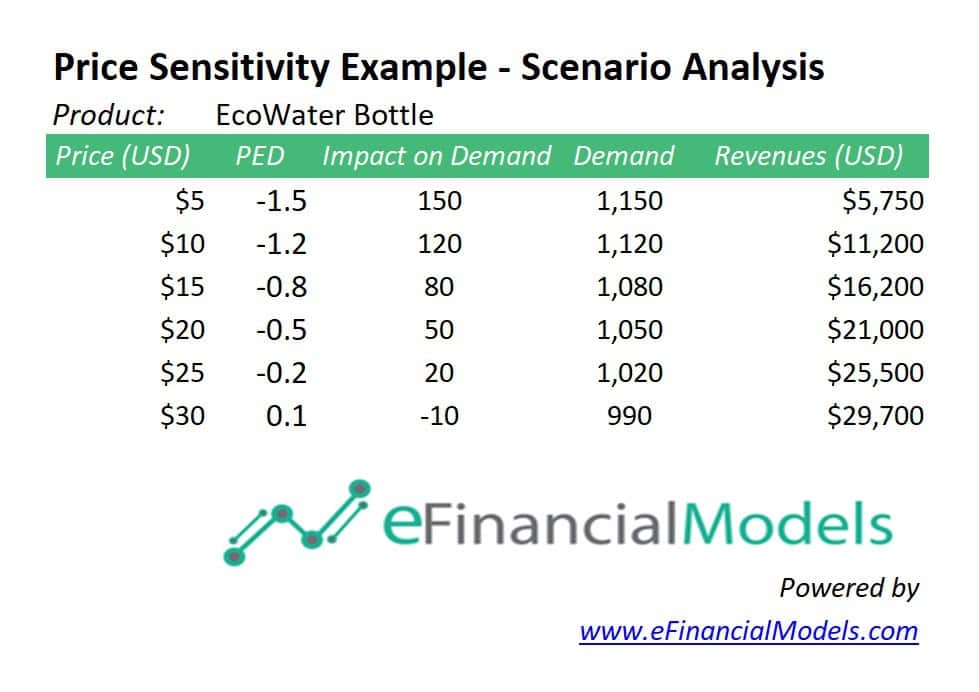
This Price Sensitivity Example – Scenario Analysis illustrates how different price levels impact demand and revenue for the EcoWater Bottle product. The analysis displays price points ranging from $5 to $30, their corresponding Price Elasticity of Demand (PED), the impact on demand, and resulting revenues. The PED becomes less negative as the price increases, indicating a decrease in demand responsiveness to price changes. From this analysis, a price of $30 yields the highest revenue at $29,700, suggesting it is the optimal price point in this scenario. Using such price sensitivity analysis as part of the final step in a financial planning checklist helps businesses determine the most profitable pricing strategy, ensuring that financial goals are met by aligning price with demand dynamics.
Your 10-Step Financial Planning Guide
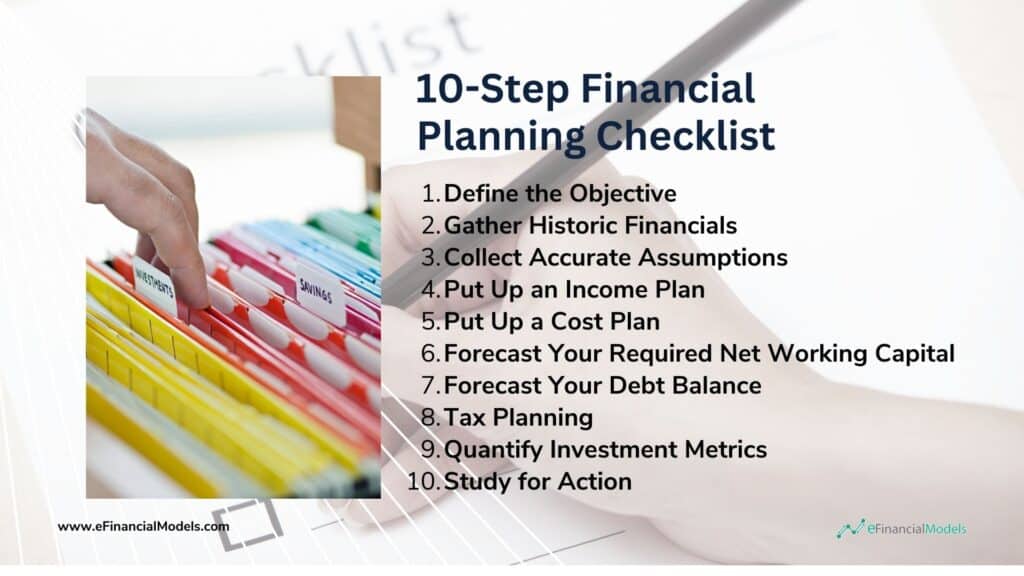
Wrapping up your journey through the 10-step financial planning guide, you can see how each step builds upon the last to create a well-rounded financial strategy. These steps are the foundation of effective financial management, from defining your objective and gathering historical financials to accurately inputting assumptions and laying out a clear income and cost plan. Thoughtful investment decisions, refining net working capital, and managing debt obligations come next, allowing for balanced growth and increased liquidity. These efforts culminate in strategic tax management to minimize liabilities while complying with regulations, and ultimately, the guide encourages taking action based on thorough preparation.
Financial planning is a journey rather than a one-time event, and this 10-step guide aims to equip you with the right tools to navigate it confidently. Each step connects to the broader picture, ensuring your finances align with your objectives, whether expanding your business, securing a comfortable retirement, or managing day-to-day cash flow more effectively. Remember, the most successful financial plans don’t just sit on a shelf – they evolve as circumstances change, allowing you to remain proactive and prepared.
Financial Modeling: Key to an Effective Financial Planning Checklist
A solid annual financial plan is essential for steering your business toward success, but financial modeling brings this plan to life. Financial models provide the numbers behind the strategy, allowing you to test different scenarios, measure outcomes, and make data-driven adjustments. For entrepreneurs, finance professionals, and investors, mastering financial modeling is the key to effective financial planning—it translates vision into action and ensures that decisions are grounded in reality. Embrace financial modeling as your guide, and watch your business thrive in uncertainty.
Our 10-Step Financial Planning Checklist for Smart Investors offers a structured approach to building an effective financial plan. You can develop a comprehensive financial strategy that drives success by refining assumptions, detailing revenue sources, adjusting profit-sharing strategies, and adding key metrics. This checklist helps investors stay proactive, align their financial goals with their business strategy, and ultimately make well-informed decisions that enhance long-term growth and stability.
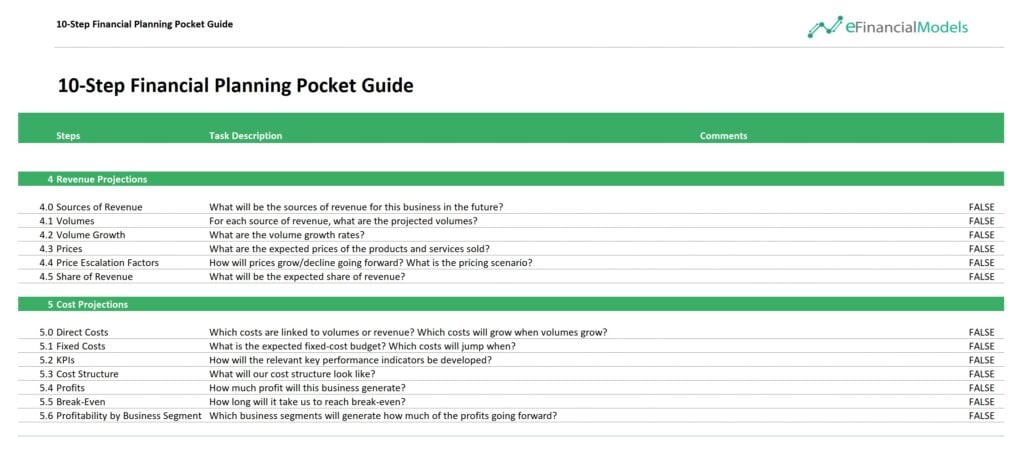
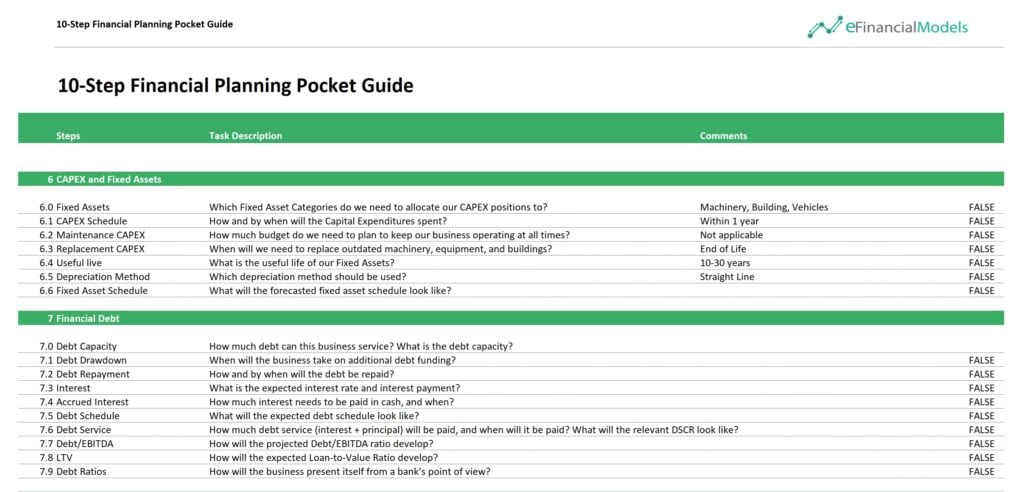
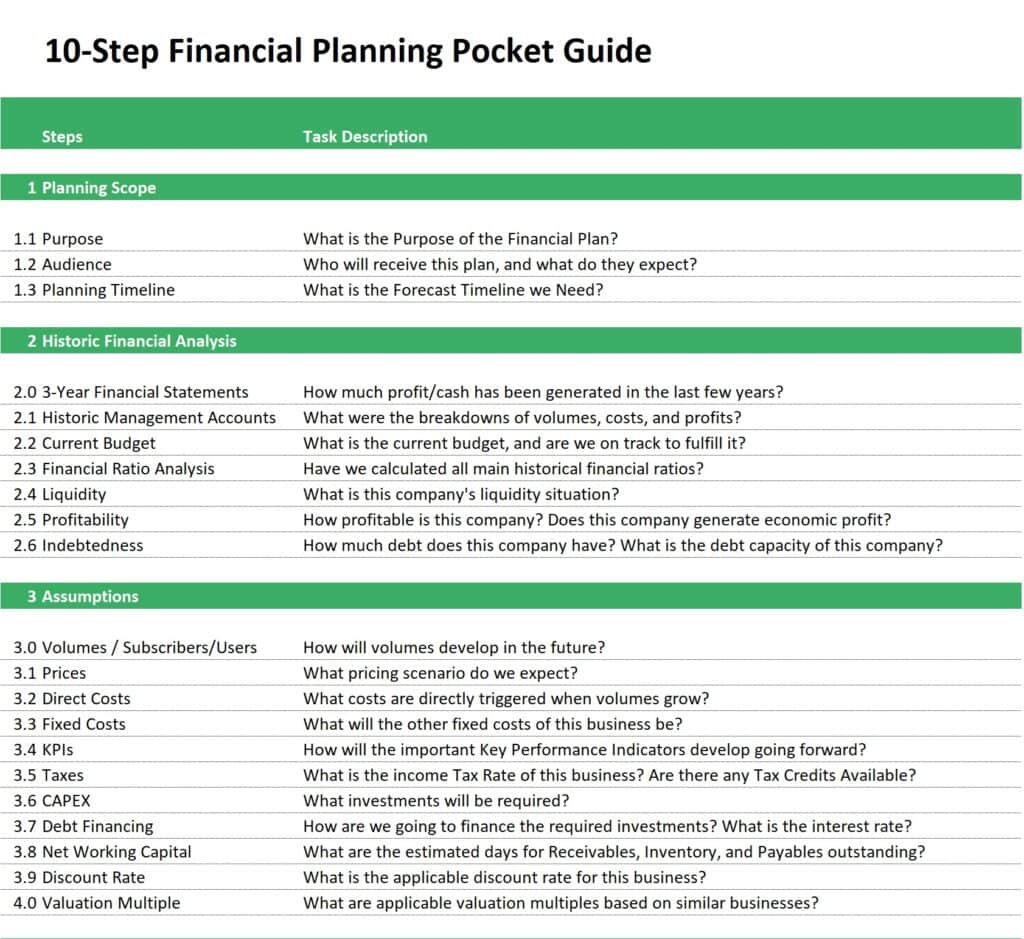
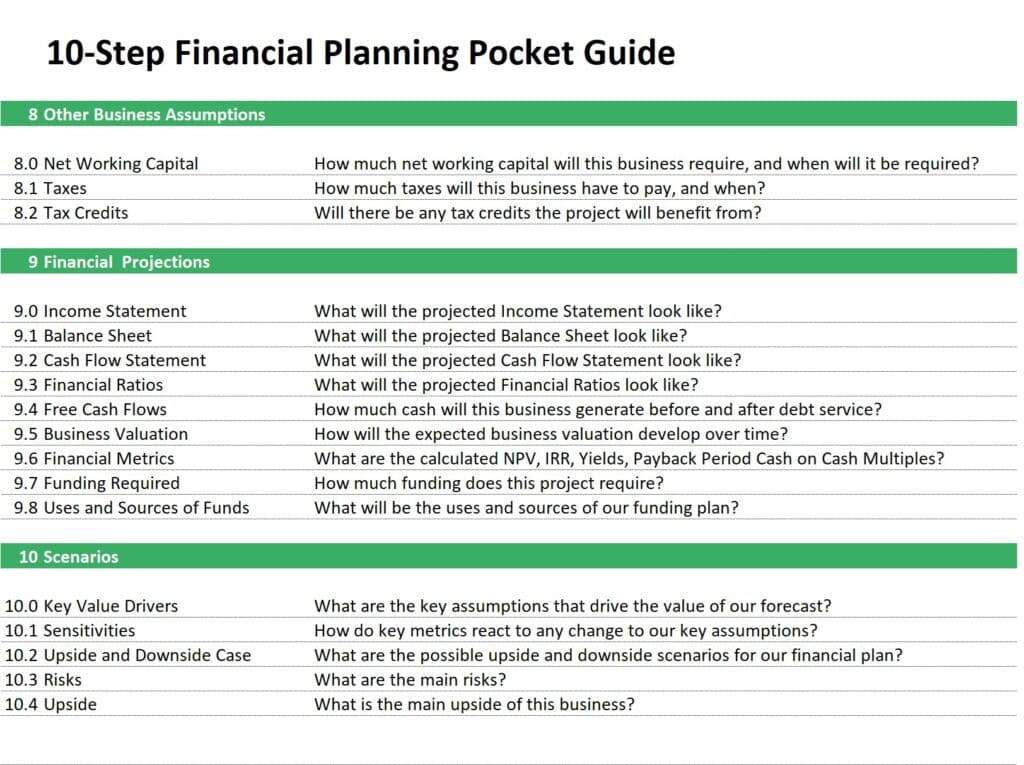
Enhance your financial planning further with our “10-Step Financial Planning Pocket Guide” — a comprehensive guide covering budgeting, forecasting, capital allocation, and more.

You might also like:
- 10 Main Elements of a Business Plan
- 10 Tips to Develop a First Class Business Valuation Report
- 10 Ideas to Increase Average Revenue Per User
- 5 Practical Tips to Help Raise Funds For Startups
- Financial Planning for Small Business Owners – Taking an SBA Loan
- Budgeting
- Financial Model Templates Easy to Use
- Scenario Analysis
- Business Valuation
- Financial Planning
- Finance Terms & Abbreviations
- Master the Free Cash Flow Formula for Smarter Financial Decisions
- Developing a 5 Year Financial Projection Template
- Why Financial Forecasting Models Are Vital for Your Business
- How to Use Excel for Financial Analysis?
- Understanding the Debt Service Coverage Ratio: An Essential Metric for Financial Analysis
- Steps to Building Financial Models in Excel
- 10-Step Financial Planning Pocket Guide
- Achieve Financial Success By Knowing Your Business Plan Model
- Financial Projections Templates – The Easy Way