
0 ITEMS

Is IRR the Same as the Discount Rate?

Understanding the difference between internal rate of return (IRR) and discount rate is key to making smarter investment decisions.
- IRR shows the break-even return rate where a project’s net present value (NPV) equals zero, indicating profitability.
- The discount rate reflects the opportunity cost of capital and the risks associated with future cash flows.
- Comparing IRR to the discount rate helps determine if an investment exceeds the minimum required return.
- IRR is used to rank projects, while the discount rate guides valuation and feasibility assessments.
Knowing how to calculate and interpret these metrics improves capital budgeting and long-term planning.
The Concept of IRR and Discount Rate
The IRR and discount rate are often confused. While they share a conceptual link, their functions differ fundamentally.
At its core, the Internal Rate of Return (IRR) represents the rate at which a series of cash flows’ net present value (NPV) equals zero. It is the break-even rate of return for an investment. Mathematically, IRR is calculated iteratively, as it cannot be derived from a closed-form equation. IRR is a benchmark for evaluating expected returns against a hurdle rate target. Investments with an IRR higher than the hurdle rate are considered financially viable. As such, IRR significantly influences capital budgeting decisions and investment analysis.
The discount rate is the annual percentage used to calculate the present value of future cash flows in a discounted cash flow (DCF) analysis. It represents the investor’s opportunity cost of capital, incorporating risk factors and financing costs. It reflects the time value of money and associated risks. Depending on the context, it might represent the weighted average cost of capital (WACC), a risk-free rate, or an investor’s required rate of return. Its role is paramount in determining NPV and assessing investment viability.
The IRR and discount rate are closely connected because they both influence investment decisions. Comparing the IRR and discount rate helps determine whether expected returns justify the risks and costs. When the discount rate is lower than the IRR, the investment typically adds value. If the discount rate exceeds the IRR, the project may not be worthwhile.

How Does IRR Work
IRR functions as an internal benchmark for determining an investment’s profitability. It offers a universal metric for investment attractiveness, making it a go-to tool for financial professionals. It is calculated iteratively by solving for the discount rate that equates the NPV of cash flows to zero. IRR shines in capital budgeting. It allows decision-makers to rank projects, prioritize investments, and benchmark performance. Its straightforward interpretation—expressed as a percentage—makes it accessible to a wide audience.
A good IRR generally exceeds the discount rate of 2% – 5% for low-risk projects, 5 – 10% for medium-risk projects, and over 10% for high-risk projects. However, IRR alone isn’t enough; a project with a modest IRR but high NPV can outweigh one with a high IRR and low NPV. Always evaluate IRR alongside NPV and other metrics for better decision-making.
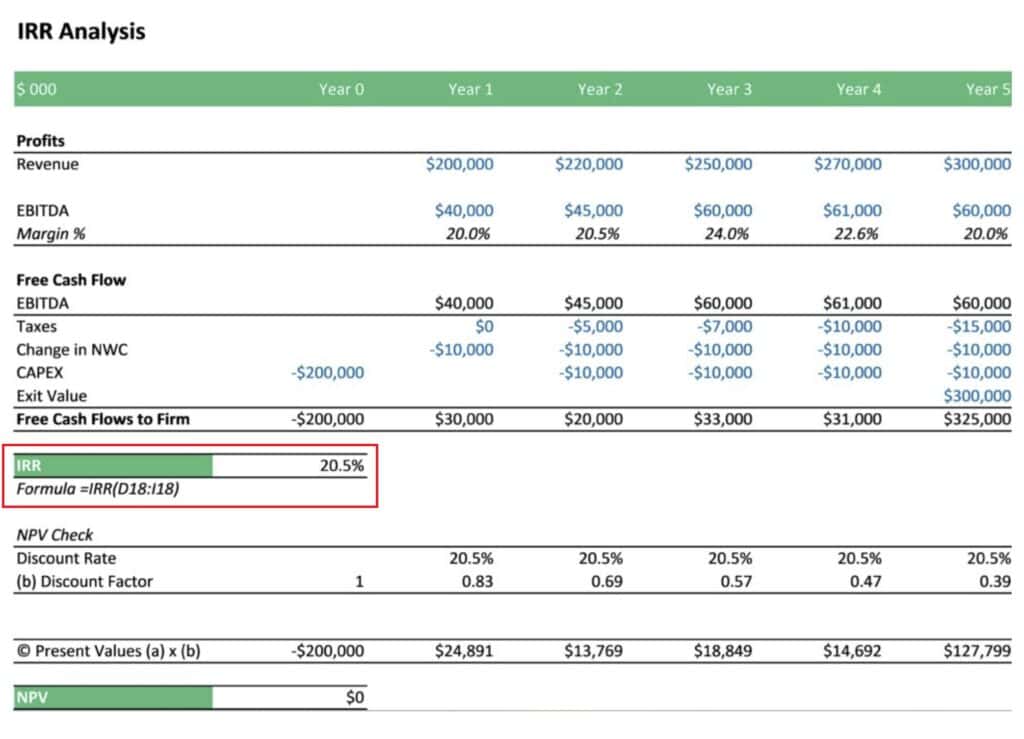
The IRR (Internal Rate of Return) Analysis in the chart above shows the rate at which the project’s cash flows bring the Net Present Value (NPV) to zero. It starts with an initial investment of -$200,000 and tracks free cash flows over five years, including profits, taxes, and other changes. By finding a discount rate of 20.5%, the present value of all future cash flows equals the initial investment, achieving an NPV of $0. This percentage helps assess whether the investment generates enough return compared to the expected hurdle rate.
How Do You Calculate a Discount Rate
For startups and new ventures, modeling an appropriate discount rate is vital when evaluating the viability of high-risk, high-growth initiatives. Considerations include:
- Early-stage risk factors like unproven business models
- High costs of various funding stages, from angel to venture capital
- Prevailing market conditions that may limit funding
New ventures may apply a 20-30% discount rate when projecting future cash flows. Setting an accurate rate helps determine if projections justify pursuing an opportunity, given the substantial capital requirements and execution risks.
Discount rates are commonly calculated using the Weighted Average Cost of Capital (WACC) formula:

Where:
- Equity Weight is the proportion of total capital funded by equity. It calculates equity’s share in capital by multiplying its percentage by the cost of equity.
- Debt Weight is the proportion of total capital funded by debt. It measures debt’s role in funding by multiplying its share by the cost of debt and adjusting for taxes.
- The Cost of Equity is the return expected by equity holders.
- The Cost of Debt After Tax is the interest rate on debt adjusted for the tax shield.
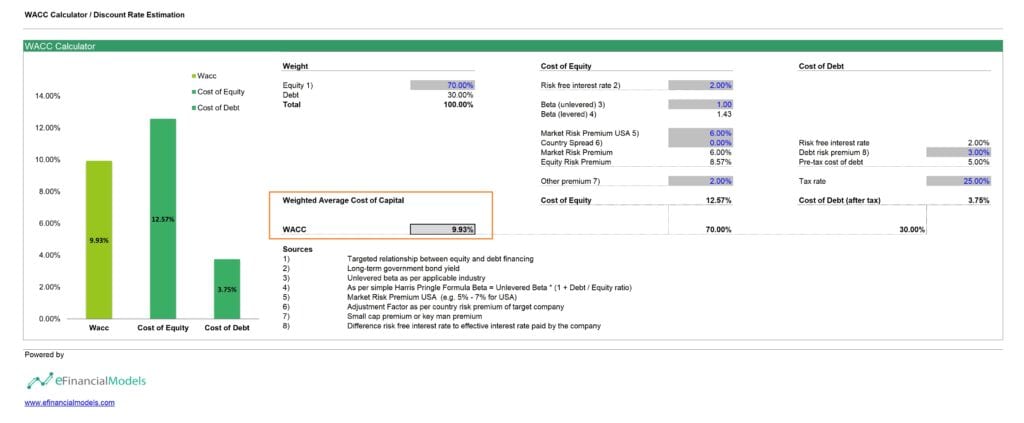
The above chart shows how to calculate the discount rate using the Weighted Average Cost of Capital (WACC) formula. The WACC blends the cost of equity and debt, weighted by their respective proportions in the company’s capital structure. By multiplying these costs by their weights (equity at 70% and debt at 30%) and summing them, the WACC is calculated as 9.93%, the discount rate.






















































IRR vs. Discount Rate: Key Differences
Understanding the difference between the IRR vs. discount rate is essential for sound financial decision-making. Recognizing how these concepts align and differ can help businesses make smarter investment choices and prioritize projects effectively.
Application
Application of the IRR vs. discount rate lies in decision-making. The internal rate of return (IRR) is a measure to evaluate the profitability of an investment. It identifies the break-even rate where the net present value (NPV) becomes zero. The discount rate, on the other hand, represents the cost of capital or the required rate of return. It is used to discount future cash flows to their present value, ensuring they meet investor expectations. In general, IRR helps determine if a project’s return exceeds the cost of capital; the discount rate is a benchmark to assess the present value of future cash flows, guiding investment viability and priority.
Businesses use the Internal Rate of Return (IRR) to evaluate and compare investment opportunities. IRR measures the rate a project breaks even regarding net present value (NPV). It helps decision-makers rank projects by profitability. For example, if two projects have similar costs but different IRRs, the one with the higher IRR is often chosen. IRR is a go-to metric for quick, side-by-side analysis of competing investments. In contrast, the discount rate is a foundational tool in financial modeling. It represents the expected cost of capital or required return for an investment. Businesses use it to calculate the NPV of future cash flows, helping to assess a project’s value over time. Unlike IRR, which focuses on profitability ranking, the discount rate sets the benchmark for acceptable returns. It’s essential for evaluating the feasibility of long-term projects and aligning them with the company’s financial goals.
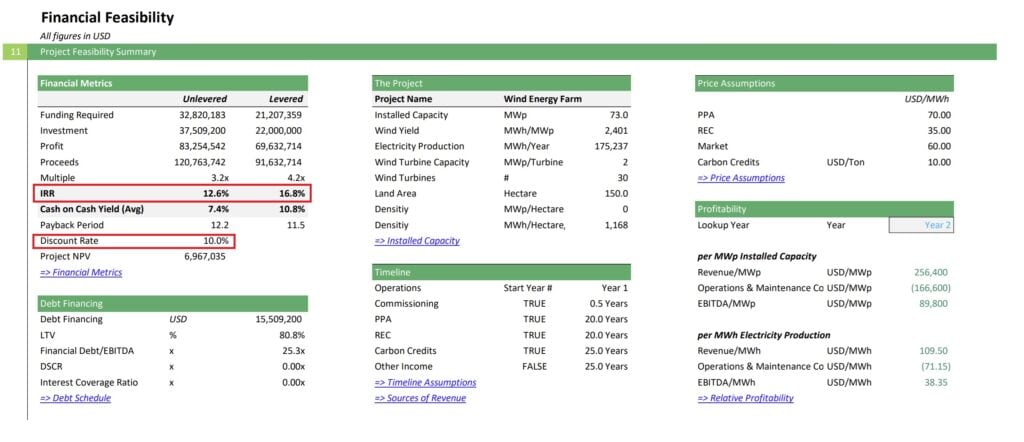
Applying the IRR vs. discount rate is pivotal in decision-making for investment projects. The chart above is from a Wind Energy Farm Financial Model. The levered IRR of 16.8% surpasses the discount rate of 10%, indicating the project’s return exceeds the cost of capital, making it an attractive investment. The discount rate, representing the required rate of return or the cost of capital, ensures the discounted future cash flows align with investor expectations. By comparing the IRR to the discount rate, stakeholders can gauge whether the project’s returns justify the investment risk and prioritize it among competing opportunities.
Calculation
Calculating IRR vs. Discount Rate uses different formulas. The Internal Rate of Return (IRR) is the discount rate that makes the net present value (NPV) of all cash flows from a project equal to zero. IRR focuses on finding a percentage rate of return where the present value of cash inflows matches the initial investment. The Discount Rate, on the other hand, represents the cost of capital or the minimum return required by investors. It is used to calculate the present value of future cash flows. Unlike IRR, which is derived from the cash flows, the discount rate is predetermined.
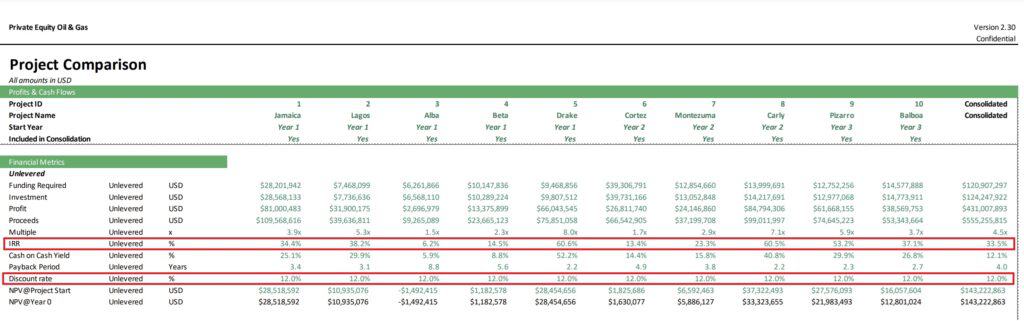
The chart above is from a Private Equity Oil and Gas Financial Model. The Internal Rate of Return (IRR) is calculated by identifying the discount rate that sets cash flows’ net present value (NPV) to zero. It measures the project’s profitability based on projected cash flows over time. Conversely, the discount rate is predetermined and reflects the expected return or the cost of capital used to evaluate the project’s feasibility. A higher IRR vs. discount rate shows the potential return, while the discount rate ensures it exceeds the firm’s required threshold.
Nature
The natural difference between IRR vs. discount rate is that the investment’s internal cash flows drive IRR, while external market factors influence the discount rate. The internal rate of return reflects the investment’s intrinsic performance. It is determined by the cash flows generated by the project. It starts by identifying the investment’s initial cost and future cash flows. If cash inflows exceed outflows at a certain rate, that rate is the IRR.
The discount rate, on the other hand, comes from external factors like market conditions, risk profiles, and opportunity costs. The discount rate combines the costs of equity and debt, weighted by their proportions in the company’s capital structure. The result reflects a company’s average rate to finance its operations, balancing equity and debt. It reflects the broader economic environment and the investor’s expectations, making it a market-driven metric.
Purpose
The Internal Rate of Return (IRR) evaluates an investment’s profitability. It calculates the rate at which cash flows’ net present value (NPV) equals zero. IRR helps determine how well a project might perform by expressing potential returns as a percentage. Investors use IRR to compare multiple projects and choose the one promising the highest return. It highlights the growth potential of an investment, making it a critical metric for prioritizing opportunities.
The discount rate serves a different purpose. It reflects the minimum return an investor expects from a project to make it worthwhile. Discounting future cash flows to their present value ensures alignment with financial benchmarks. The discount rate helps assess whether an investment meets profitability standards or whether the risk outweighs the reward. While IRR measures growth potential, the discount rate safeguards financial feasibility. Together, they provide a balanced view of investment performance and viability.
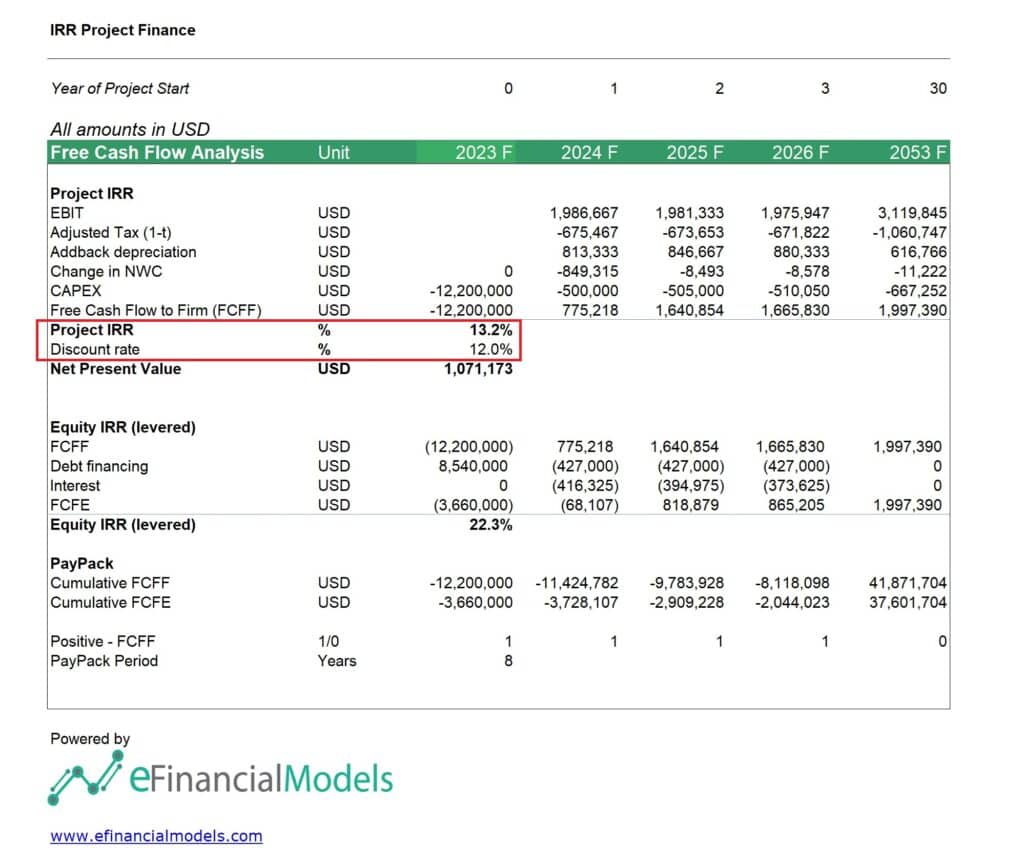
The chart above from an IRR Project Finance Analysis compares cash flows, project IRR, and equity IRR over 30 years. The Project IRR is 13.2%, exceeding the discount rate of 12%, indicating a positive Net Present Value (NPV) of $1,071,173. Leveraging debt financing boosts Equity IRR to 22.3%. IRR and the discount rate serve different purposes. IRR represents the project’s break-even return rate, while the discount rate determines the present value of future cash flows. Comparing them helps evaluate project viability—the project is considered profitable when IRR exceeds the discount rate.
Maximizing Investment Returns with the Internal Rate of Return and Discount Rate
The internal rate of return and discount rate are not the same. IRR represents the rate at which a project’s net present value (NPV) equals zero, showcasing its profitability. At the same time, the discount rate is the required rate of return used to calculate the present value of future cash flows. The IRR is a result derived from cash flow projections, whereas the discount rate is an input based on external factors like market conditions and the cost of capital.
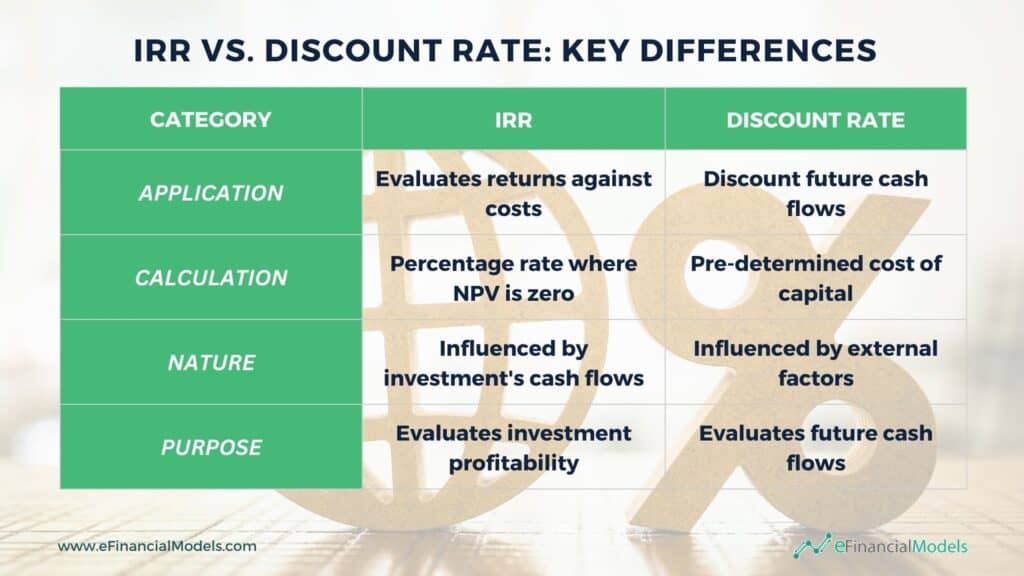
Maximizing investment returns with the internal rate of return and discount rate requires a clear understanding and strategic application. Businesses use these metrics together to evaluate project viability, with IRR signaling returns and the discount rate ensuring risks are justified. This understanding aids in smarter, more precise investment choices. Financial modeling simplifies this process by providing clear insights and actionable data. Start using financial models today to make informed choices and unlock your investments’ full potential.

















































You might also like:
- How to Value a Business Using a Discounted Cash Flow Model
- Discount Rate
- How to Calculate Net Present Value (NPV)?
- IRR vs NPV in the Context of Financial Decision-Making
- 10 Main Elements of a Business Plan
- The Key Differences Between Levered and Unlevered Free Cash Flow
- 10 Tips to Develop a First Class Business Valuation Report
- Financial Ratios Analysis and Its Importance
- Leveraged vs. Unleveraged IRR: What You Need to Know
- WACC (Weighted Average Cost of Capital)
- Financial Statements – Definition, Uses, Contents and Templates
- Calculating Revenue Growth Rate: A Key Metric for Business Success
- Top-Down vs. Bottom-Up Financial Planning: What’s the Difference?
- IRR (Internal Rate of Return)
- Financial Modeling for Startups and Small Businesses
- Show Me The Money: Financial Projections for Your Startup
- Understanding the Debt Service Coverage Ratio: An Essential Metric for Financial Analysis
- Developing a 5 Year Financial Projection Template
- Business Valuation
- Financial Planning for Small Business Owners – Taking an SBA Loan