
0 ITEMS

Why Use a Stock Analysis Template for Your Investments?

Investing in the stock market requires understanding key concepts and tools to make smarter decisions.
- The stock market involves buying and selling shares of companies through major exchanges like NYSE, Nasdaq, LSE, and TSE, with prices driven by supply, demand, and news.
- Stocks come in various types, including common, preferred, growth, value, dividend, and blue-chip stocks, each with different risk profiles and benefits.
- Building a long-term investment plan involves opening a brokerage account, researching companies, and diversifying your portfolio to manage risk.
- Analyzing stocks with financial models can forecast returns, assess risks, and help prioritize undervalued or high-potential investments.
- Using stock analysis templates improves portfolio monitoring, supports passive income goals, and guides smarter trading decisions.
Keep reading to understand how these insights can help you grow your wealth through effective stock investing strategies.
Your Stock Market Investing Guide Starts Here
Welcome to your first step into the stock market. This stock market investing guide wants to highlight that investing is not gambling. It’s a long-term financial strategy. You can grow your savings and reach big life goals with the right plan. The stock market can work for anyone—even you. Before jumping in, set a strong foundation. Know your financial goals. Make a budget. Save first, then invest. Strategic financial planning comes before smart investing.
What is the Stock Market?
The stock market is where people buy and sell shares of companies. It helps businesses raise money and gives investors a chance to earn profits. Prices go up and down based on supply, demand, and news. When you own a stock, you own part of a company. It’s a place full of risk and opportunity, where timing and knowledge matter.
Major stock market exchanges connect buyers and sellers of company shares. The biggest ones include the New York Stock Exchange (NYSE), Nasdaq, London Stock Exchange (LSE), and Tokyo Stock Exchange (TSE). Each offers a platform where public companies list their stocks for investors to trade. These exchanges help set stock prices based on supply and demand. They also ensure fair, transparent transactions. Millions of shares trade daily, fueling business growth and global investment.

Stocks come in different types, each offering unique benefits and risks. Knowing the difference helps investors match their choices to their goals. Some stocks offer growth, while others provide steady income. You can build a smarter, more balanced portfolio by understanding how each type works.
- Common stocks let you own a piece of a company and vote on important decisions. They often grow in value over time, offering strong investment returns if the company does well. However, they also carry higher risk, especially during downturns, and dividends are not guaranteed. Apple, Microsoft, and Amazon are widely held common stocks traded on major exchanges.
- Preferred stocks offer fixed dividends, which appeal to income-focused investors. They’re less risky than common stocks and get priority if the company faces financial trouble. However, they don’t come with voting rights and usually have limited price growth potential. Bank of America, Ford, and General Motors offer preferred stocks that pay fixed dividends.
- Growth stocks come from companies expanding fast. They often skip dividends to reinvest earnings. This can lead to big gains and losses if the company stumbles or the market slows down. Tesla, Nvidia, and Shopify are popular growth stocks known for rapid revenue expansion.
- Value stocks trade below their real worth and attract bargain hunters. They come from solid companies with strong fundamentals. While they can rise as prices adjust, they may take time to recover and don’t always perform well in weak markets. JPMorgan Chase, Intel, and AT&T are examples of value stocks trading below their intrinsic worth.
- Dividend stocks pay steady income, which makes them attractive for long-term investors. These companies are often stable and reliable. Still, dividends can be cut during tough times, and the stock price may grow slowly. Coca-Cola, Procter & Gamble, and Johnson & Johnson are favored dividend stocks for their regular payouts.
- Blue-chip stocks belong to big, trusted companies with proven success. They offer steady dividends and lower risk, making them a safe choice. Yet, their growth is usually slow, so they may not excite short-term traders. IBM, Visa, and Chevron are blue-chip stocks known for stability, strong reputations, and steady returns.

Understanding How Stock Investing Works
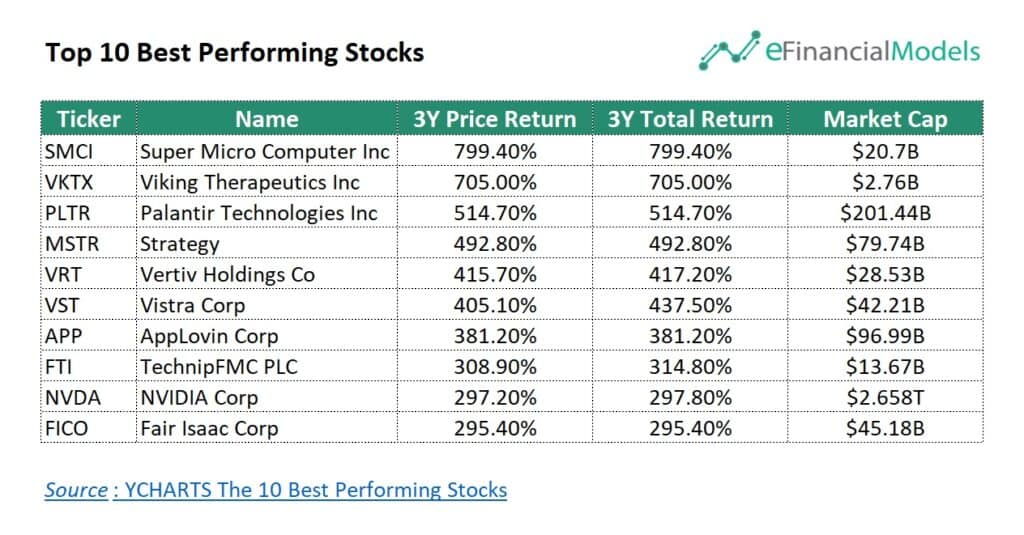
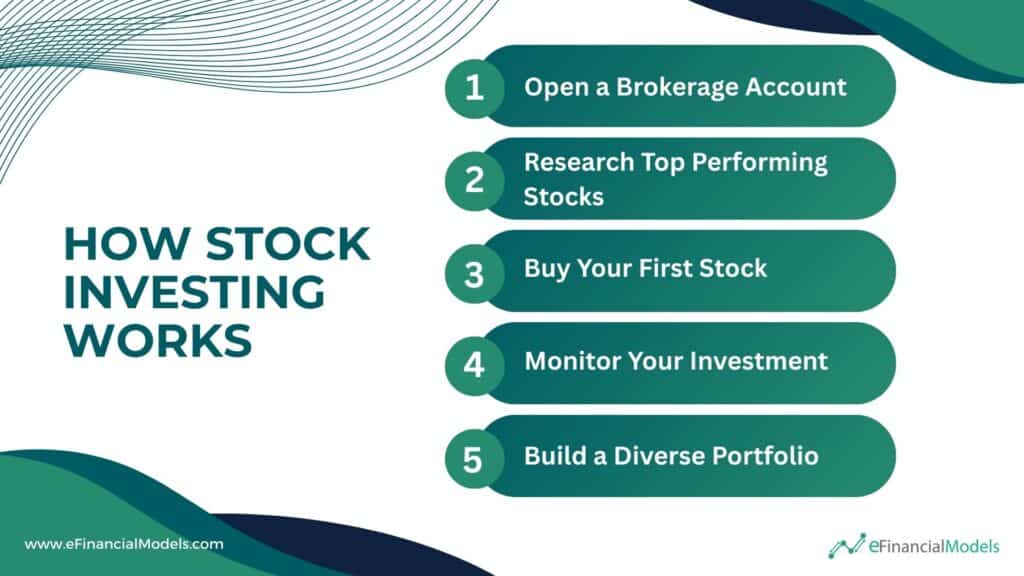
Stock investing lets you grow your money by owning a piece of a company. When the stock’s price increases and you sell it, that’s a capital gain. If the company shares its profits, you get paid dividends. The best part? Reinvesting these earnings can build wealth faster over time. Here’s an overview of how stock investing works:
Step 1: Open a Brokerage Account: To start investing, you need a brokerage account. This is like a digital wallet for buying and selling stocks. Choose a trusted online platform, sign up, and link your bank account. Once it’s funded, you’re ready to go.
Step 2: Research Top-Performing Stocks: Don’t just guess. Take time to learn about the companies you want to invest in. Look at their profits, products, and growth plans. Reading news and checking stock trends helps you make smart choices.
Step 3: Buy Your First Stock: Once you find a company you like, could you place an order to buy its stock? You can buy at the current market price or set your price. Once your order goes through, you own a share of that business.
Step 4: Monitor Your Investment: Track how your stock performs. Prices go up and down daily. Don’t panic. Focus on the company’s long-term potential. Many investors use apps to stay updated in real-time. You make money when you sell a stock for more than you paid. That’s a capital gain. Some stocks also pay dividends—extra money just for holding the stock. Reinvesting these helps your investment grow faster.
Step 5: Build a Diverse Portfolio: Don’t put all your money into one stock. Spread it across different companies and industries. This reduces your risk and gives your money more chances to grow over time. Add to your investments regularly. Even small amounts can add up. Let your money work for you, and avoid chasing quick profits.
How stock investing works isn’t a get-rich-quick game—it takes time. Prices move up and down, but real gains often come to those who wait. Long-term investors who stay calm through market swings usually end up ahead. It’s not about timing the market, but time in the market. Patience is your biggest ally. Furthermore, here’s a pro tip from our stock market investing guide. Analyzing stock market investments is essential because it helps investors make smart decisions. Without proper analysis, it’s easy to fall for hype or emotion. Financial models are powerful tools that bring clarity. They show risks, forecast returns, and test different scenarios. With a great financial model, you don’t guess—you plan. This leads to better strategies and fewer surprises.























































Why Every Investor Needs a Stock Analysis Template?
Stock investing without a clear view of the numbers is like driving blindfolded. A stock analysis template gives investors a quick, structured way to see the real story behind a company. It helps cut through the noise and focus on what truly matters—performance, potential, and value. With a consistent tool in hand, decisions become faster, less emotional, and smarter.
Quantify the True Value of Dividend Stocks
Instead of guessing, investors use real numbers—dividend yield, payout ratio, earnings growth—to spot strong income streams. A stock analysis template is essential to grow wealth with dividend stocks. It simplifies research, compares options side by side, and highlights undervalued picks. With it, investors focus on stocks that pay well and last long.
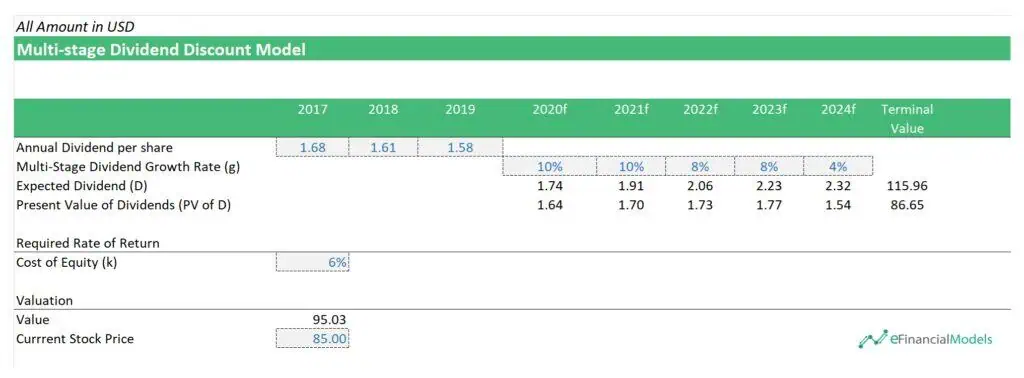
The Multi-Stage DDM chart above is from our Dividend Discount Model Excel Template, which handles stocks with change. It helps investors quantify the true value of dividend stocks by projecting dividends for multiple years with varying growth rates. As shown above, it calculates expected dividends from 2020 to 2024 and then discounts them back to their present value using a 6% cost of equity. It also includes a terminal value to account for long-term income potential. The total valuation, $95.03, is then compared to the current stock price of $85.00—highlighting whether the stock is undervalued. Such a stock analysis template gives investors a structured, data-driven way to assess whether a dividend stock is worth buying.
Forecast Long-Term Passive Income Streams
Every investor aiming for long-term passive income needs a stock analysis template. It helps you compare companies quickly, track key financials, and spot strong dividend-paying stocks. A solid stock analysis template helps you stay organized, reduce guesswork, and make decisions faster. It keeps your focus on steady growth, not short-term noise. Most importantly, it shows you which stocks can support your income goals for years to come.
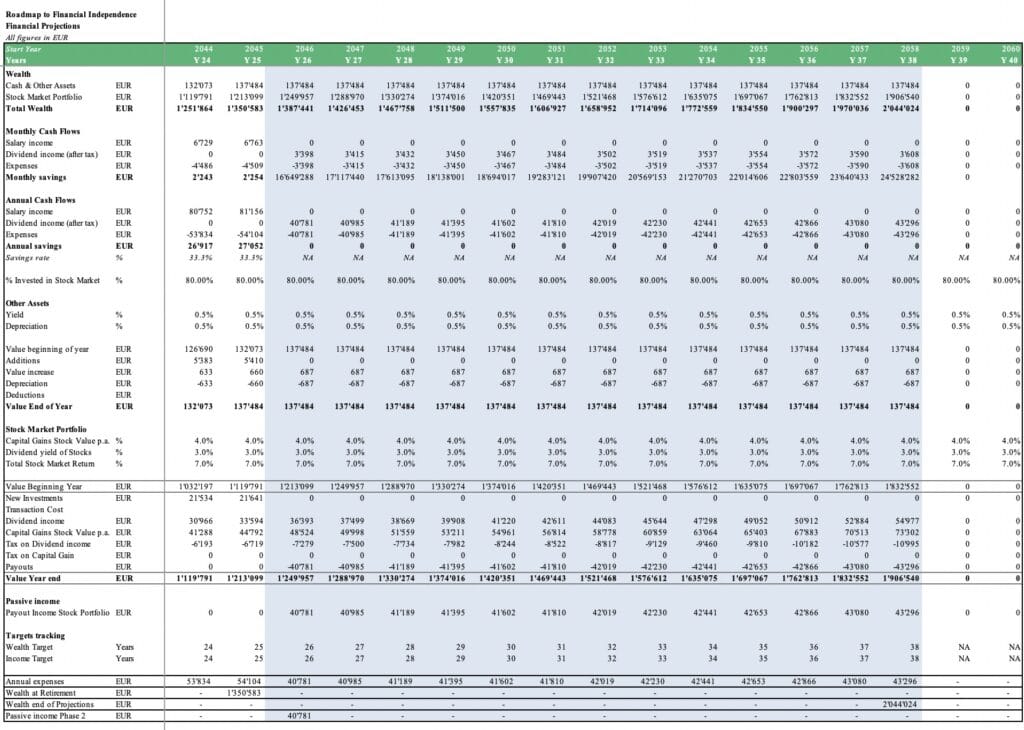
The Dividends Passive Income Model above helps forecast long-term passive income by showing how dividend payouts grow year after year. It tracks your investments, dividend yields, reinvestment effects, and tax impacts to estimate future income streams. You can clearly see when your dividend income starts covering your living expenses—turning your portfolio into a self-sustaining income source. With simple inputs and yearly projections, the template makes planning for financial freedom and steady cash flow through dividend investing easy.
Enhance Portfolio Monitoring
Every investor needs a stock analysis template to track performance and make smart decisions. It clarifies complex data, letting you see trends and risks quickly. With it, you can compare stocks, spot winners, and avoid poor choices. It also keeps your strategy focused, cutting out guesswork. Instead of relying on scattered notes or gut feelings, a solid template gives structure and saves time. Whether you’re a beginner or a pro, it’s a simple tool that sharpens your edge and helps grow your portfolio with confidence.
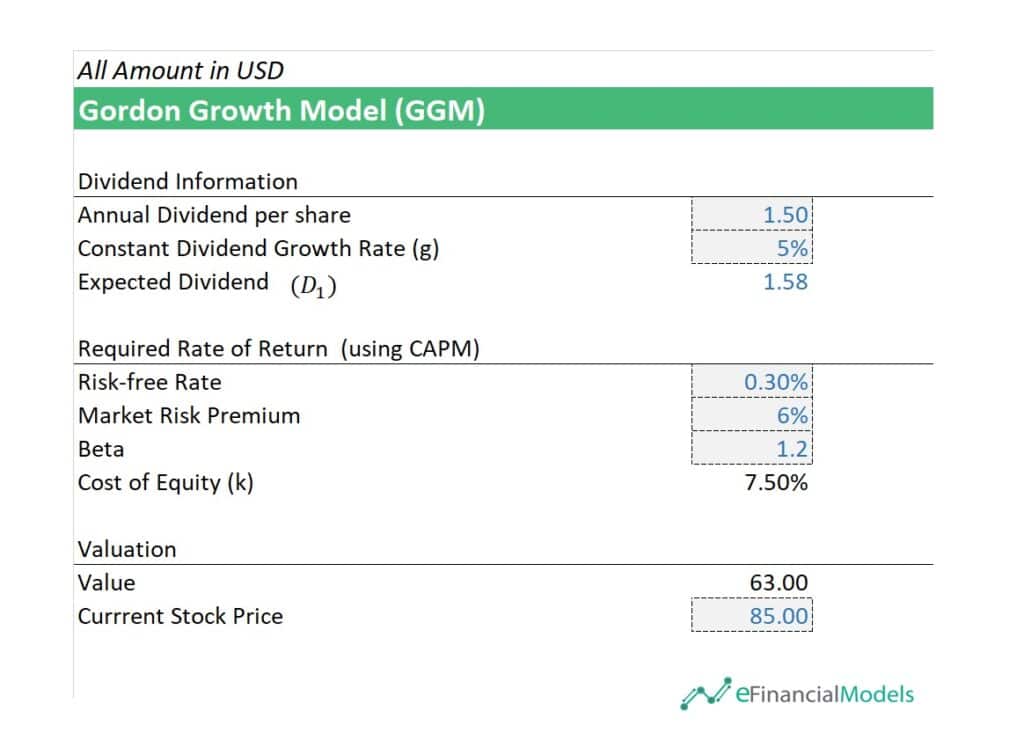
The Gordon Growth Model above is from our Dividend Discount Model Excel Template. It works as a powerful stock analysis template, turning dividend and risk data into clear valuation insights. It simplifies decision-making by showing if a stock is overvalued or undervalued—like how the calculated value ($63) is below the current price ($85). It uses real inputs like dividends, growth rates, and CAPM to estimate return needs. With just a few numbers, you get a snapshot of a stock’s worth, helping you stay alert to market mispricing and adjust your portfolio quickly. It’s an easy way to monitor long-term value, not just price swings.
Financial Modeling: Your Path to Smart Stock Investing
Using a stock analysis template simplifies smart investing. It helps you quickly measure dividend stock value, forecast passive income, and track your portfolio performance—all in one place. Instead of guessing, you get clear numbers to guide your decisions. This saves time and boosts confidence in every move you make. For any serious investor, it’s a must-have tool for long-term success.
Financial modeling puts you in control of your stock picks. It turns raw data into clear insights to spot real value, predict earnings, and avoid costly mistakes. With the right model, every decision becomes sharper and more strategic. It’s not just about tracking stocks—it’s about investing smarter, with purpose and precision.
















































You might also like:
- Why Should You Use Excel for Financial Modeling?
- Financial Modeling for Startups and Small Businesses
- Top 5 Tips For a Good Financial Due Diligence
- The Essential Guide to Calculating the Cap Rate for Real Estate Valuations
- Best in Class Property Appraisal Methods and What to Look Out for
- Creating a Budget Plan – Using the Best Excel Budget Template
- Financial Planning for Gym Startups
- Understanding the Debt Service Coverage Ratio: An Essential Metric for Financial Analysis
- The Purpose of a Financial Model
- Cash Flow Analysis
- Real Estate
- Food & Beverages)
- Financial Modeling
- Creating a Business Plan for your Food Truck Business
- Cash Flow Analysis in Excel
- Value Your Business With the EV/Revenue Multiple
- Financial Ratios Analysis and Its Importance
- Agriculture
- Business Valuation
- Financial Ratios Cheat Sheet