
0 ITEMS

Hotel Development REIT Financial Model Excel Template
The Hotel Development Financial Model helps users evaluate a hotel construction or expansion project with a structured, investor-ready financial forecast. Instead of relying on a generic real estate spreadsheet, this template is built around the economics that matter in hospitality development, including room count, occupancy ramp-up, average daily rate, RevPAR, ancillary revenue, construction costs, operating expenses, debt, cash flow, and profitability. It gives entrepreneurs, developers, consultants, analysts, and business owners a practical way to turn a hotel concept into a detailed financial plan before committing capital or approaching lenders. This financial model template is designed for business planning, funding preparation, internal budgeting, and strategic decision-making. Users can adjust revenue assumptions for rooms, food and beverage, meetings and events, parking, spa services, and other income streams while also planning startup costs, pre-opening expenses, payroll, utilities, commissions, property taxes, maintenance, and other operating expenses. The model helps connect the commercial side of the hotel with the investment and cost structure behind it, making it easier to understand whether the project can support its development budget and long-term financial goals. The template also helps users assess cash flow timing, profitability, break-even performance, and funding requirements. Hotel projects often require substantial upfront capital before operating revenue begins, so the model is useful for identifying potential cash shortfalls, estimating financing needs, and reviewing the point at which operations can begin covering costs. With editable assumptions and automated calculations, users can test different occupancy, ADR, cost, and financing scenarios to see how changes affect EBITDA, cash position, investor returns, and overall project feasibility. Built for clarity and presentation, the Hotel Development Financial Model includes structured outputs that can support loan discussions, investor meetings, feasibility analysis, and business plan documentation. It is suitable for new hotel developments, hospitality investment analysis, property acquisition planning, and expansion projects. By organizing assumptions, projections, reports, dashboards, and performance metrics in one ready-to-use model, it saves time, improves financial planning, and helps users make better decisions with a clearer view of risk, return, and operational performance.
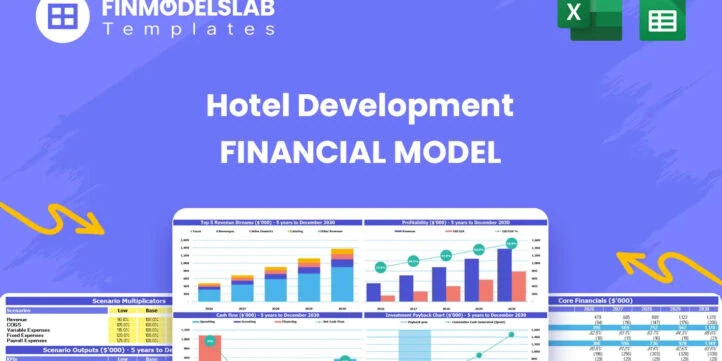


Financial Model Overview
The Hotel Development Financial Model is a ready-to-use financial model template created for planning, evaluating, and presenting a hotel construction, development, or expansion project. Unlike a generic real estate model with a hotel label added later, this template is built around the operating and investment drivers that shape hotel performance, including construction costs, room inventory, weekday and weekend average daily rates, occupancy ramp-up, RevPAR, ancillary revenue, operating expenses, payroll, debt, cash flow, and investor returns. It gives developers, entrepreneurs, consultants, analysts, and business owners a practical framework for turning a hotel concept into a structured financial forecast. Users can customize the assumptions to match a specific location, room count, service level, development budget, financing structure, operating strategy, and holding period. The result is a professional planning tool that can support business plans, feasibility studies, funding discussions, lender presentations, investor analysis, and internal decision-making. By bringing core assumptions and financial outputs into one organized model, it helps users understand how much capital may be required, how revenue may build over time, when the hotel can become profitable, and whether the projected returns justify the investment.
All-in-one Dashboard
The all-in-one dashboard gives users a centralized view of the most important inputs and outputs in the Hotel Development Financial Model. This component is useful because hotel projects involve many interconnected assumptions, from construction timing and capital expenditure to room count, ADR, occupancy, operating costs, financing, and cash flow. The dashboard brings those core drivers together so users can quickly review the status of the project without searching through every schedule in the workbook. Inputs may include development cost assumptions, opening date, available rooms, average daily rates, occupancy ramp-up, ancillary revenue assumptions, payroll levels, operating expense percentages, loan terms, and equity contributions. Outputs may include total funding required, projected revenue, EBITDA, net income, cash flow, return metrics, and key hotel performance indicators. For planning purposes, this section helps users see whether the project is financially coherent at a glance. For investor or lender conversations, it gives stakeholders a clear summary of the business case and allows them to understand the project’s financial position before reviewing the detailed schedules. Because the model is editable, users can adjust assumptions and immediately see how changes flow through the dashboard, making it a practical tool for budgeting, scenario review, feasibility analysis, and decision-making.
Low Base High Scenario Analysis
The low, base, and high scenario analysis component allows users to test how the hotel development project may perform under different market and operating conditions. Hotel performance can shift significantly depending on occupancy, average daily rate, construction cost overruns, financing costs, labor expenses, seasonality, and demand for ancillary services. This section helps users move beyond a single forecast by comparing downside, expected, and upside cases in one model. Inputs may include alternate assumptions for occupancy ramp-up, weekday and weekend ADR, food and beverage revenue, meetings and events activity, operating expense ratios, payroll levels, financing terms, and capital expenditure. Outputs can show how each scenario affects revenue, EBITDA, cash flow, cash balance, profitability, debt service capacity, return on equity, IRR, NPV, and break-even timing. This is especially useful for investors, lenders, and internal teams because it highlights the sensitivity of the project to major business drivers. A low scenario can help identify funding gaps or risk exposure if occupancy grows more slowly than expected, while a high scenario can show the upside from stronger room rates or higher ancillary revenue. The base scenario provides a practical planning case for budgets and stakeholder communication. By making scenario planning part of the model, users can prepare contingency plans, set more realistic targets, and make better decisions before capital is committed.
Professional Charts
The professional charts component turns the financial forecast into clear visual reports that are easier to understand and present. Hotel development models can contain a large amount of detailed data, including monthly revenue, annual operating expenses, construction costs, financing activity, cash flow, EBITDA, and investor returns. Charts help translate those numbers into visual trends that can be used in investor meetings, lender presentations, internal reviews, and business plan materials. Inputs for this component are pulled from the forecast schedules, including room revenue, ancillary income, operating expenses, gross profit, EBITDA, net income, cash flow, and key performance indicators. Outputs may include charts showing revenue growth over time, expense trends, EBITDA progression, cash balance movement, funding requirements, profitability trajectory, and operational ramp-up. This section is useful because stakeholders often need to understand the financial story quickly, especially when reviewing a complex hotel project with significant upfront capital requirements. Visual reporting helps show when development spending peaks, when operations begin generating revenue, how profitability improves over the forecast period, and whether the project is moving toward sustainable cash generation. For founders and developers, these charts support decision-making by making trends easier to identify. For consultants and analysts, they provide presentation-ready outputs that can strengthen client deliverables and make the model more accessible to non-financial audiences.
ROE Components and DuPont Analysis
The ROE components and DuPont analysis section helps users understand what is driving return on equity rather than simply reporting one headline return figure. In hotel development, equity returns depend on a combination of profitability, asset efficiency, leverage, operating performance, and capital structure. This component breaks return on equity into more meaningful drivers so users can see whether returns are coming from strong operating margins, efficient asset utilization, financing leverage, or other factors. Inputs may include net income, total equity, total assets, revenue, profit margin, asset turnover, debt levels, and financing assumptions. Outputs can include return on equity, margin analysis, turnover measures, leverage effects, and a clearer explanation of how the business model creates or weakens investor returns. This is valuable for project sponsors and investors because a hotel may show attractive revenue growth but still produce weak equity returns if the development cost is too high, operating margins are thin, or financing assumptions are unrealistic. The DuPont-style view encourages better decision-making by connecting operational assumptions with investment performance. Users can test whether improving ADR, increasing occupancy, reducing operating expenses, changing debt levels, or lowering construction costs has the strongest impact on ROE. This makes the model more useful for deal structuring, investor presentations, and strategic planning.
Revenue Inputs
The revenue inputs component is where users define the commercial assumptions that drive the hotel’s financial forecast. For a hotel development project, revenue is not a single line item. It is typically built from room revenue, occupancy, average daily rate, room inventory, day-of-week pricing, and ancillary services such as food and beverage, meetings and events, parking, spa services, and other guest spending. This section allows users to customize the hotel’s revenue engine based on the planned property type, market positioning, demand profile, room mix, and operating strategy. Inputs may include the number of rooms available by period, opening timeline, occupancy ramp-up, weekday ADR, weekend ADR, annual rate growth, revenue per available room assumptions, ancillary revenue categories, event space utilization, and service-specific pricing. Outputs flow into monthly and annual revenue projections, RevPAR calculations, gross revenue, departmental revenue summaries, and profitability forecasts. This component is useful because revenue assumptions determine whether the project can support its development cost, operating expenses, debt service, and expected investor return. It also helps users evaluate commercial strategies, such as increasing direct bookings, raising room rates, expanding meeting space revenue, improving food and beverage contribution, or adjusting the room count during expansion. By making revenue assumptions transparent and editable, the model helps users build a more credible forecast for planning, funding, and decision-making.
Bank-Ready Reports
The bank-ready reports component organizes the financial outputs that lenders, investors, and other stakeholders typically expect to review when assessing a hotel development opportunity. A hotel project often requires external financing, and lenders need to understand the capital budget, cash flow timing, operating performance, repayment capacity, and projected financial statements. This section helps users present the model in a structured, professional format rather than relying on scattered calculations. Inputs are drawn from the underlying assumptions and schedules, including revenue forecasts, operating expenses, payroll, capital expenditures, debt assumptions, equity contributions, taxes, working capital, and financing activity. Outputs may include profit and loss projections, cash flow forecasts, balance sheet summaries, funding requirement schedules, EBITDA, debt service coverage indicators, and key financial metrics. The value of this component is that it translates the detailed model into lender-friendly reports that can support loan applications, funding discussions, investment memos, and business plan submissions. It also gives users a clearer view of whether the hotel can generate enough operating cash flow to support financing obligations after opening. For project sponsors, bank-ready reporting can save time and improve credibility when speaking with banks, private lenders, investors, or development partners. For consultants and analysts, it provides a consistent reporting structure that can be tailored to the specific needs of each project.
Revenue Breakdown
The revenue breakdown component provides a detailed view of how total hotel revenue is generated across different streams. This is important because hotel performance depends not only on room sales but also on the contribution of ancillary services, service mix, occupancy patterns, and pricing strategies. A project with strong room revenue but limited ancillary income may have a different profitability profile than a hotel that earns meaningful income from food and beverage, events, parking, spa services, or other guest services. Inputs may include room revenue by type or segment, occupancy by period, weekday and weekend ADR, ancillary revenue categories, monthly service revenue assumptions, growth rates, and seasonal adjustments. Outputs may include revenue by stream, total monthly revenue, annual revenue summaries, percentage contribution by category, RevPAR-related metrics, and supporting data for profit and loss projections. This section is useful for planning because it helps users identify which revenue streams have the greatest impact on overall financial performance. It can support decisions about room mix, event space buildout, restaurant operations, parking strategy, service pricing, and marketing priorities. It also strengthens funding and investor materials by showing that the revenue forecast is based on specific operating assumptions rather than a single generic sales estimate. By separating revenue sources, users can test the impact of improving direct bookings, adding new services, increasing event activity, or adjusting pricing across the hotel’s commercial model.
KPI Dashboard
The KPI dashboard component tracks the performance metrics that matter most in hotel development and hotel operations. A strong financial forecast should not only show revenue and profit, but also explain the operational indicators behind those results. This section helps users monitor key metrics such as occupancy, ADR, RevPAR, revenue growth, EBITDA margin, cash flow, operating cost ratios, payroll as a percentage of revenue, return on equity, and other hospitality benchmarks. Inputs are drawn from the revenue, expense, staffing, capital expenditure, and financing schedules, while outputs are displayed as concise performance indicators that can be reviewed quickly. The KPI dashboard is useful because it helps users compare the project’s assumptions against industry expectations and internal targets. If projected occupancy is too aggressive, if payroll costs are too high, or if RevPAR does not support the development budget, the dashboard can help identify those issues early. For investors and lenders, KPIs provide a familiar way to evaluate the financial health and feasibility of the hotel. For business owners and operators, they support ongoing performance tracking after the model is customized for a specific project. This component also improves decision-making by highlighting the relationship between operational execution and financial outcomes. Users can adjust assumptions and review how KPIs respond, making the dashboard a practical tool for planning, benchmarking, and stakeholder communication.
Development Cost and Funding Requirements
The development cost and funding requirements component helps users estimate the capital needed to move the hotel project from concept to opening. Hotel development is capital intensive, and the initial investment may include land or property acquisition, construction, renovation, professional fees, permits, architecture and engineering, furnishings, fixtures and equipment, technology systems, meeting and event space buildout, pre-opening payroll, launch marketing, insurance, contingency, and working capital. This section allows users to organize those startup and development costs in a structured way so the total capital requirement is visible before the project begins. Inputs may include one-time cost categories, timing of capital expenditures, construction draw schedules, contingency percentages, equity funding, loan proceeds, interest during construction, and pre-opening cash needs. Outputs may include total project cost, funding gap, required equity contribution, required debt financing, monthly cash draw, and minimum cash balance during the development phase.
File types:
Excel – Single-User: .xlsx
Excel – Multi-User: .xlsx
Similar ProductsOther customers were also interested in...


 HenrySheykin
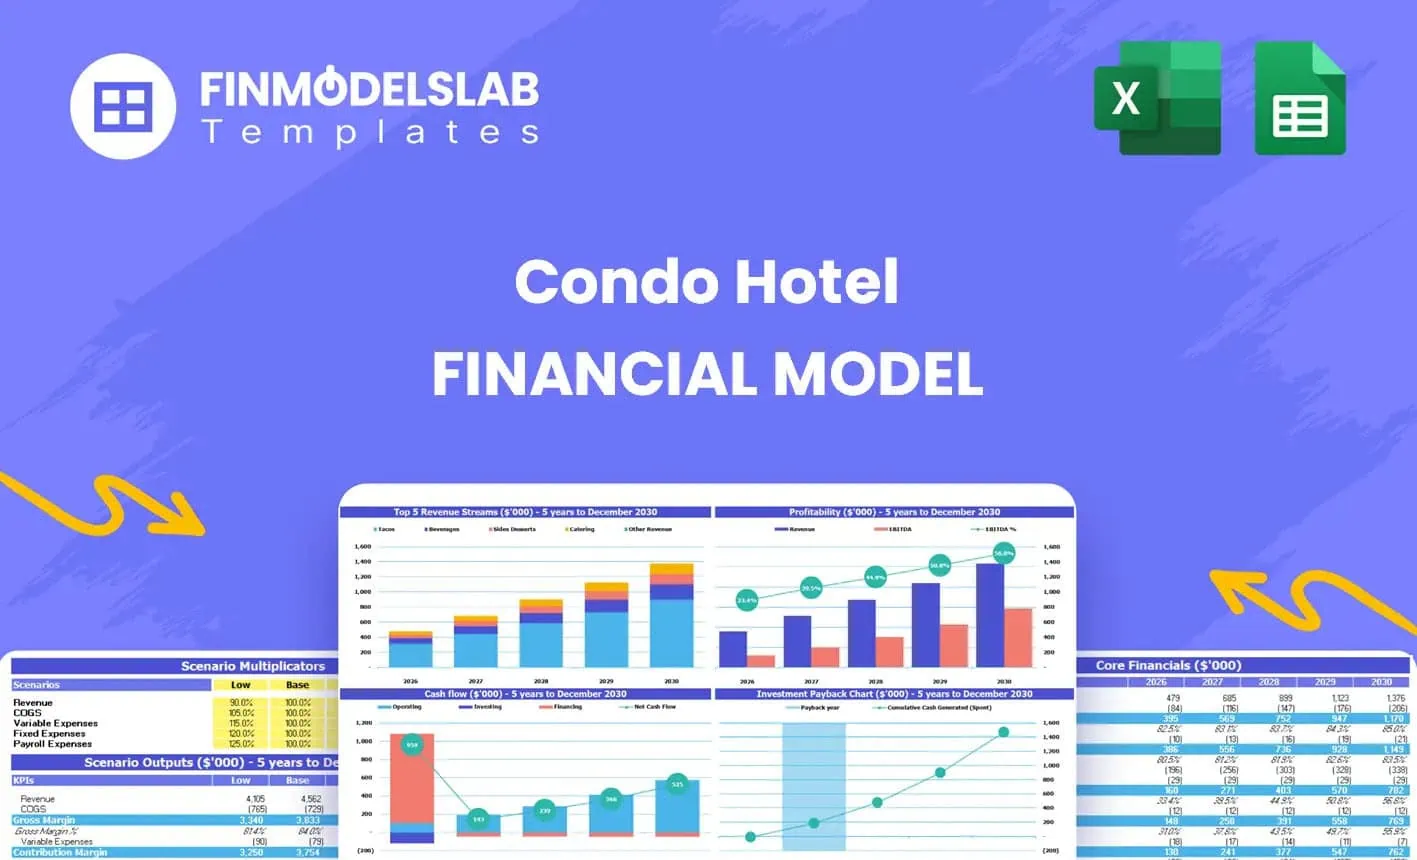
Condo Hotel Financial Model Excel Template
The Condo Hotel Financial Model helps users turn a condo hotel concept, launch plan, or investment o... Read more
 anthony
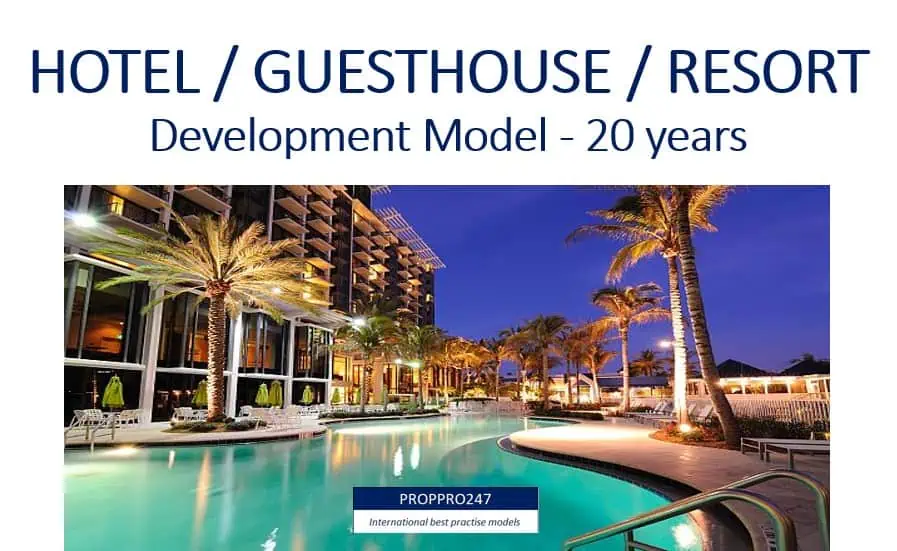
Hotel/Guesthouse/Resort Development Model and Valu...
This Hotel / Holiday Resort Development Model will take you through a 20-year period of Three Statem... Read more

 Giorgos
Student Hostel Development – 10 Year Financial M...
A hostel is a lower-priced inn of sorts that offers basic, shared accommodations. Typically, a hoste... Read more

Theme Park & Hotel Financial Model (Construct...
Financial model presenting a development scenario for a Theme Park & Hotel project including con... Read more
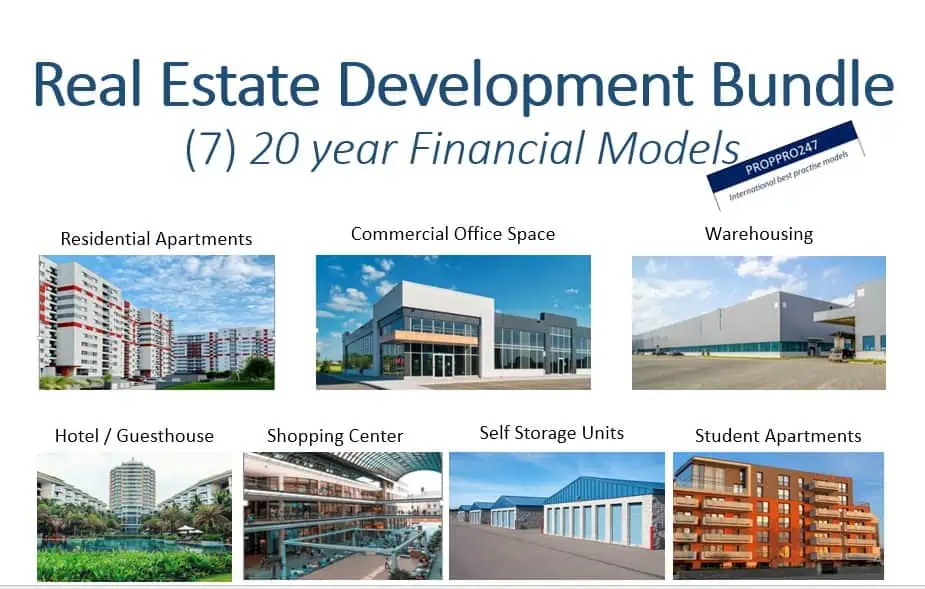
Real Estate Development Bundle
This Real Estate Development Bundle is a collection of real estate calculators or tools in MS Excel ... Read more

Hotel Development Financial Model (Construction, O...
Financial model presenting a development scenario for a Hotel including construction, operation, and... Read more

 Andreas
Airbnb Financial Model
Air BnB Financial Model Template presents the business case of the purchase of up to 5 properties wi... Read more
Senior Living Development – 10 Year Financial Mo...
Senior living apartments are just that – apartments (townhouses and condos may also fall in this c... Read more

 Andrei Okhlopkov
Hotel Acquisition Financial Model
This is a detailed, well-structured, and transparent cash flow model for the acquisition of a hotel.... Read more

Hotel Acquisition – 10 Year Financial Model
10-Year financial model for a hotel acquisition projecting revenue, operating expenses, and cash flo... Read more
You must log in to submit a review.