
0 ITEMS

Scenario Analysis in Excel Made Easy

Scenario analysis in Excel helps finance professionals assess different potential outcomes and manage risks more effectively.
- Using Excel to perform scenario analysis enables quick visualization of best-case, worst-case, and base-case scenarios.
- Key assumptions like sales growth, costs, and discount rates are adjusted to see their impact on financial results.
- Creating dynamic models with scenario switches simplifies decision-making without complex statistical methods.
- Visual tools like charts and sensitivity analysis improve understanding of risks and rewards.
- Regularly updating assumptions ensures accurate reflection of changing market conditions and strategic planning.
This approach supports smarter, data-driven decisions for business growth and financial success.
Understanding Excel Scenario Analysis
Performing Excel scenario analysis allows you to study different financial outcomes based on different sets of assumptions (inputs). It helps users assess how changes in key operating and financial assumptions are most likely to impact financial results. You can simulate easily how each variable affects your projections by creating multiple scenarios, such as best-case, worst-case, and base-case. Excel makes it easy to organize, calculate, and compare different scenarios in a clear and structured way.
At its core, Excel scenario analysis involves creating different dynamic financial projects based on the underlying assumptions about key variables that can change by scenarios. For instance, a company might want to assess the impact of changes in pricing strategies, market demand, or cost fluctuations on its overall profitability. By systematically altering these variables, businesses can visualize how different paths might unfold and gauge the potential risks and rewards associated with each. With its robust data handling capabilities and built-in tools, Excel allows users to create and manipulate multiple scenarios easily. This process helps identify risks, opportunities, and the best course of action under different conditions.
Why Use Scenario Analysis in Excel?
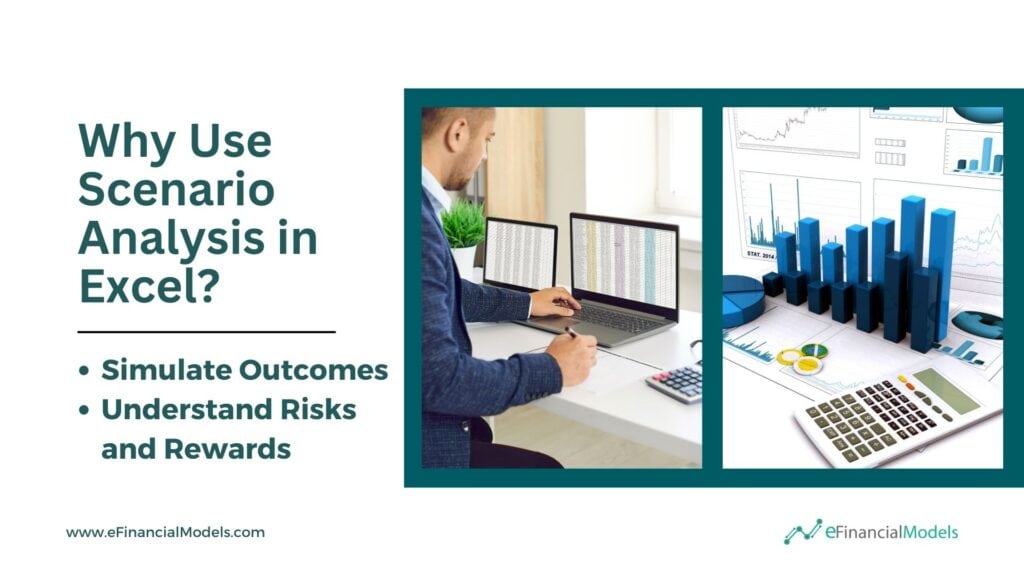
Scenario analysis in Excel is a powerful tool because it’s flexible and easy to use. With Excel, you can quickly build dynamic models that adjust based on key assumptions. By changing these assumptions, you can instantly simulate different financial scenarios, making it simple to explore various outcomes.
This approach helps you assess risks and rewards more effectively. Instead of relying on a single forecast, you can examine multiple possibilities and understand the range of potential results. Doing this gives you better insight into financial decisions, helping you plan more strategically and make smarter choices.
How to Create Scenario Analysis in Excel?
Scenario analysis in Excel allows you to explore different potential outcomes based on changing variables. It helps you understand how different factors impact your financial models or business plans. We can keep this very simple and just focus to understand 3 scenarios – a base case, an upsode case and a worst-case scenario.
Excel scenario analysis keeps things simple with just three scenarios—base case, best-case, and worst-case. This approach simplifies the decision-making process while still offering valuable insights. It offers better clarity and focus than more complex statistical models like the Monte Carlo simulations, which can explore thousands of scenarios. The three scenarios provide enough variety to understand potential risks and rewards without overwhelming the analysis. The goal is not to predict every possible outcome but to capture the range of possibilities straightforwardly. Analyzing these three scenarios allows you to make informed decisions without the complexity of thousands of simulations.
Step 1 – Create a Worksheet for Analysis
Begin by creating one worksheet for assumptions, where you’ll outline key inputs. Then, create just one scenario worksheet for the three scenarios. This sheet will contain all the necessary data and assumptions. Create a “Switch” to change the scenarios within the same worksheet. To create a switch in Excel, select the cell, go to the Data tab, choose Data Validation, set the Allow field to “List,” and enter the options for the switch in the Source box, separated by commas. Finally, create a separate worksheet for your scenario analysis graph and chart, visually representing the outcomes based on the different scenarios.
Step 2 – Define Your Key Assumptions
The next step is to define the key assumptions or variables that will impact your analysis, like CAPEX, sales, sales growth, EBITDA margin, discount rate, etc. Start by listing all relevant factors, then narrow it down to the most important ones that are likely to change and significantly influence your outcomes. For example, if analyzing a new project, focus on assumptions like expected sales growth, capital expenditures, and the impact of the discount rate. This helps ensure your analysis is focused, actionable, and based on the most relevant factors. Some assumptions will remain fixed, while others will be adjusted based on the scenarios you want to analyze. It simplifies the process and keeps everything in one place.
After identifying your key variables, assign values based on historical data, expert predictions, or market research. Create a range for each variable to represent the best-case and worst-case scenarios. This helps visualize potential outcomes and supports informed decision-making. Use data tables or scenario manager tools to track and manipulate variables in Excel, showing how changes affect your results. Defining key variables sets the stage for strong scenario analysis in Excel, guiding you through uncertainty and enabling better strategic planning.
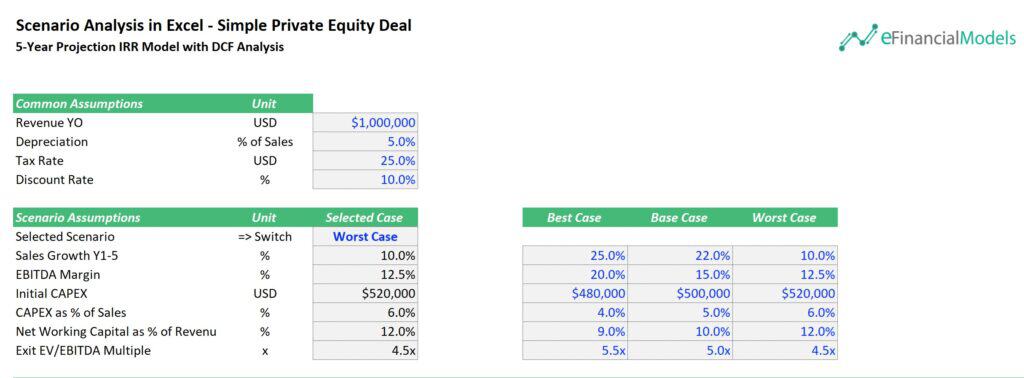
The chart above shows an Excel scenario analysis for a Simple Private Equity Deal. It uses a set of assumptions to project a 5-year Internal Rate of Return (IRR) with Discounted Cash Flow (DCF) analysis. Key assumptions include revenue growth, EBITDA margin, capital expenditures (CAPEX), and working capital. A switch allows users to select the best, base, or worst-case scenarios. Each scenario adjusts specific variables like sales growth (from 10% to 25%), EBITDA margin (from 12.5% to 20%), and exit multiple (from 4.5x to 5.5x). The model also includes constant assumptions for depreciation, tax rate, and discount rate, linking figures to data tables for clear, dynamic calculations in the analysis.
Pro-Tip: Define your key assumptions using data validation and INDEX MATCH. Data validation ensures that users can only select from predefined options for each scenario. Then, use INDEX MATCH to fetch the corresponding assumptions based on the selected scenario, making the model more efficient and reducing errors. This setup allows you to adjust assumptions for each scenario while maintaining accuracy dynamically.























































Step 3 – Establish Your Base Case Scenario
A base case scenario is a standard or expected situation used as a reference point in decision-making or financial modeling. It represents the most likely outcome based on current assumptions without considering major changes or risks. This scenario serves as a benchmark to compare other possible outcomes, such as worst-case or best-case scenarios, helping to evaluate the impact of different variables on a project or business plan.
Establishing your base case scenario starts by gathering all relevant data, such as historical performance, market trends, and economic indicators. Organize this data in a clean spreadsheet with clear labels for various variables. Input these assumptions into the spreadsheet, ensuring they are well-documented for future reference. Finally, model your base case using Excel formulas to calculate revenues, costs, and profitability.
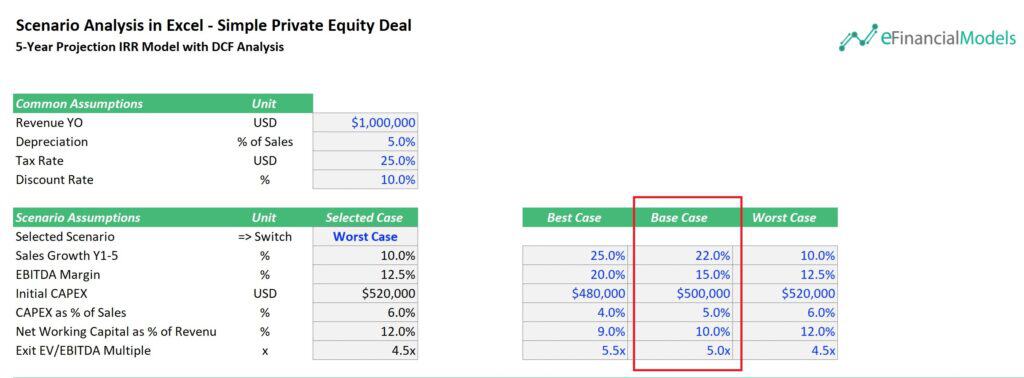
The sample base case scenario above assumes a 22% annual sales growth over five years, with an EBITDA margin of 15%, reflecting operating profitability. Initial capital expenditures (CAPEX) are set at $500,000, with CAPEX representing 5% of sales each year. Net working capital is expected to be 10% of revenue, ensuring enough funds to support business operations. Lastly, the exit value is based on an EV/EBITDA multiple of 5.0x, which helps determine the business’s projected value upon exit.
Step 4 – Form Your Best-Case Scenario
A best-case scenario is the most optimistic projection, where all key variables align to maximize success. It assumes favorable outcomes, such as higher sales, lower costs, or faster growth than expected. This scenario highlights the potential for the highest returns and optimal performance. It helps to understand the best possible result if everything goes right and provides a benchmark for decision-making in uncertain conditions.
To form your best-case scenario in Excel, start by adjusting the key assumptions from your base case scenario to reflect the most optimistic outcomes. For example, increase sales growth, reduce costs, and improve margins. Adjust variables like CAPEX, OPEX, and the discount rate to more favorable values. These changes reflect the best possible conditions, such as higher sales volume or lower operational expenses. Input these new values into your spreadsheet, ensuring they are documented for easy comparison with the base case. This will provide a clear projection of the best possible financial outcome.

The best-case scenario above assumes a 25% annual sales growth over five years, with an EBITDA margin of 20%, indicating higher profitability. Initial capital expenditures (CAPEX) are set at $480,000, and CAPEX is expected to be 4% of sales each year. Net working capital is projected to be 9% of revenue, ensuring sufficient funds to support business operations. The exit value is based on an EV/EBITDA multiple of 5.5x, reflecting a more favorable exit scenario..
Step 5 – Generate Your Worst-Case Scenario
A worst-case scenario is the most pessimistic projection, where all key variables align to lead to the worst possible outcome. It assumes unfavorable conditions like lower sales, higher costs, or slower growth. This scenario helps highlight potential risks and the negative impact of adverse factors. It allows businesses to prepare for challenging situations by understanding the worst possible result and planning strategies to mitigate those risks.
Generating your worst-case scenario in Excel involves adjusting the key assumptions from your base case to reflect the most negative outcomes. For example, reduce sales growth, increase costs, and lower margins. Adjust variables like CAPEX, OPEX, and the discount rate to less favorable values. These changes should represent challenging conditions, such as lower market demand or higher expenses. Input these new values into your spreadsheet and document them for easy comparison with the base and best-case scenarios. This will give you a projection of the worst possible financial outcome.
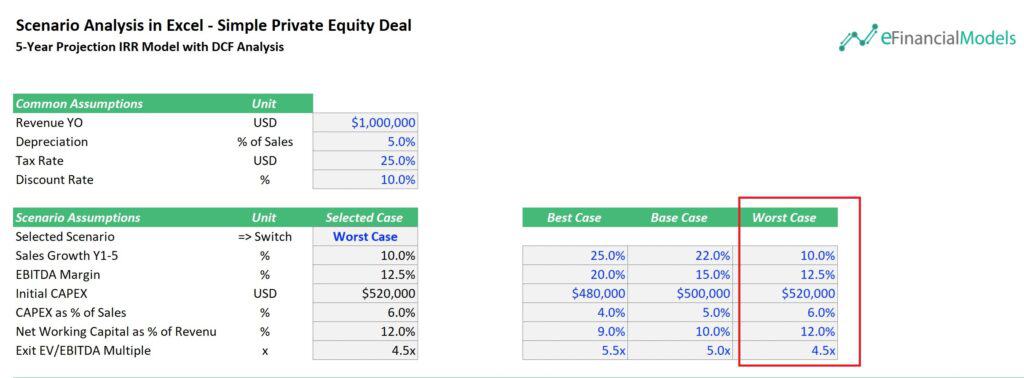
The worst-case scenario above assumes a 10% annual sales growth over five years, with an EBITDA margin of 12.5%, reflecting lower profitability. Initial capital expenditures (CAPEX) are set at $520,000, and CAPEX is expected to be 6% of sales each year. Net working capital is projected to be 12% of revenue, which requires more funds for business operations. The exit value is based on an EV/EBITDA multiple of 4.5x, indicating a less favorable exit scenario.
Step 6 – Use Excel Functions for Scenario Analysis
To master scenario analysis in Excel, leverage its powerful functions and formulas to improve your decision-making. Excel is more than just a spreadsheet tool; it lets you manipulate data and analyze different outcomes quickly and accurately.
- Use the Goal Seek function in Excel for scenario analysis helps identify the required input values to achieve a specific target outcome. Start by setting up your model with known variables and a target outcome. Next, go to the “Data” tab and click on “What-If Analysis,” then select “Goal Seek.” In the dialog box, input the cell with the target result you want to achieve, the cell to change, and the desired value for the result. Excel will then adjust the input value to reach your target outcome.
- Another useful tool is the DATA TABLE function. It helps you perform sensitivity analysis by showing how changes in one or two variables impact your outcomes. With a one-variable or two-variable data table, you can quickly compare multiple results side by side, making it easier to make informed decisions.
- Finally, use charts and graphs to visualize your scenario analysis results. Excel’s charting tools help create clear visuals communicating your findings and supporting your decision-making. Visualizing your scenarios with charts is essential in mastering scenario analysis in Excel. While raw data and numbers provide crucial insights, they can often be overwhelming and difficult to interpret.
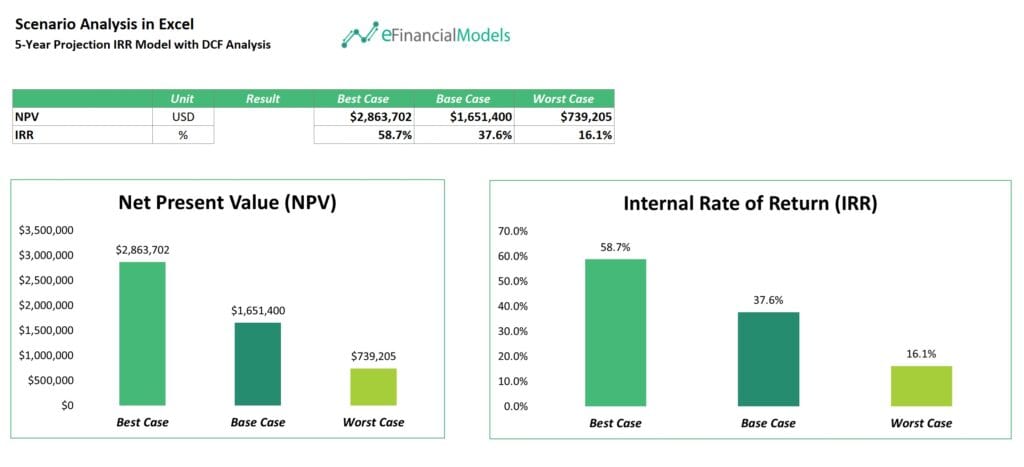
The above chart displays the scenario analysis results using Net Present Value (NPV) and Internal Rate of Return (IRR) across three scenarios: best-case, base case, and worst-case. The best-case scenario shows the highest NPV ($2,863,702) and IRR (58.7%), while the worst-case scenario shows the lowest NPV ($739,205) and IRR (16.1%). The base case scenario lies between these extremes. This Excel visual tool helps to quickly compare different outcomes based on varying assumptions, providing a clear view of potential risks and rewards, and assisting in informed decision-making for investment analysis.
Improving Decision-Making with Excel Scenario Analysis
Businesses can use Excel scenario analysis to make informed, data-driven decisions. It is a powerful tool that helps businesses make smarter decisions by testing different outcomes. This approach empowers businesses to navigate uncertainties, optimize resources, and align strategies with long-term goals, leading to better, more confident choices.
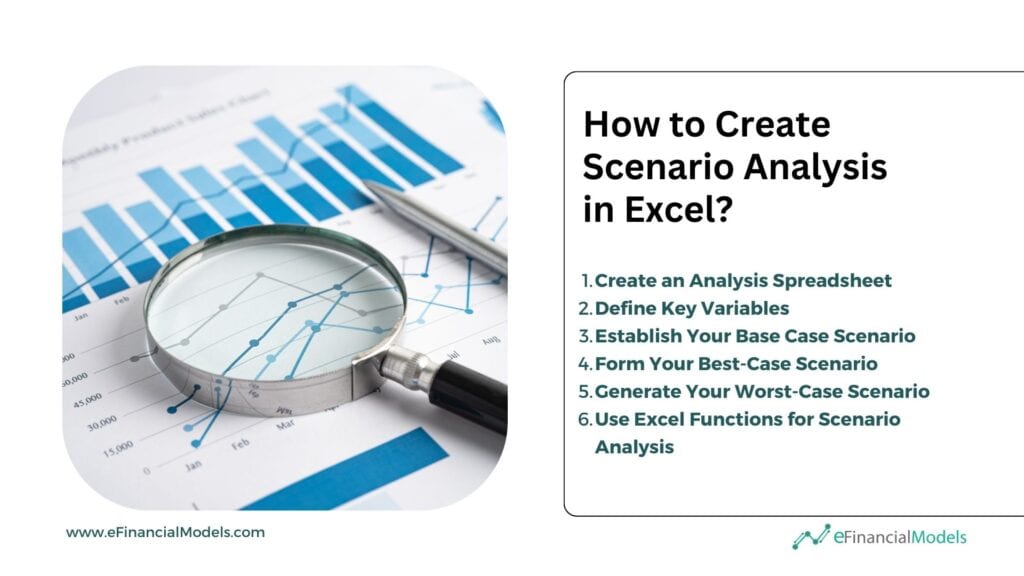
Excel scenario analysis improves decision-making by allowing businesses to test outcomes by changing key variables. By adjusting assumptions like sales growth, costs, or market demand, you can see how different scenarios affect your financial model. Excel’s tools help you quickly assess risks and forecast results. This approach provides a clear view of potential outcomes, making it easier to make informed, data-driven decisions that align with your business goals. Using scenario analysis in Excel ensures smarter, more confident choices for the future. Start using scenario analysis today!





































You might also like:
- 10 Tips to Develop a First Class Business Valuation Report
- 10 Main Elements of a Business Plan
- 14 Best Practices in Financial Modeling
- Calculating Revenue Growth Rate: A Key Metric for Business Success
- How to Calculate Net Present Value (NPV)?
- How to Make Smart Decisions with 6 Key Financial Metrics?
- How to Prepare a Financial Feasibility Study?
- How to Raise Series A Funding?
- Scenario Analysis
- Financial Modeling using Excel
- Business Plan Models – Using Business Models as Examples
- How to Review a Financial Model?
- Estimated Benefit of a Financial Model
- Cash Flow Analysis in Excel
- 10-Step Financial Planning Checklist for Smart Executives
- Price Sensitivity Analysis: Get More Revenue by Changing Your Prices
- Financial Ratios Analysis and Its Importance
- Accounting
- 5 Steps to Create a Drop Down List Using Data Validation in Excel
- Event Organizer Business Model Template
- Renewable Energy Financial Model Bundle
Tags: Scenario Analysis