0 ITEMS

Goal Seek: An Excel Function You Should Know About!

When most of us use Microsoft Excel, we enter the numbers we want to see and get the answers we need. In financial modeling, we typically have more complex spreadsheets where the inputs and outputs are separate. In some cases, this creates a problem as sometimes, due to our model structure, we suddenly need to know which output leads to which input. If this describes your situation, there is a solution for this. Welcome to our article, which explains the Goal Seek function in Excel.
Sometimes, such as when determining the required volumes to achieve break-even or wanting to know which discount rate leads to a Net Present Value (NPV) of zero, you will need a way to solve back, which input leads to a particular outcome. Excel’s goal-seek function offers an excellent solution to exactly this.
This article will show you how to use Excel’s Goal Seek function. We’ll show you what the function does, what input parameters are needed, how to use it, and demonstrate two useful use cases. The pre-requisite to all this is that we need to define what “GOAL” we want to solve for, as this will be the important condition to input into Excel’s goal seek function.
What is Goal Seek in Excel?
Goal Seek is a part of the what-if-analysis tool in Excel. The tool assists in determining the value of the input necessary to achieve the specified outcome.

Goal Seek requires three elements:
- “Set cell” serves as the formula cell’s point of reference.
- “To value” refers to the desired or targeted value that needs to be attained.
- “By changing cell” refers to the cell that needs to be modified to achieve the desired value.
How to use Goal Seek for Break-Even Analysis?
Microsoft Excel’s Goal Seek feature enables you to find an answer based on given parameters. The function is useful for various tasks, including forecasting, budgeting, interest calculations, loan applications, break-even analysis, NPV calculation, and more.
In this example, we’ll apply the Goal Seek function in a practical setting using the “break-even analysis.”
Take a look at the fundamental break-even analysis formula and various word definitions.

- The “Break-Even point” is when total costs are the same as revenues which leads to profits equal to zero
- “Fixed costs” typically are corporate overhead expenses independent of the volume of goods or services the company provides. Often referred to as indirect costs or overhead costs. They are usually recurring, like monthly rent or interest.
- “Price” is the price at which one product is being sold or how much the end user pays.
- “Variable Cost per Product” is the directly associated costs for each product. This means when you sell more of this product, these costs will occur in addition.
The equation will now allow us to calculate how many products will need to be sold in order to achieve the break-even point. This also means if we sell more products, we should be profitable. Typically, this is a key analysis many entrepreneurs use when they price and plan their products.
Break-Even Calculations for required Volumes
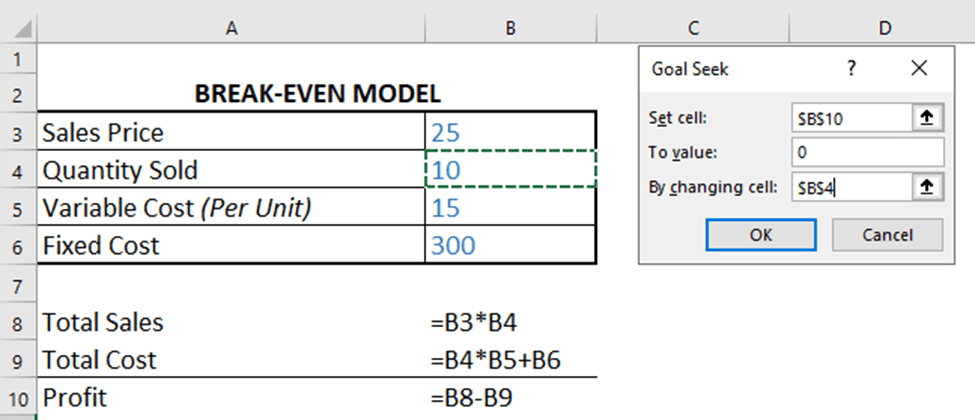
Let us look at the following illustrative example: Your business’ total fixed cost is 300, and our plan is to sell 10 products. This means, based on our calculation, we will run into a loss as every product only leads to a Gross Profit of 10 (Price of 25 minus Variable Costs of 10.
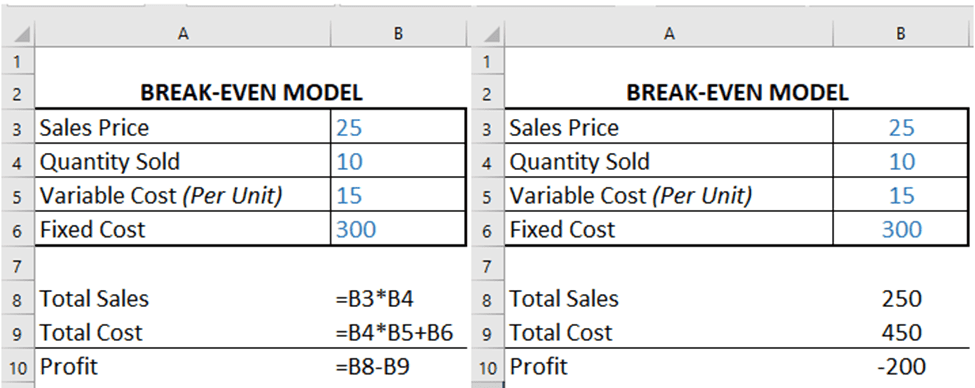
Now our goal is to achieve break-even, and we want to find out how many products you need to sell to achieve break-even.
We could calculate this via re-engineering our calculation, but a quick way to do this is simply using the Goal Seek function in Excel. How many quantities of that product need to be sold to obtain a profit of zero?
To use the Goal Seek function, follow these steps:
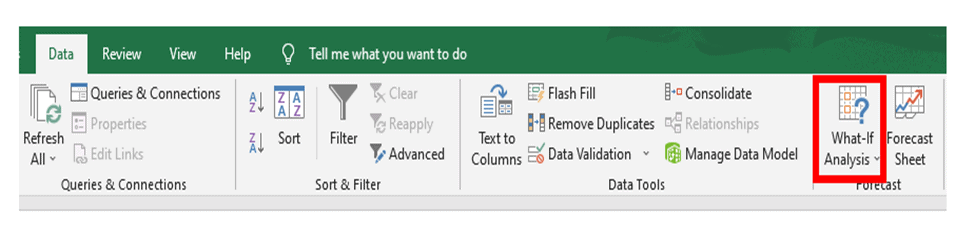
1) In Excel, go to the Data tab. Click the What-If Analysis button.
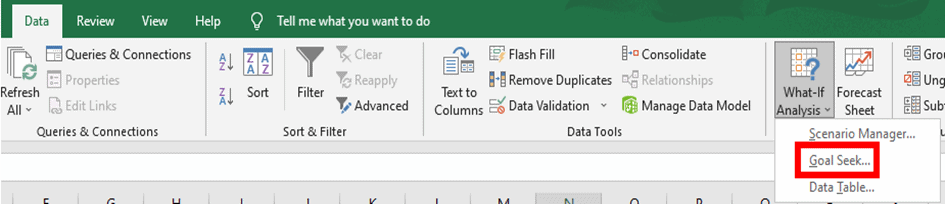
2) Choose Goal Seek from the dropdown menu.
3) Click on the Goal Seek menu and input your equation in the dialog box that appears.
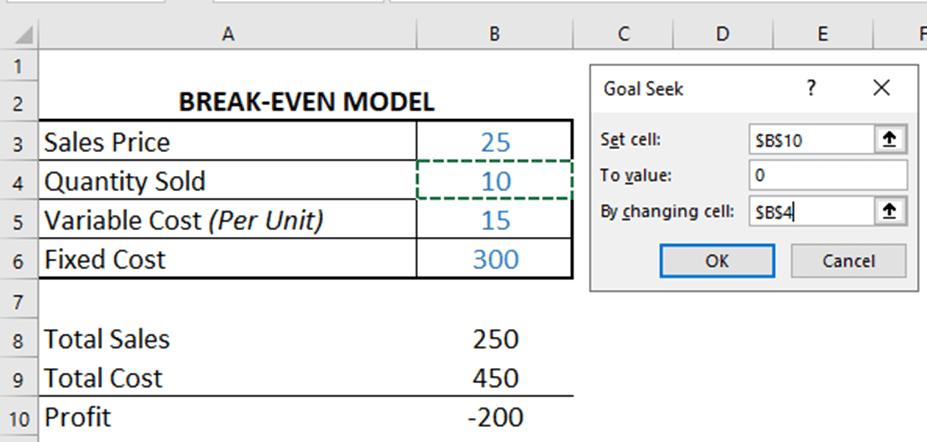
- Goal: Select cell B10 as the set cell in the dialog box where our goal lies.
- Value of the Goal: Our goal is to put profit at break-even or zero, So we put “0” in “to value” in the dialog box.
- Cell to Manipulate: Enter cell B4 into the “by changing cell” field so Excel knows which cell the program needs to vary until a profit of zero is obtained (the break-even point).
4) After you click “OK”, Excel’s Goal Seek program will run a series of iterations where it basically guesses an input parameter, then measures the gap towards the goal, enters a new guess, and minimizes the distance to the goal. Excel will do this as per the number of iterations specified in the program’s settings. In our case, this is not very difficult as only a few iterations are needed until the quantity of 30 is found, which leads to a profit of zero.
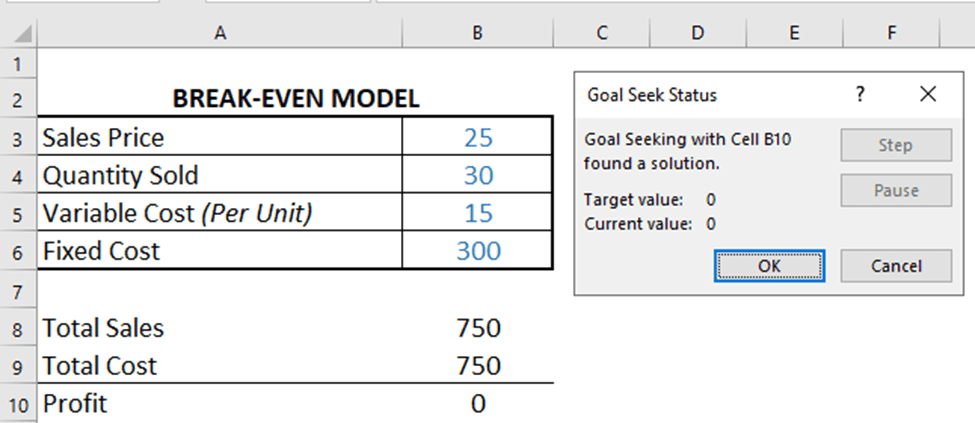
The conclusion is that we must sell 30 units to achieve break-even. This now is very useful to know as we can simply ask the question to our salespeople if it is possible to sell 30 units and how to do this best without increasing the costs.
Break-Even Calculations for Price Instead of Volume
In case it would not be possible to sell the required 30 units, the alternative would be to increase the price. Again, instead of running a complicated calculation, we can simply use the Goal Seek function in Excel to find out what price would be required to sell the initial 10 units at just break-even.
The process is the same, but this time, we will enter the sales price from cell B3 (Sales Price) into the “by changing cell” field.
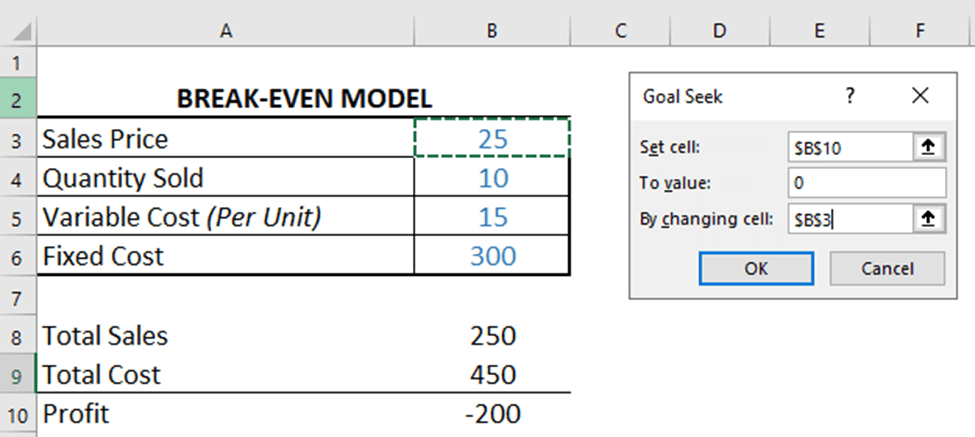
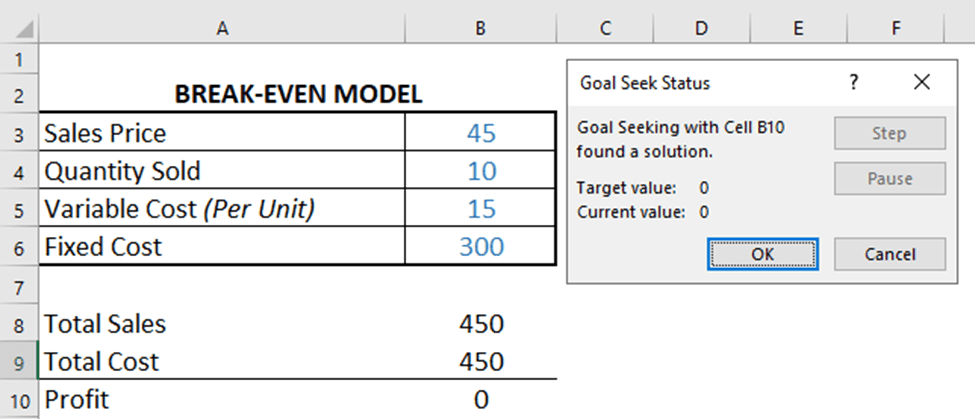
Notice that we can break even on the same number of units sold by raising the price from 25 to 45 per unit. Changes in variable and fixed costs can be handled using the same procedure.
How to use Goal Seek to solve IRR?
Another application of Goal Seek frequently used by financial analysts is to solve for the Internal Rate of Return (IRR). The IRR is the discount rate in a Net Present Value (NPV) calculation which leads to a zero NPV.
To demonstrate this, we need an NPV calculator spreadsheet.
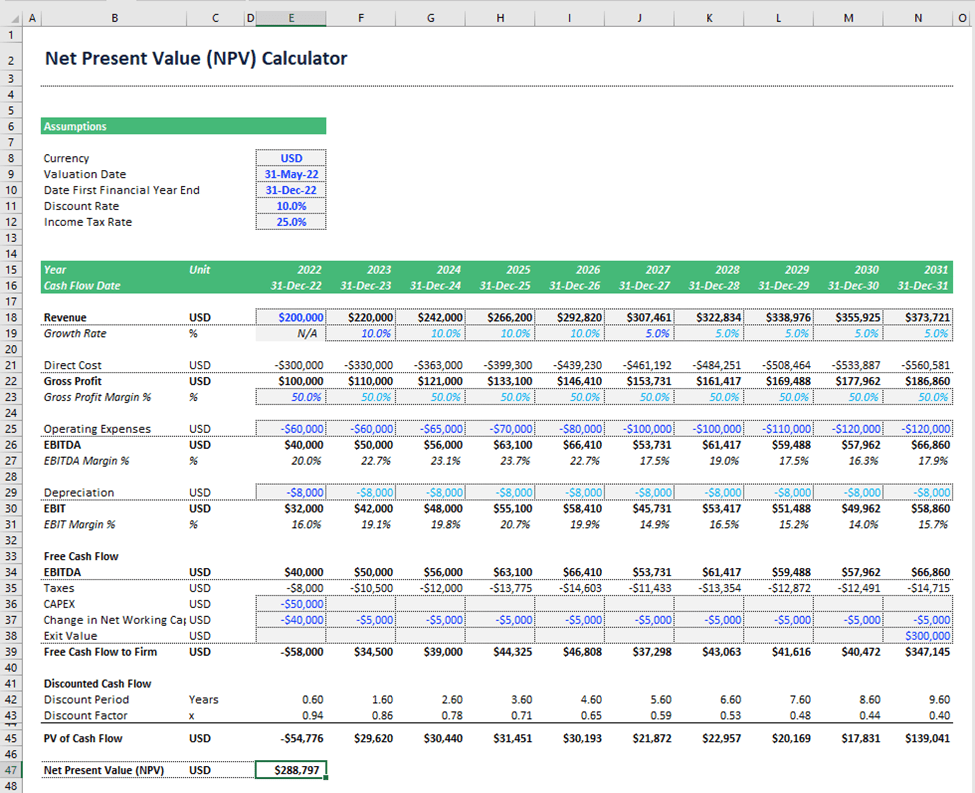
Similar to our previous example, we now can goal seek the discount rate, which brings our NPV to zero.
In Excel, go to the data tab, menu What-If Analysis, and Goal Seek. Then the input box will open where you can input the parameters needed to solve for NPV equal to zero:
- Goal: Select the NPV in cell E47 as the set cell in the dialog box to target.
- Value of the Goal: NPV needs to become at zero, so we put “0” in “To value” in the dialog box.
- Cell to Manipulate: Enter the cell with the discount rate E11 into the last dialogue box entry “By changing cell” to indicate that this is the parameter that will need to be varied.
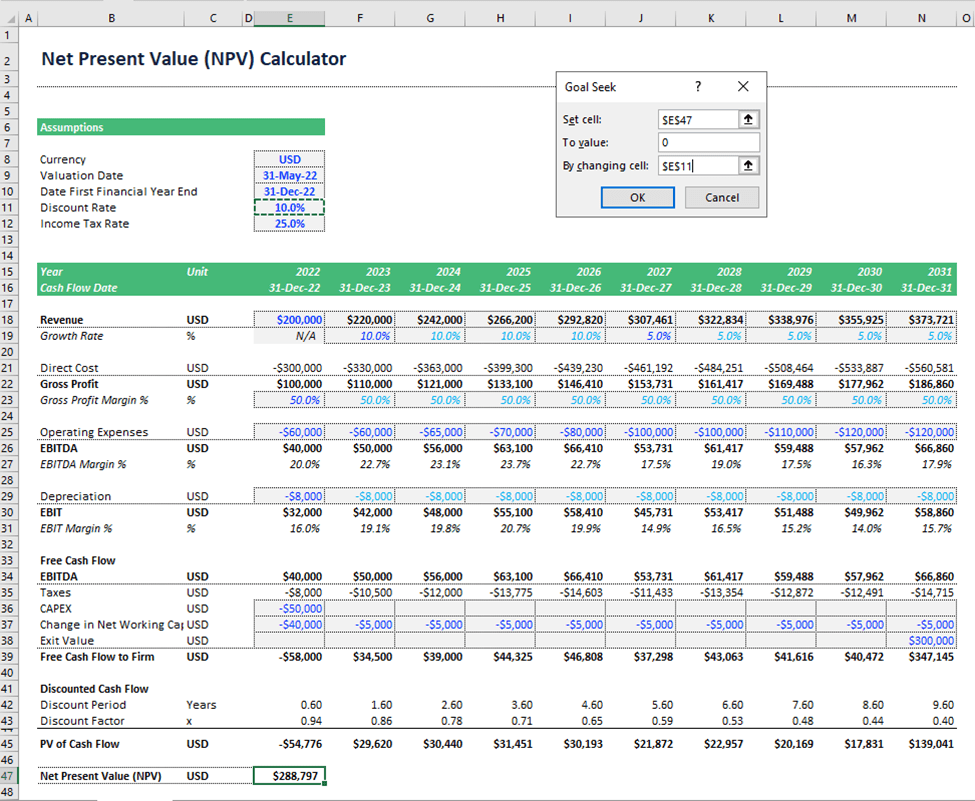
As you can see below, a discount rate of 69.3% leads to our goal of zero NPV. Zero NPV does not mean that there is no value created. It signifies that this project generated an internal rate of return of 69.3% since, in that case, the NPV would become just zero. In case you would use a lower discount rate, the NPV would become positive. This means 69.3% is the maximum return we can get on this proposed investment.
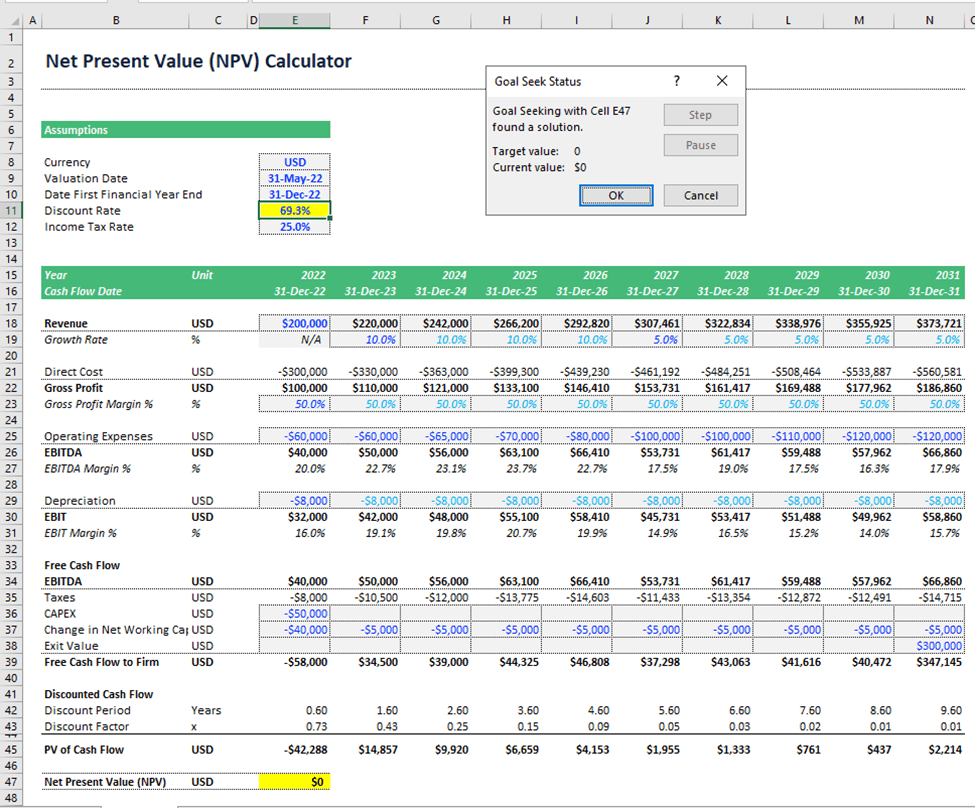
Goal seek provides a way to double-check the IRR formula in Excel. Please refer to the following article for more explanation on how to compute the IRR.
What to do when Goal Seek leads to inconclusive Results?
As you can see in the two examples above, Goal Seek requires a small model of cells linking to each other. In some cases, such models might be incorrect or have mistakes which can lead that Goal Seek cannot properly compute the target value.
You might find that it doesn’t always find a solution when using Goal Seek in Excel. Here’s how to get around typical problems like this!
1) Cells Must Contain a Value: Ascertain that the “By changing cell” refers to a cell that contains a value and not a formula. The below example makes zero sense to Excel since there is no value to input in cell B4. The cell is occupied with a formula that cannot be manipulated.
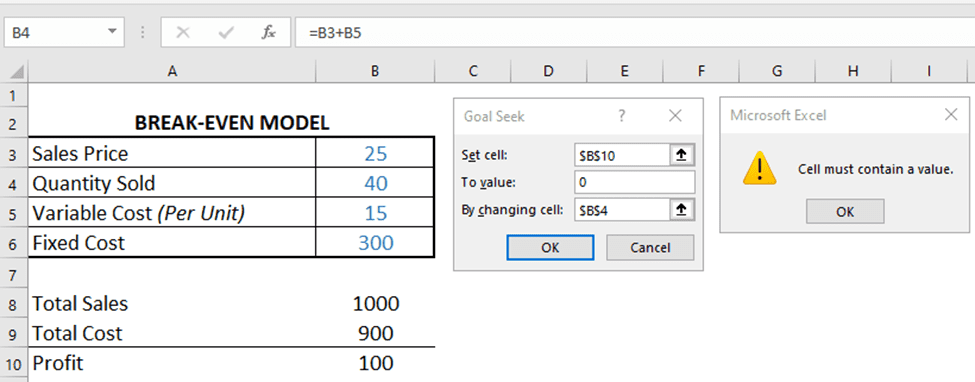
2) Target Cell must contain a Formula: Ascertain that the target cell contains a formula. Only a formula can lead to an output. Goal Seek won’t work if the target cell “set cell” contains an input.
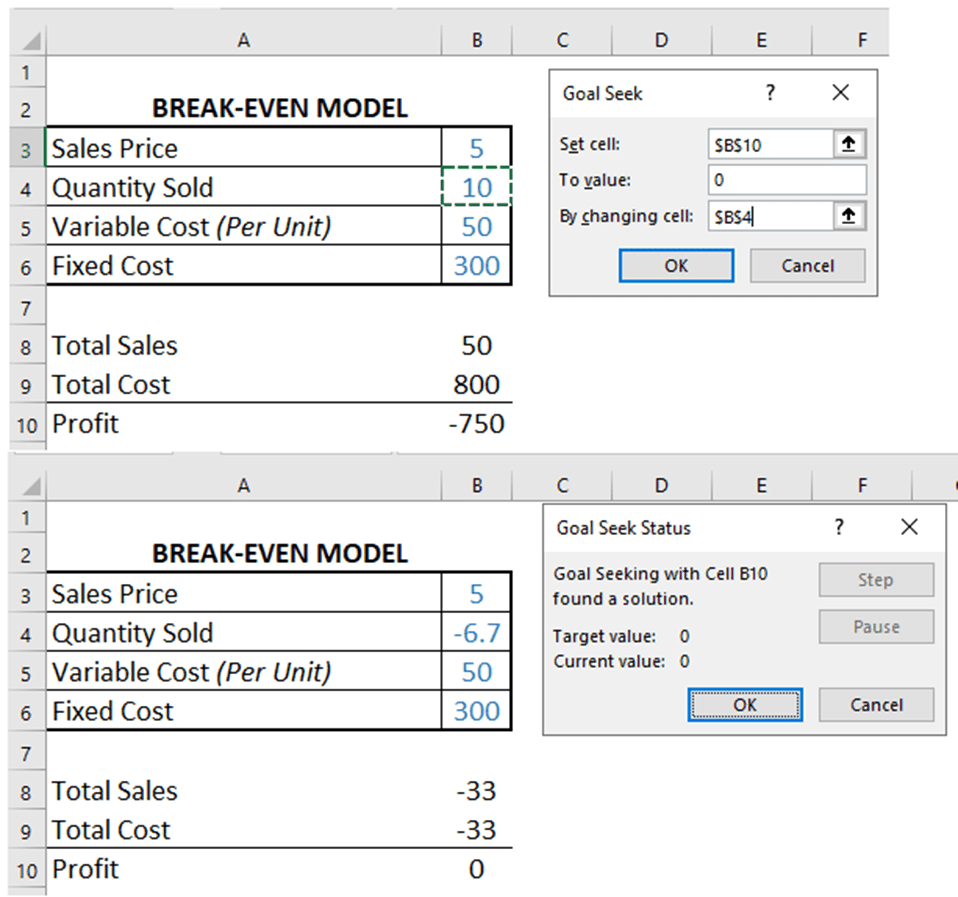
3) Mathematically impossible to solve: Sometimes, it is mathematically impossible to find a target because it simply does not exist. In the below example, Gross Profit per item is negative (Price 5 – Variable Cost per unit of 50 = -45). In reality, this means every product sold leads to a loss, and it is impossible to get to a profit. That’s an economic reality also Goal Seek cannot get around and, therefore, will either lead to negative or other inconclusive results.
Conclusion: Excel’s Goal Seek feature is incredibly helpful!
In financial modeling, financial models use separated cells for inputs and outputs. This means that sometimes there is a chicken or egg problem. Which one was first, the input or the output? In such cases, we need to work back to which input leads to the targeted output. The way to do this quickly in Excel is by using the Goal Seek function. The function uses a series of iterations (or guesses) to find out which input leads to the target output. The more iterations Excel runs, the closer and more precise the answer will be.
Goal Seek in financial modeling can be used especially for scenario analysis in cases such as:
- Finding the required volumes to achieve break-even
- Finding the discount rate which leads to a zero NPV in case you need to double-check your IRR calculation.
- What price would you need to charge to achieve a certain profitability?
- And there are countless more applications…
The prerequisite for using this feature is a well-designed financial model which allows you to run Goal Seek. Kindly refer to our many financial model templates for your next financial analysis, and feel free to try the goal seek function in Excel yourself!