
0 ITEMS

How to Calculate the Compound Annual Growth Rate (CAGR)

Imagine you’re analyzing the growth of a company over several years. While the company may experience fluctuations in yearly growth, it is not easy to calculate a simple average growth rate, which leads to the same forecast result.
The Compound Annual Growth Rate (CAGR) is a powerful financial metric that every business owner and investor should know. Understanding CAGR is essential for evaluating the growth potential of an investment or business, as it provides a clear picture of the average annual growth rate over a specific period of time.
Whether you are a seasoned entrepreneur or just starting a business, this guide on how to calculate Compound Annual Growth Rate (CAGR) will equip you with the knowledge and skills to utilize this valuable metric effectively. From the basics of CAGR calculation to its applications in forecasting and decision-making, this guide will take you step by step through the world of CAGR and help you master this essential tool for business success.
In this article, we want to explain why using the Compound Annual Growth Rate (CAGR) gives you a more correct way to calculate an average growth rate than a simple average growth rate formula. Knowing how to correctly calculate the average growth rate enables you to perform the best analysis when comparing growth rates across companies or benchmarks and avoids the typical beginner’s mistake.
The Problem with Calculating the Average Growth Rate
Calculating an average growth rate can be useful for understanding how a particular quantity (e.g., revenue, population, investments) increases over time. However, calculating and interpreting the average growth rate is only sometimes straightforward, and several challenges and nuances are associated with it.
Let’s first look at the example of using just a standard AVERAGE Formula in Excel. Supposed we forecast a company’s annual revenue for ten years as follows:

We want to know the average of all these growth rates and then apply this average to check if we can obtain the same projected revenues in Year 10.

As you can see in the above example, we determine that the average of the above revenue growth rates during years 1–10 is 32.5% per year. Now, we want to double-check what happens when we grow the starting revenues of $200,000 as of year 0 at the average rate of 32.5% per year. Referring to the above calculations in Excel, the resulting revenues in Year 10 lead to a different result than our original forecast:
- Recalculated Revenues in Year 10: $3,327,197
- Initial Projected Revenues in Year 10: $3,185,000
It showed that we have a difference of $142,197. So, the AVERAGE growth rate formula does not correctly calculate the average revenue growth during our forecast period. The reason is that when using the AVERAGE formula in Excel, we neglect the compounding effects of growth. It makes a big difference if we grow revenues at 32.5% or 25.0% since the starting point in year 1, then change again. This result might be quite surprising, but the conclusion is that whenever we use the AVERAGE growth rate formula in Excel for calculating an average growth rate over time, the result must be corrected.
The bottom line is that we need a formula that considers the compounding effect of growth. That is why we need to look at the Compounded Average Growth Rate (CAGR) as an AVERAGE formula won’t do it.






















































The CAGR Formula
The compound annual growth rate calculation involves a three-step process using the CAGR formula:
(Ending Value/Beginning Value) ^ (1/No. of Periods) – 1
- First, you must divide the ending value by the beginning value. The result represents the total growth factor over the entire period. If this value is greater than 1, there was growth; if it’s less than 1, it indicates a decline.
- Second, you must raise the result to the inverse compounding period. By taking this nth root, the CAGR formula considers the exponential growth that results from compounding. The growth is applied repeatedly to the principal plus any accumulated growth.
- Finally, we subtract 1 from the result to convert the growth factor into a growth rate. For instance, a growth factor 1.05 corresponds to a 5% growth rate.
The CAGR formula gives a smoothed average growth rate across numerous years. Unlike the simple average growth rate, it considers the compounding effect, a more accurate picture of investing realities. As a result, it offers a clearer view of the growth process, particularly when addressing an unstable investment with fluctuating returns over time.
Please note that the formula applies to any set of values. CAGR can be used to calculate the expected growth of investments, revenues, or other economic metrics over a certain period.
How to Calculate CAGR? – Sample Calculation
Let us use the same assumptions of a company’s annual revenue for ten years on the average growth rate calculation above. To calculate the CAGR, we have the following assumptions:
- Beginning Value = $200,000 (Year 0 Revenues)
- Ending Value = $3,185,000 (Year 10 Revenues)
- Number of Periods = 10 – 0 = 10
Now, let us use the CAGR formula:
CAGR = (Ending Value/Beginning Value) ^ (1/No. of Periods) – 1
CAGR = ($3,185,000/$200,000) ^ (1/10) – 1 = ($3,185,000/$200,000) ^ (1/10) – 1
CAGR = (15.92) ^ (0.1) – 1 = (1.319) – 1 = .319 or 31.9%
Now, let us perform the annual growth rate and compound annual growth rate calculation in Excel.

The Excel spreadsheet above shows the annual growth rates in revenue from Year 0 to Year 10, ranging between 19.9% to 60% per year. Year 1 revenue is higher than Year 0 revenue, the starting base. The revenue keeps growing as we add more years.
As you can see, the compound annual growth rate calculation smooths out the effects of volatility and fluctuations during the period. It provides an average growth rate that accounts for compounding. Using the CAGR of 31.9% will lead to the same target amount of $3,185,000 by the last forecast year with your initial time series (Year 10 Revenues).
Compound Annual Growth Rate Meaning
CAGR, or Compound Annual Growth Rate, is a useful measure in finance and business to understand the geometric progression ratio that provides a constant rate of return over a time period. In simpler terms, the compound annual growth rate meaning gives you the smoothed annual rate of growth, ignoring the effects of volatility and fluctuations during the period.
The compound annual growth rate meaning can be applied to any set of values that can grow over time. It’s not limited to just financial metrics. Here are some examples:
- Prices: If you’re tracking the price of a commodity, like gold, over several years, CAGR can tell you the average annual growth rate of that price.
- Volumes: In industries like shipping or manufacturing, CAGR can be used to measure the growth in the volume of goods produced or shipped over time.
- Revenues: Businesses often use CAGR to track how their sales figures are growing year-over-year.
- Earnings: Investors might look at the CAGR of a company’s earnings to understand how quickly it is increasing its profitability.
- Profits: Beyond just earnings, companies can use CAGR to measure the growth in net profit over a period.
- Investments: For personal finance, if you’re tracking the growth of an investment portfolio, CAGR can give you a sense of how your investments are growing annually.
- User Growth: Tech companies, especially startups, often use CAGR to measure the growth in their user base or subscribers.
- Market Share: Companies can use CAGR to track the growth or decline of their market share in a particular industry.
For many businesses and investors, the two most common applications of CAGR are for tracking earnings growth and revenue growth. Earnings growth shows how effectively a company generates profit. On the other hand, revenue growth is often called the “top line” of a business. It’s the total amount of money a company brings before any expenses are subtracted. By focusing on the CAGR of revenue growth, you’re looking at how the core business activities are growing without the noise of costs, expenses, and other factors. It clearly shows the company’s sales and business expansion growth trajectory.
Focusing on revenue growth makes sense in our case. Suppose you’re primarily interested in understanding how the business expands regarding sales and market reach. It gives a straightforward view of the company’s ability to increase its customer base, sell more products or services, and expand into new markets. Unlike other growth metrics that might only consider linear growth, the compound annual growth rate meaning paints a clearer picture of an investment’s progress over time by providing a smoothed annual rate of return.

What is a Good CAGR?
To answer what is a good CAGR, we first need to define which benchmarks we can compare our compounded annual growth rates. It is contingent on the company-specific fundamentals, the industry (or sector) benchmark established by comparable companies, and various other external factors.
Here is a general breakdown:
Company-Specific Fundamentals
- Business Model: The efficiency and sustainability of a company’s business model can heavily influence CAGR. A robust business model that caters to growing market needs can contribute to a higher CAGR.
- Financial Base: Revenue streams, profit margins, debt load, and liquidity ratios must be evaluated. A company with a strong financial base is likelier to achieve a higher CAGR.
- Growth Strategy: The company’s growth plans, such as expansion, acquisitions, or investment in R&D, will directly correlate with its potential CAGR.
Industry Benchmarks
- Competitor Performance: A comparison with key competitors’ CAGR allows for assessing the company’s position in the market landscape.
- Industry Growth Rate: Comparing a company’s CAGR with the average growth rate of the sector where it belongs provides insight into how well it performs within its sector.
- Life Cycle Stage: Different industries are at different stages of maturity. A high CAGR may be expected in a growing industry, whereas in a mature industry, a modest CAGR may be considered good.
Various External Factors
- Economic Conditions: The broader economic environment, including interest rates, inflation, and GDP growth, plays a vital role in determining what can be considered a good CAGR.
- Market Trends and Consumer Behavior: Shifting consumer preferences and emerging market trends can boost or suppress CAGR.
- Geopolitical Events: Unforeseen geopolitical events like political instability, trade wars, or pandemics can unexpectedly impact CAGR.
- Regulatory Landscape: Changes in regulations or governmental policies can either facilitate or hinder growth, thus impacting CAGR.
In conclusion, determining a good CAGR is not a one-size-fits-all exercise. It requires a comprehensive analysis of a company’s internal and external aspects. It is also essential to consider other factors and financial ratios when evaluating an investment or business performance.



















Practical Uses of the CAGR Formula
In finance and business, the compound annual growth rate calculation helps identify the geometric progression ratio that offers a consistent rate of return over time. Here’s a breakdown of its practical uses in various contexts:
- Business Valuation: CAGR can help determine the value of a business, especially when considering mergers, acquisitions, or investments. By calculating the CAGR of a company’s revenues or profits, potential investors or buyers can get a clearer picture of the company’s historical growth rate. A higher CAGR might indicate a more valuable business, assuming other factors are constant.
- Forecasting Revenue Growth: The Compound Annual Growth Rate (CAGR) is useful for understanding and forecasting revenue growth over a specified period. It can be practically employed by separating the effects of volume and price. Analyzing volume helps understand demand trends, market penetration, customer base expansion, and other related aspects. Understanding pricing gives insight into market positioning, competitive dynamics, value perception, and pricing strategies. By separating and analyzing volume and price, you can gain a more detailed and insightful understanding of revenue growth dynamics. This approach enables a more granular view of the underlying factors affecting revenue growth and can lead to more informed and strategic decisions.
- Industry Benchmarking: The CAGR formula compares a company’s performance against industry peers or the market average. It’s an essential tool for comparing and benchmarking companies, especially when assessing investment opportunities, growth potential, and the general health of a business. As mentioned, CAGR can benchmark a company’s average growth of any set of values, i.e., earnings, revenues, EBITDA, etc. A company may be underperforming if its CAGR is lower than the industry average.
- Tracking Business Performance: Companies perform compound annual growth rate calculations to assess how well the business grows over time. CAGR offers a smoothed annual rate that eliminates the effects of volatility and fluctuations, giving businesses a clearer picture of their true performance trajectory.
In summary, CAGR is a versatile formula that provides valuable insights into the growth trajectory of businesses and investments. It’s a standardized measure that can be used across various contexts to evaluate performance, make predictions, and make informed decisions.











Limitations of the Compound Annual Growth Rate Calculation
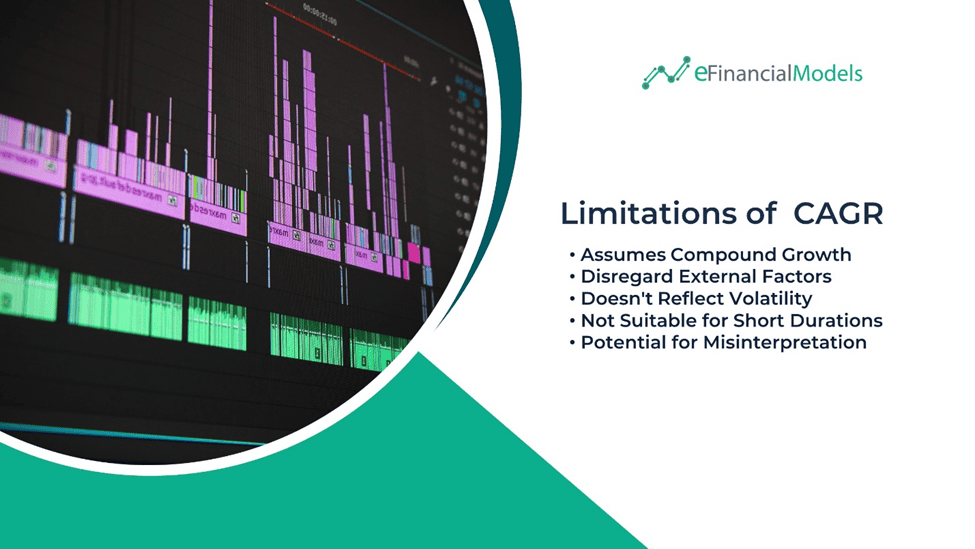
The geometric progression ratio that offers a constant rate of return over time is understood by the compound annual growth rate (CAGR), a useful indicator in finance and investing. It does have some restrictions, though, much like other metrics. However, like all metrics, it has its limitations. Here’s a deeper dive into the limitations you’ve listed:
- Assumes Compound Growth: CAGR assumes that the investment grows at a steady rate over the time period. In reality, most investments grow at a different rate year after year. There might be years with high growth and others with low or even negative growth. Using a single average rate, CAGR smoothens the effects of volatility and fluctuations.
- Disregard External Factors: CAGR calculation only considers the initial and final values over a time period and does not consider external factors that might have affected the growth. It includes changes in market conditions, competition, regulatory environment, and other macro and microeconomic factors. As a result, it can only give a complete picture of an investment’s performance.
- Doesn’t Reflect Volatility: While CAGR gives an average growth rate, it doesn’t reflect the ups and downs that investments might have gone through during the period. Two investments might have the same CAGR but very different volatility profiles. One might have steady growth, while the other might have significant fluctuations. For investors, understanding volatility is crucial as it relates to the risk of the investment.
- Not Suitable for Short Durations: CAGR is most meaningful for longer durations where compound growth plays a significant role. For short durations, the compound effect might not be substantial, and using CAGR might not be appropriate. It can give misleading results if used for periods of less than a year or for investments that don’t compound.
- Potential for Misinterpretation: Since CAGR smoothens out the effects of volatility and provides an average growth rate, there’s a potential for misinterpretation. Investors might assume the growth was steady over the period, which might not be true. It’s essential to use CAGR in conjunction with other metrics and not rely solely on it to make investment decisions.
In conclusion, while CAGR is a valuable financial tool, it’s essential to understand its limitations and use it judiciously. Using multiple metrics and analyses to view an investment’s performance comprehensively is always good practice.
CAGR – The Correct Way to Calculate Average Growth
The Compound Annual Growth Rate (CAGR) is a crucial metric in finance and investment because it provides a smoothed annual growth rate, eliminating the effects of volatility and fluctuations during the period. Unlike a simple average growth rate, CAGR considers the compounding effect essential when understanding the growth of investments or any business metric over multiple years. By using CAGR, investors and analysts can get a clearer picture of an investment’s return over time, making it easier to compare the performance of different investments or to assess the growth of a company’s revenue or profit over several years.
The Compound Annual Growth Rate remains a cornerstone in financial planning and analysis. Its ability to provide a smooth average growth rate over time makes it invaluable for investors, analysts, and businesses. It offers a consistent measure allowing easy comparison between investments or business metrics over time. As investments often grow due to the reinvestment of earnings, CAGR accurately captures this compounding effect, providing a more realistic view of an investment’s growth potential. This consistency is vital for analysts and investors when making decisions.
CAGR provides a clear picture of past growth and can be used to make future projections. When used in financial modeling, it can give a comprehensive view of a company’s future financial performance under various scenarios. However, as with all financial tools, it’s crucial to approach CAGR with a discerning eye. Always consider the broader context, and use it in tandem with other metrics to ensure a well-rounded analysis. What other tools, for example? Doing so lets you make more informed decisions and better understand the financial landscapes you navigate.

You might also like:
- 10 Main Elements of a Business Plan
- 10 Tips to Develop a First Class Business Valuation Report
- A Deep Dive Into Understanding 10K Reports
- 5 Steps to Create a Drop Down List Using Data Validation in Excel
- Financial Modeling for Startups and Small Businesses
- How to Build a Capitalization Table
- How to Calculate Annual Recurring (ARR) Revenue for Sustainable Growth
- How to Calculate the Net Present Value (NPV)?
- Financial Forecasting Models by eFinancialModels
- How to Use Inflation Projection to Your Advantage
- Financial Ratios Analysis and Its Importance
- 10 Ideas to Increase Average Revenue Per User
- Budgeting
- Business Valuation
- Financial Planning
- 10-Step Financial Planning Checklist for Smart Executives
- Funds for Startups
- Startups
- General Financial Model Bundle
- Financial Feasibility Study