
0 ITEMS

7 Key Tips: How to Best Work With a Financial Model Template

A well-crafted financial model template is the compass that guides your business decisions through the uncertain waters of the future.
- Templates simplify the process by offering ready-made structures that focus on assumptions, calculations, and references.
- Color coding in models helps distinguish between input assumptions, calculated data, and linked references, reducing errors.
- Effective use involves thorough research, realistic assumptions, and regular updates to reflect market changes.
- Using tools like trace precedents enhances understanding of data flow and formula dependencies.
- Running scenario tests and adjusting assumptions ensure the model remains reliable for strategic choices.
If you’re new to financial modeling, diving into a financial model template can feel like stepping into uncharted waters. But fear not – using a financial model template is designed to make your life easier, not more complicated. At eFinancialModels.com, we offer a wide variety of templates, each tailored to specific industries or business needs, so you can focus on understanding the numbers rather than building them from scratch. In this blog, we’ll explore how to get the most out of your financial model template, whether you’re a finance newbie, an entrepreneur, or an experienced professional.
What Does a Financial Model Look Like?
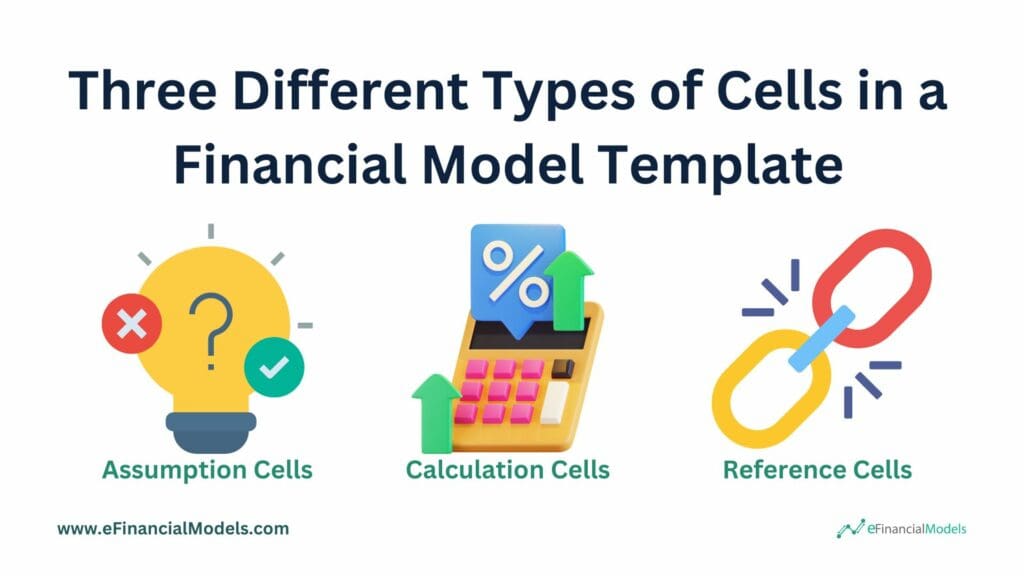
First, getting familiar with the template’s structure and what a financial model looks like is important. A financial model template can be developed using Microsoft Excel or Google Sheets. Excel’s powerful formulas and advanced functionalities make it ideal for complex models, while Google Sheets provides collaborative features that allow real-time access and updates across teams. These templates offer a flexible framework to evaluate different financial scenarios, empowering decision-makers with actionable insights and instilling confidence and capability. However, please note that many of our financial modelers offer free PDF demos, letting you preview the model structure before you buy. So, what does a financial model look like? In general, it contains three different types of cells:
- Assumption cells are where you input all the key information that drives the rest of your financial model. These are values you think will happen, like how much you expect to sell, the cost of making products, or the growth rate of your business. Assumption cells are usually highlighted in a different color to make it easy for anyone using the model to adjust these inputs, which will update the entire model automatically.
- Calculation cells are where the “number crunching” happens. These cells take your assumptions and use mathematical formulas to determine revenue, profit, expenses, and more. They transform your inputs into useful financial projections. These cells do the heavy lifting and help you understand how your business will perform based on the given assumptions.
- Reference cells pull information from other parts of the model to make calculations easier and reduce errors. Instead of typing in the same number multiple times, you use reference cells to link to the original value. This way, if you change an assumption, it automatically updates throughout the entire model, ensuring that all your calculations remain accurate and consistent.
In essence, a financial model template consists of a sequence of assumptions, calculations, and references arranged logically and in a logical and presentable manner. So, what does a financial model look like? The end product can look something like this.
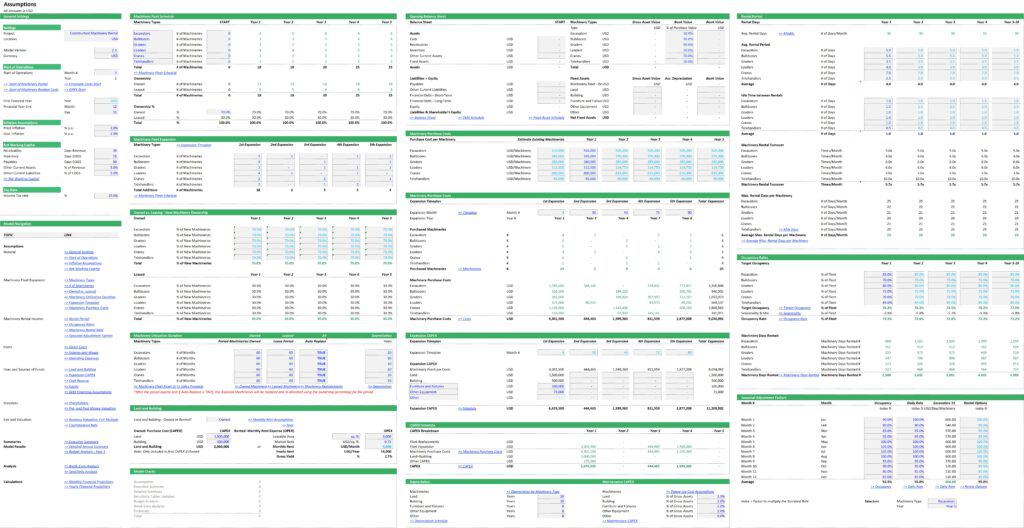
Our financial model templates employ a color-coding system that is crucial for understanding and accuracy. There are three types of cells commonly used, as seen in the Construction Machinery Rental Company Financial Model above. The assumptions, highlighted in blue, are the input values that drive the model’s projections, particularly in sections like ‘General Settings,’ ‘Rental Period,’ and ‘Owned vs. Leasing.’ Calculations, displayed in black, show derived figures in sections like ‘Machinery Rental Income,’ ‘Depreciation,’ and ‘Machinery Days Rented.’ References, such as model checks and other linked components, are indicated in green, ensuring that all necessary inputs and calculations are properly connected and verified for consistency throughout the model. This color-coding system plays a key role in promoting accuracy in financial modeling, making it easier for users to differentiate between user inputs, calculated data, and reference checks, thereby reducing errors.
















































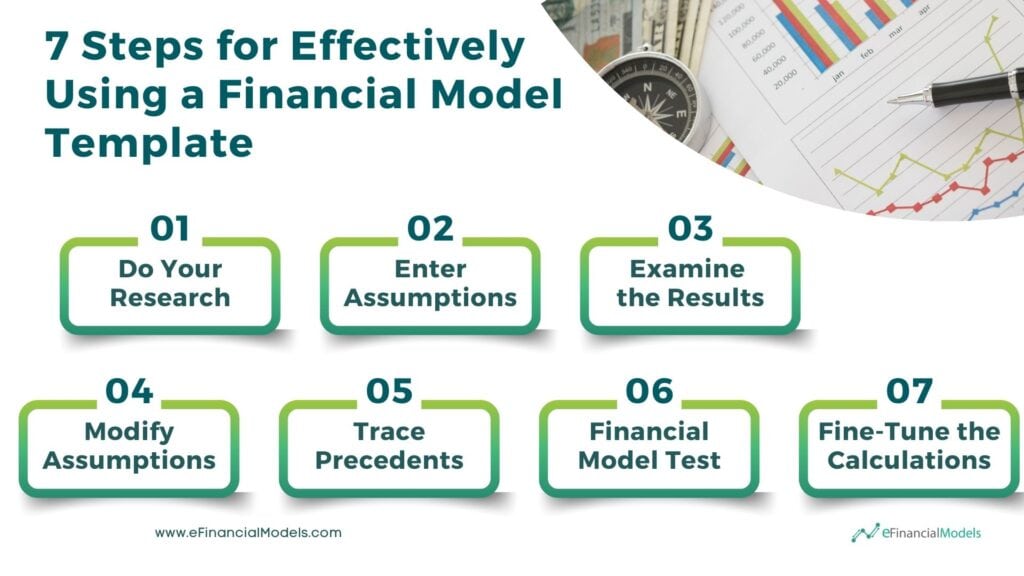
Steps for Effectively Using a Financial Model Template
At eFinancialModels, we offer financial model templates, not custom-built financial models. The key difference is that a financial model is a fully customized tool tailored specifically for a business’s unique needs, requiring significant time and expertise to create from scratch. In contrast, our financial model templates are pre-built frameworks designed to save you time, offering a structured, ready-to-use solution where you can input your specific data and assumptions. These templates provide the flexibility to adapt to various industries and scenarios while avoiding the complexity and cost of building a model from the ground up.
Templates are a starting point, but the value really lies in customization. Remember, a financial model is only as good as your information. Effectively using a financial model requires more than just inputting numbers—it demands a clear understanding of the business dynamics, careful scenario planning, and strategic analysis. The key lies in organizing assumptions logically, ensuring data accuracy, and frequently updating the model to reflect changing conditions.
Step 1 – Do Your Research for the Best Financial Model Template
Before using a financial model template, gather accurate data. Check your company’s past sales, costs, and profits to spot trends. Look at public reports on market size, competitor pricing, and industry demand. If competitors are publicly traded, their financial statements can offer useful insights. When data is limited, ask managers or industry experts for estimates. Solid research leads to better decisions.
Strong assumptions make strong models. Here’s where to look:
- Your Company’s History – Past sales, costs, and profits show trends.
- Public Data – Market reports, competitor pricing, and industry trends help predict future numbers.
- Competitor Data – Public companies share financial reports. Use them for benchmarks.
- Expert Estimates – Your managers or industry experts can provide insights when data is limited.
The better your research, the more useful your model will be. You can browse our Use Case, Industry, Author, and Advanced Search pages to find specific financial model templates.
Step 2 – Enter Assumptions Based on Realistic Data
Every financial model relies on assumptions about revenue growth, market trends, or operating costs. To get the most out of your template, you must replace generic assumptions with data that reflects your business’s specific situation. It ensures that your projections are realistic and actionable. For instance, if your business operates in a seasonal industry, your revenue assumptions should reflect fluctuations accordingly. Similarly, adjust cost estimates for inflation, supplier changes, or staff turnover rates. The closer your assumptions align with reality, the more reliable your model will be.
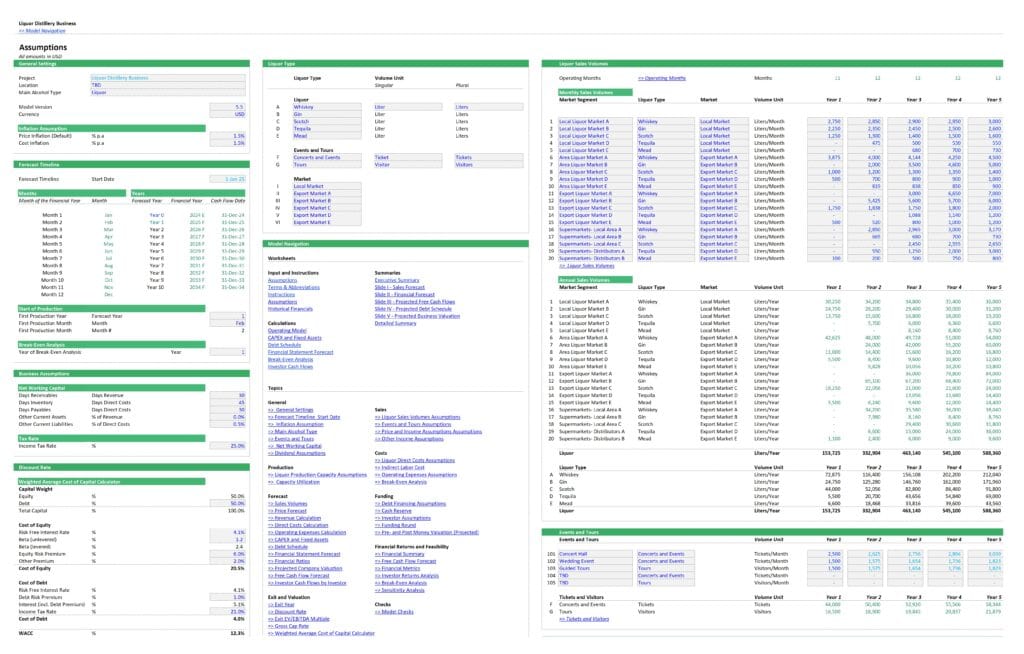
The assumptions in this Liquor Distillery Financial Plan Template provide a foundational framework for projecting the business’s performance and financial viability. They cover areas such as inflation rate, cost of capital, production start date, and sales growth projections for various liquor types and markets (both local and export). These assumptions align with reality by using reasonable estimates for sales volumes, costs, and market conditions, which reflect common industry practices and market trends. For instance, the discount rate incorporates equity and debt components, providing a realistic Weighted Average Cost of Capital (WACC). Business assumptions like working capital cycle, tax rate, and production capacity are also grounded in typical industry benchmarks, ensuring the model is practical and applicable for decision-making.
Look closely at the financial model assumptions (we usually use blue font color and a grey background for inputs). However, many financial model templates do not use any separating color coding. If your financial model template does not have such color coding, consider adding a different font color during your initial review. Furthermore, financial model assumptions can be summarized in one assumption section but are more often spread across the model. You should review the model thoroughly to determine where the assumptions are.
Step 3 – Examine the Overall Results
Once you’ve entered all the relevant inputs, it’s crucial to take a step back and assess the model’s key financial outcomes. Ask yourself, “Why do revenues or costs look like this?” Analyze if the trends align with your expectations and whether seasonality or growth assumptions are accurately reflected. Then, evaluate the profits—are they reasonable given the revenue and cost structure? Lastly, key financial metrics should be considered.
Financial analysis and planning, especially in the context of investment evaluation, are greatly facilitated by a solid understanding of key financial metrics. Our financial model templates, which are designed to be practical and user-friendly, regularly incorporate these metrics:
- Net Present Value (NPV) determines the value an investment adds after accounting for its costs.
- Internal Rate of Return (IRR) gives an annualized percentage return, allowing comparisons across projects.
- Cash on Cash Yield offers a perspective on the annual return relative to the initial investment.
- Payback Period highlights how quickly an investment can recover costs.
- Cash on Cash Multiple provides a simple, cumulative ratio of returns to the initial capital, indicating the overall profitability.
These metrics offer a comprehensive toolkit for making informed investment decisions that balance returns and risks.
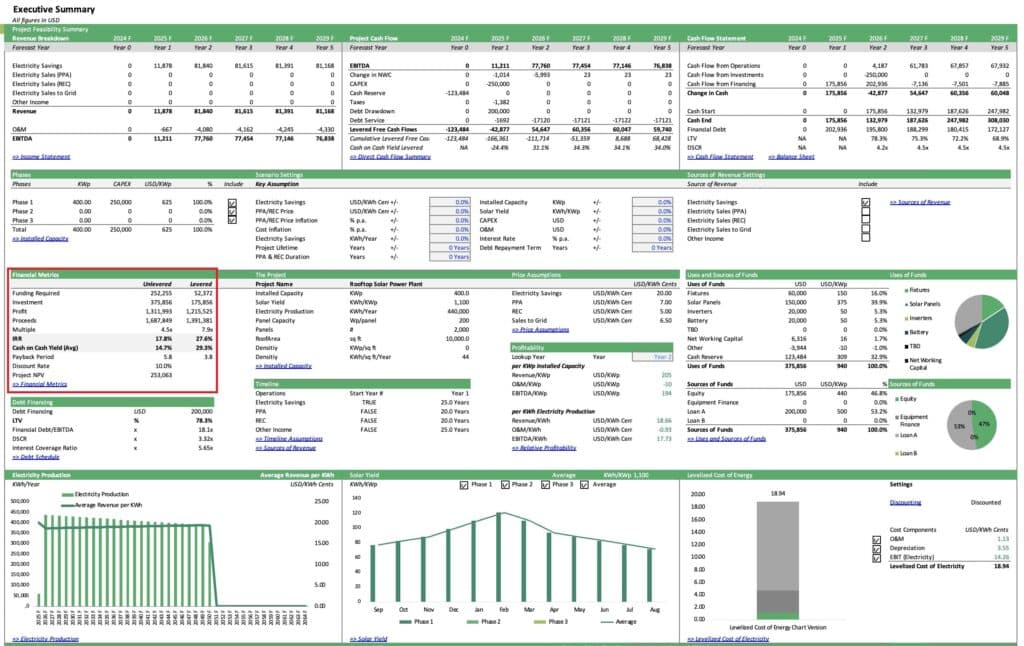
Examining the overall financial metrics is crucial for effectively using a financial model template like the above Rooftop Solar Power Plant Template. The highlighted financial metrics provide insights into the project’s profitability, risk, and viability, helping stakeholders assess if the investment will generate the desired returns and how quickly capital can be recovered. For example, NPV and IRR help measure the expected future cash flows in present value terms, guiding investment decisions. Cash Yield and Payback Period offer insights into liquidity and recovery timelines, while the Cash Multiple indicates the return relative to the invested amount. These metrics give a comprehensive view, allowing investors and decision-makers to understand whether the project aligns with their financial goals and risk appetite.
Step 4 – Modify Assumption as Needed
The next strategy to best work with a financial model template is modifying assumptions to ensure your plan aligns with reality. Assumptions are the foundation of your financial projections, encompassing variables such as sales growth, costs, market size, and other key metrics. Since real-world factors are dynamic, your assumptions need to adapt accordingly to maintain the accuracy of your forecasts. Use data insights, industry benchmarks, and current trends to periodically revise your assumptions, adjusting them as you gather more information or when market conditions shift. By doing so, your financial model becomes a living tool, helping you make well-informed decisions and keeping your business strategy on track.
While templates provide a solid foundation, they may only partially align with some business models. Modifying assumptions, rearranging sections, or adding new components is often necessary to capture your business’s nuances. For example, companies with multiple revenue streams may need to add more detailed revenue breakdowns in the template, emphasizing the importance of thoroughness. Ensure that all changes are made systematically and documented clearly to maintain transparency. Misaligned formulas or improper adjustments can lead to costly mistakes.













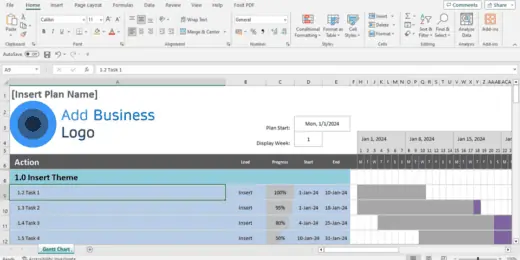































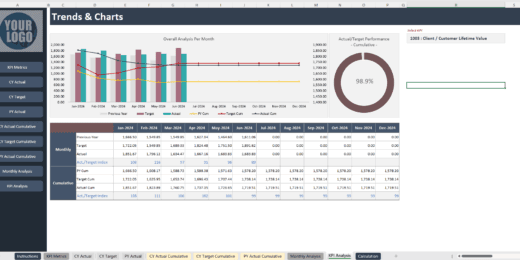







Step 5 – Put Trace Precedents in Action
Trace precedents are a feature in spreadsheet tools like Excel that allows you to visually track which cells are used to calculate a particular value. When working with a financial model template, putting trace precedents into action can be invaluable in understanding the flow of data and the logic behind the calculations. By identifying the cells feeding into key formulas, you can quickly verify the accuracy of inputs, detect potential errors, and better grasp the dependencies within the model. It helps make confident adjustments to the template and ensures that any changes ripple through the financial model predictably, enhancing accuracy and reliability.
How to Use Trace Precedents in Excel
Here’s a step-by-step guide on how to use trace precedents in Excel:
- Select the Cell: Click on the cell for which you want to trace the precedents (the cell that contains a formula or a value influenced by other cells).
- Go to the Formulas Tab: On the Ribbon, click on the Formulas tab.
- Click on Trace Precedents: In the Formula Auditing group, click the Trace Precedents button. Excel will draw arrows to show you the cells that feed data into the selected cell.
- Multiple Levels: If there are various precedents, you can keep clicking Trace Precedents to reveal more arrows that lead to the cells that indirectly influence the value.
- Remove Arrows: To clear the arrows, go back to the Formulas tab and click Remove Arrows.
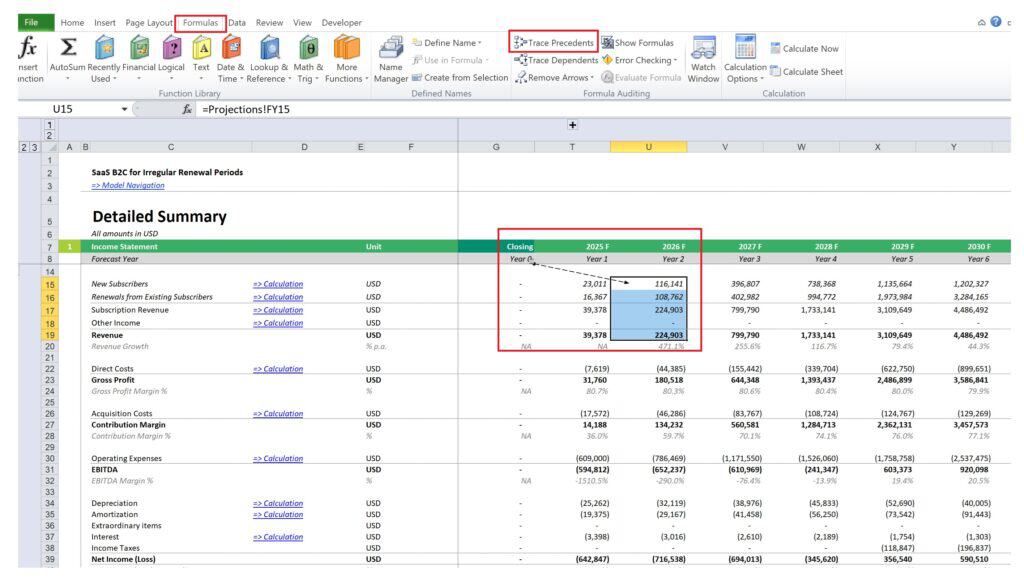
In Excel, the “Trace Precedents” tool is useful for understanding how different cells relate, especially in complex financial models such as the above SaaS Financial Model Template. In the given template, for example, if you want to know which cells contribute to the calculation of “Revenue” in 2026 (cell U19), you can select this cell and use “Trace Precedents” to see all the input cells, which can help you verify and troubleshoot the formula. This feature is particularly helpful for tracking dependencies across different sheets, ensuring transparency, and maintaining the accuracy of your financial projections.
Knowing how to use trace precedents in Excel is essential for effectively troubleshooting and understanding complex formulas, ensuring that data relationships are clear and correct. It helps prevent errors by revealing the dependencies behind calculations, providing a clearer picture of how values are derived within your spreadsheet.
Step 6 – Undertake a Financial Model Test
A financial model test evaluates a financial model to ensure its accuracy, reliability, and usefulness in decision-making. The approach involves running different scenarios, stress-testing assumptions, and assessing how changes in key inputs affect the model’s outputs. Undertaking a financial model test allows you to understand its behavior under various scenarios, providing crucial insights into how different variables impact the overall financial performance. By manipulating key inputs—such as sales growth rates, cost assumptions, or pricing—you can see how changes cascade throughout the model, affecting profitability, cash flow, and valuation metrics.
How to Do a Financial Model Test
Here are the basic steps to undertaking a financial model test:
- Determine which assumptions have the most significant impact on your model. Examples include revenue growth rates, cost of goods sold, discount rates, or project timelines.
- Create different scenarios like “Best Case,” “Base Case,” and “Worst Case.” Adjust the assumptions accordingly, such as increasing revenue or decreasing expenses for the Best Case and vice versa for the Worst Case.
- Document how the key financial metric, specifically the IRR, changes in each scenario.
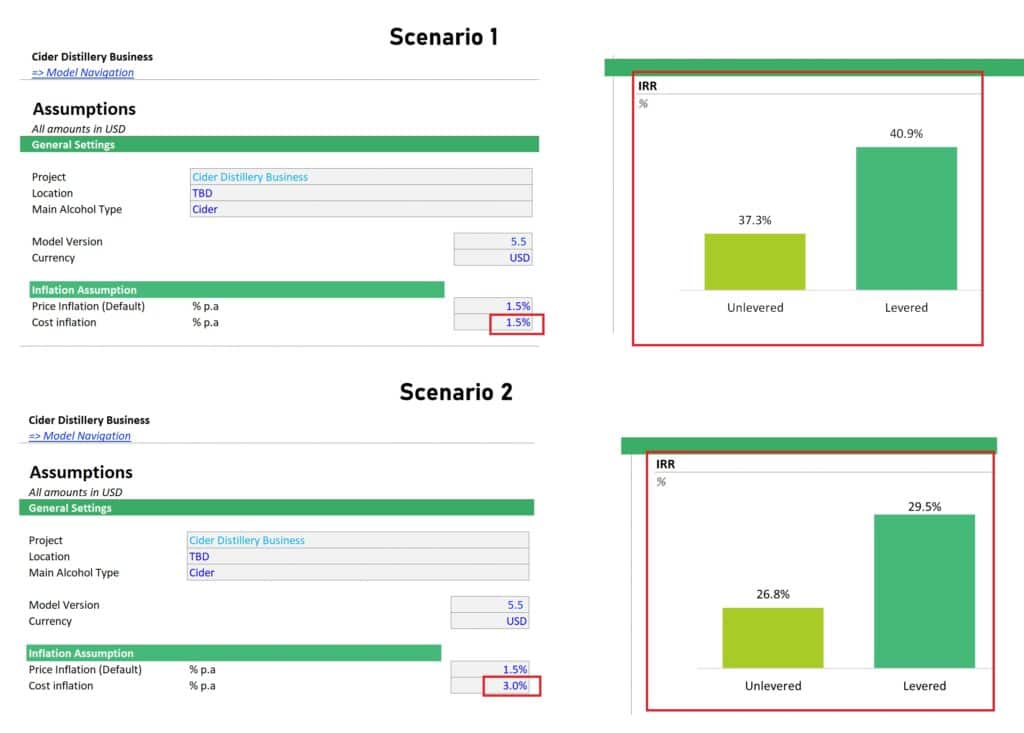
The above financial model test example for a Cider Distillery Financial Model presents two scenarios to examine the impact of cost inflation on the Internal Rate of Return (IRR). In Scenario 1, cost inflation is set at 1.5%, resulting in an unlevered IRR of 37.3% and a levered IRR of 40.9%. In Scenario 2, cost inflation is increased to 3.0%, leading to a decrease in unlevered and levered IRRs, dropping to 26.8% and 29.5%, respectively. It illustrates that higher cost inflation negatively affects the profitability of the project, reducing both unlevered and levered returns, with a more pronounced effect on the unlevered IRR.
Step 7 – Fine-Tune the Calculations
When using a financial model template, it is essential to update the predefined calculations to reflect your business’s specific needs better. While templates provide a great foundation, they cannot account for the unique characteristics of every business. By updating formulas, you can adjust for variables such as differing revenue streams, specific cost structures, or particular growth assumptions unique to your scenario. This customization ensures the model outputs are realistic and relevant, providing more accurate insights directly applicable to your financial decision-making. Fine-tuning formulas is key to maximizing the utility of the model for your own business case, offering clarity and precision in your projections.
When updating the formulas, use consistent, logical methods to modify linked cells, maintaining the integrity of interconnected calculations across different sheets. Document any changes clearly so that the model remains easy to follow for others. Additionally, regularly test the modified sections by running various scenarios to verify the changes’ accuracy, ensuring that your updated model remains reliable and robust for decision-making.
Seek Financial Modeling Assistance
We hope this article provides guidance and insights on how to best work with a financial model template. Remember you’re with others if you run into any issues or feel stuck. Our templates are user-friendly but can only be challenging with limited financial background knowledge. Don’t hesitate to reach out for support, whether consulting our help guides or contacting a finance professional. Collaboration and asking questions will help you learn faster and make better decisions. If you need assistance in customizing a financial model template, the author of the model would be the best point of contact to check for financial model help. Check the author profile on the product page, refer to the custom financial modeling services, or contact us.
Feel free to leave us your comments. Happy Modeling!

















You might also like:
- 10 Main Elements of a Business Plan
- 10 Tips to Develop a First Class Business Valuation Report
- 14 Best Practices in Financial Modeling
- How to Build a Business Valuation Model
- Cash Flow Analysis in Excel
- How to Write a Business Plan Step-by-Step
- Understanding the Debt Service Coverage Ratio: An Essential Metric for Financial Analysis
- Understanding What is Yield to Maturity and Why It Matters
- Achieve Financial Success By Knowing Your Business Plan Model
- How Can You Make Your Startup Successful?
- Financial Projections Templates – The Easy Way
- Cash Flow Statement: Streamline Financial Success
- 10-Step Financial Planning Checklist for Smart Executives
- Financial Model Templates Easy to Use
- Finding Fair Market Value: A Quick Guide to Real Estate Valuation
- Financial Modeling with Excel: Fundraising Plan Tactics
- How to Master the Art of Financial Forecasting
- 5 Steps to Create a Drop Down List Using Data Validation in Excel
- Top 10 Mistakes in DCF Valuation Models
- Startup Model Templates in Excel that can help your Business Grow
- Simple Budget Planner Template


Hi. I need a 5 year startup car park model to be presented to my investors. there are 4 locations to start off. Can model be re-designed to accommodate these specifics? this would reduce vital adjustments which have pervasive effects on the whole excel file.