Valuation with Multiples – The Basics

Have you ever heard of valuation with multiples? Imagine you are looking for a house to buy, so you contacted a real estate agent, and he says the asking price for a house is $400,000 or around $500 per square foot. As a buyer, is this helpful? What does it entail? Can you tell whether the house is expensive or cheap? What does the price tell you?
The answer is….nothing. The price in isolation is meaningless because you have to consider other factors such as the location, neighborhood, the type of house, number of beds and bathrooms, and, importantly, the prices of similar houses. The asking price is only meaningful if you compare it with another house that has the same features and location.
The same goes for investing in stocks. The tech giant Amazon’s Enterprise Value/EBITDA is 28.15x and the Price-to-Earnings ratio is 76.48x. But what does that mean? Is the stock overvalued or undervalued? Is it a buy signal and a good stock to add to your portfolio? For the Enterprise Value/EBITDA and Price-to-Earnings ratio to be meaningful, it has to be compared with the valuation of similar companies. You can call this comparison process the valuation with multiples.
Key Fundamental of Valuation with Multiples
The relative valuation model is a valuation model that is based on the idea that similar assets sell at similar prices. Two approaches that use this model are comparative analysis and precedent transaction analysis. For this article, we will be focusing mainly on comparative analysis.
Comparable Company Analysis or “Comps” analysis approach values a company using multiples of similar companies.
Valuation with multiples is measurement tool that assess a stock’s financial indicator as a ratio of another financial indicator. The term “multiples” is a catch-all phrase for a class of indicators or metrics used to value a stock, this approach aims to value similar companies using the same financial metrics.
The valuation multiple is a ratio of economic value, the numerator represents the value of measure and the denominator is the value driver.

Value Measure represents:
- Current share price
- Market capitalization (market cap)
- Calculated by multiplying the company’s current share price multiplied by outstanding shares
- Enterprise value (EV)
- Also known as firm value
- Calculated by the sum market of value of equity (market cap) and market value of debt less cash and cash equivalents.
Value Drivers commonly used in multiples are:
- Revenues or Sales
- EBITDA
- Earnings
Advantages and Disadvantages of Using Valuation with Multiples
Advantages
- Simple and straightforward to understand.
- No complex calculations are involved.
- Very basic math is used.
- No forecasts or assumptions are required.
- Incorporates the market’s perspectives or sentiments about the firm’s future earnings and risk.
- Valuation is based on current prevailing market data
Disadvantages
- Difficulty in selecting comparables or peer groups.
- This difficulty arises for reasons that are not associated with the true differences in value such as the difference in accounting policies (revenue and expense recognition) for an identical business operation.
- Highly dependent on the selected peer group. Unlike absolute valuation methods wherein an absolute intrinsic value is determined, if the peer group chose incorrectly then multiples do not reflect the true value of the stock or company.
- Assumes the market accurately values the peer group.
- Represents a “snapshot” of the stock or company’s performance at a point in time. Fails to capture unique and dynamic circumstances or characteristics of the stock or company such as trends in business, competition, etc.
Let us look into the different valuation multiples that are widely used.
Commonly used Valuation Multiples
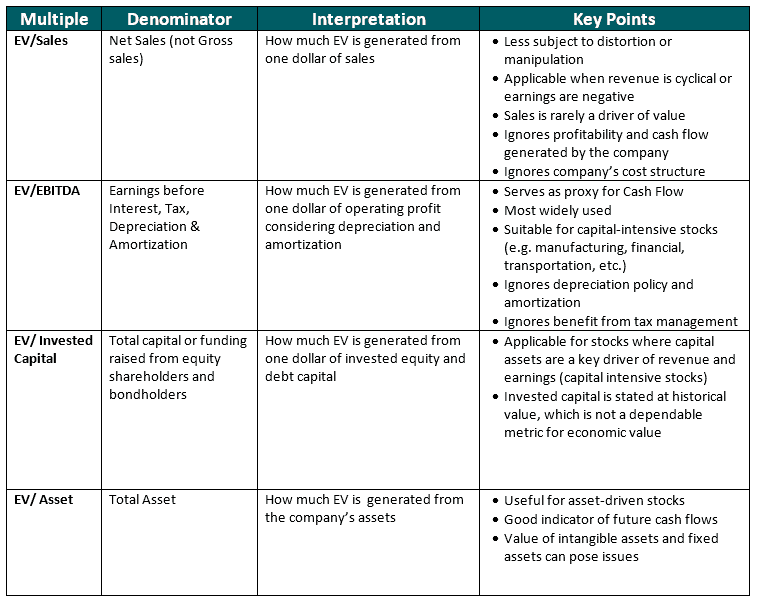
The two main types of valuation with multiples are Enterprise Value Multiples and Equity Multiples. Let us go over each type.
Enterprise Value Multiples
Enterprise value (EV) is the company’s total economic value and is considered a theoretical takeover price. This is regarded as an alternative to the company’s market capitalization as it not only takes into account the firm’s total equity but also its debt.

When using EV Multiples, important points to understand are:
- The most widely used multiples are EV/Sales and EV/EBITDA.
- These ignore financial leverage (Debt) and generally ignore Depreciation & Amortization.
- Typically less affected by accounting differences and the company’s capital structure.
- Appropriate for mergers and acquisitions.
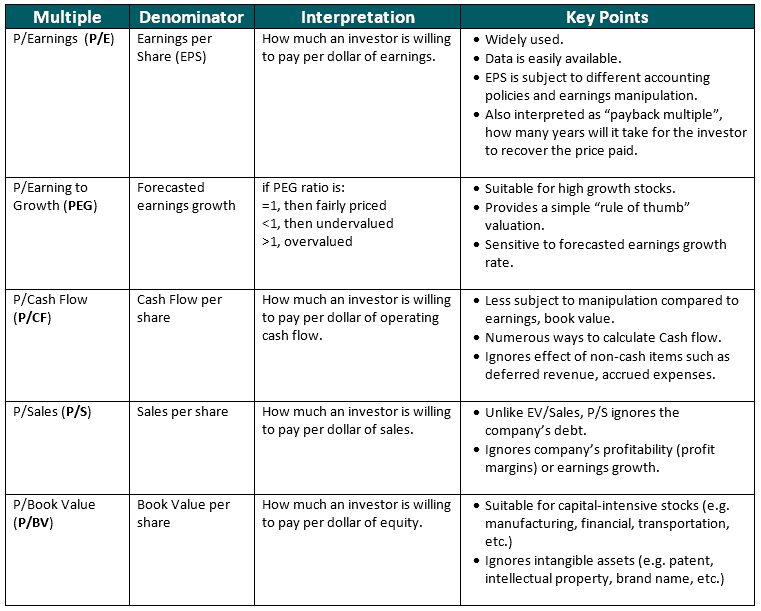
Equity Value Multiples
Equity value is simply the value of the company’s equity. Equity value multiples are a ratio of the stock’s market price (P) per share relative to fundamental value per share (e.g. sales, earnings, etc.). An investor evaluates whether a stock is overvalued or undervalued by taking into account what a share of the stock buys in terms of sales per share, earnings per share, etc.

When using Equity Multiples, important points to understand are:
- The most widely used Equity multiples are P/E, P/B, and P/Cash Flow (Levered).
- These ignore cash flow to Debt holders and are influenced by leverage.
- These determine the total company’s value based on common stock (Equity) only.
- Appropriate for taking a minority interest in a company.
The 4 Steps in Comparable Multiples Analysis
As mentioned before, valuation with multiples is used in comparable company analysis. The steps in conducting a comparative analysis are:
Step 1. Identifying and selecting comparable companies (“Peer Group”)
This is the most important element in comp analysis. In the real world, no two companies are alike. A peer group is a set of selected companies that are sufficiently similar to the company being valued.
The factors to be considered in identifying the members or constituents of a peer group falls under two company profiles:

Understanding what a company does is very important in selecting the peer group. A company’s business description is contained in its annual financial report, it gives you information about the product or service, the sector or industry, business segments, location, etc. Investor presentations can also give you an idea of what the company does as well as a snapshot of its operations. A company’s website also helps you visualize their products and services.
A quick and easy way to identify peer groups is in the company’s regulatory filings such as 10-K or annual report required by the U.S. Securities and Exchange Commission, You can search the words “competitors”, “competition” or “peers”. Another way is to look into the industry classification standard.
This step aims to achieve an apples-to-apples” approach to comparison, however, this step is often considered “art” rather than “science”.
Step 2. Gather Financial Data
After selecting the peer group, the next step is to gather relevant financial data for both the subject company and the peer group. Keep in mind that valuation is driven on the basis of both historical performances (like the last twelve months, “TTM”) and financial projections or estimates of the company’s performance (like consensus estimates for the future period).
You can go over the company’s corporate filings like the annual and quarterly reports manually (although this will be time-consuming). Having access to financial data providers (Bloomberg terminal, S&P’s Capital IQ, Value Line) will make this step easier. If you are looking at US-based public companies, you can also use Electronic Data Gathering, Analysis, and Retrieval system or EDGAR. This filing system was created by the Securities and Exchange Commission for the accessibility and efficiency of corporate filings. One advantage of EDGAR is the structure of the report, information is presented in one format only thus searching for specific financial information is found in a specific portion (part, item) of the filing regardless of which company.
Canadian listed companies also have a similar system called System for Electronic Document Analysis and Retrieval or SEDAR.
Ideally, you need to gather 3-5 years of historical financial performance. You will be using the Income Statement, Balance Sheet, Cash Flow Statement as well as the Notes to Financial Statement. From these filings, you can extract the following:
- Revenue or Sales
- Gross Profit
- EBITDA
- EBIT
- Net Income or Earnings
Other key information are:
- Company Name
- Ticker Symbol
- Share Price
- Outstanding shares
- Net Debt
- EPS
- Cash Flow
- Assets
- Analyst estimates
Aside from historical performance, if you want a more comprehensive analysis, you can also gather forward-looking (forecasted) financial data for the next 3-5 years. A good source of information you can use is to look into research reports prepared by analysts, these are commonly offered by online brokers and brokerage firms. A company’s earnings guidance can also be helpful as it focuses on sales or earnings expectations considering industry and macroeconomic trends.
Below is a summary table for the sources of information:

You can use an Excel spreadsheet similar to the below to organize the information gathered.

Step 3. Calculating the appropriate Valuation Multiples
Once all necessary financial information is gathered for each of the companies, you can calculate the appropriate multiples. This process is called “spreading the multiples”, the term describes the calculation of multiples and presenting it in an easy-to-read format, typically using a spreadsheet, allowing users to quickly see the valuation multiples across the selected peer group.

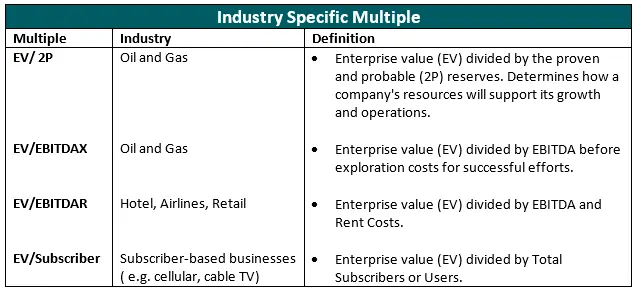
You can also add Industry-specific multiples to your Excel spreadsheet.

Step 4. Determine the Valuation
The multiples for the peer group serve as the basis for determining the appropriate valuation range of the target company. Typically, you can use averages, medians, lows, and highs of the relevant multiples to frame the valuation.
Companies that are above (below) the average and median, imply the stock is overvalued (undervalued). Low and High multiples help in detecting outliers that you can remove or exclude especially if these are too far apart from the average and median.

Best Valuation with Multiples?
There is no correct or best way to determine a company’s value. When analyzing companies, using multiples in isolation is not advisable and prudent. Valuation with multiples together with other valuation methods enhances analysis and facilitates a much deeper understanding of the stock, company, its peers, and the sector or industry dynamics.
Also, valuation multiples capture the current market sentiment of the relationship between value and what drives value. This process explains why common multiples are the same or vary (different) across peer groups, this leads to insights that are not apparent in other valuation methods.
Incorporating the widely used valuation method DCF Model (Discounted Cash Flow Valuation Model), as well as understanding other common valuation approaches, will provide you with a more robust analysis and valuation.

