Top 10 Mistakes in DCF Valuation Models

Today, the Discounted Cash Flow (DCF) method is one of the most solid valuation methodologies. A DCF valuation requires a business plan with minimum 5 year forecasted financials to derive the expected Free Cash Flows to Firm (FCFF) which then are discounted by using the company’s Weighted Average Cost of Capital (WACC) [the Discount rate] to get the present value of the company’s future Free Cash Flows. Cash Flows beyond year 5 are factored in with the Terminal Value (TV) calculation.
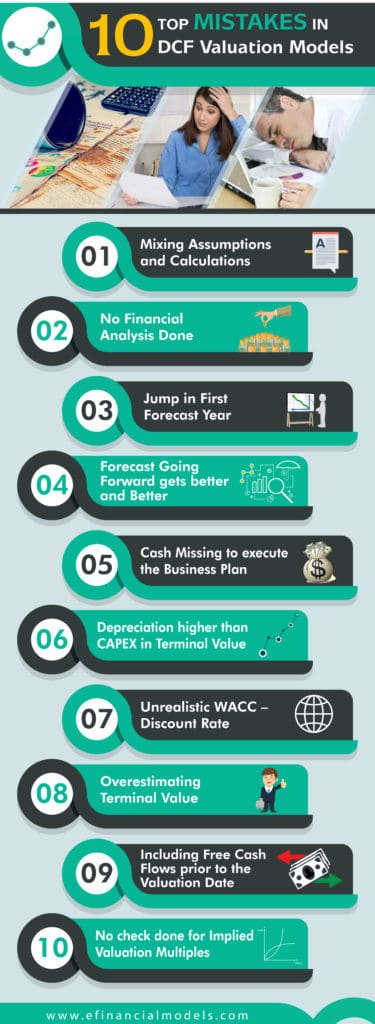
By reviewing hundreds of DCF valuations, we have noticed a repetitive pattern of common mistakes made in such valuation models, seen over and over again.
The following is our list of the Top 10 Mistakes done when building DCF Valuation Models.
(1) Mixing Assumptions and Calculations
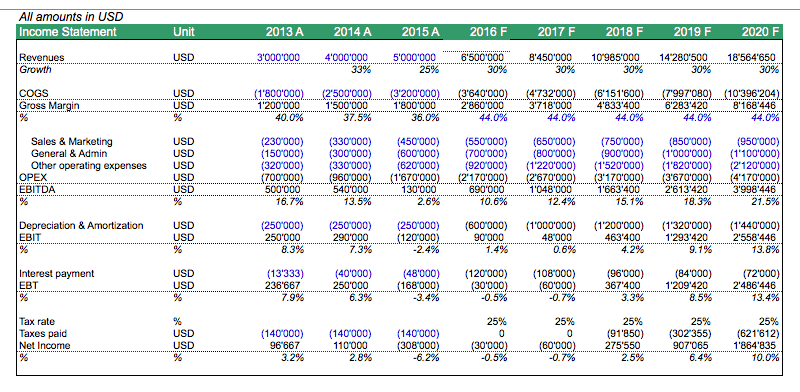
Spreadsheets are easier to read if it’s clearly stated which cells are the assumptions (input) and which cells are the calculations (output). Normally, this is done by using different colors, e.g. blue for assumptions and black for calculations. Depending on the model, assumptions can either be summarized on a separate assumption sheet or in case it’s easier to read (avoiding back and forth), is placed directly next to the calculations but clearly marked in blue. See below on how the color coding makes the financial model much easier to read.
Confusing
Better
(2) No Financial Analysis Done
Before going into any business plan, it’s highly recommended to first undertake a financial analysis of the business to value.
- What are the historical profit margins such as EBITDA?
- Does the company have sufficient Net Working Capital (Current Ratio)?
- Required Days Receivables, Days Inventory, and Days Payable?
- What is the efficiency of the allocated capital (Revenues/Assets)?
- How much was the historic Return on Invested Capital (ROIC) and what is a likely scenario going into the future?
- How does it compare to the level of financial debt to the debt capacity of the company?
E.g. below is a table that shows the forecast for Days Receivables, Days Inventory, and Days Payables, which seems to be disconnected from the historical figures. As a consequence, Net Working Capital levels might be significantly understated in the future, leading to a potential financing gap or dragging growth rates down.
(3) Jump in First Forecast Year
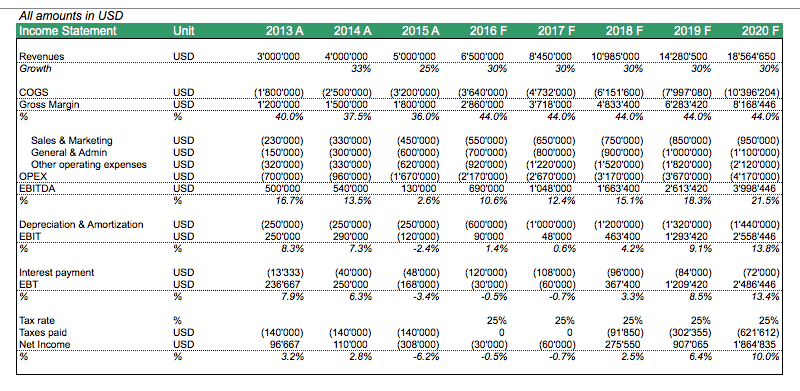
The first forecast year (2016) forms the starting basis for the financial plan. As you can see below, the Gross Profit margin jumps in 2016, and suddenly the company is performing much better than in its whole history.
The way to validate the first forecast year is to check for current projects which could drive such growth (see also CAPEX), check back for historic figures, industry benchmarks, and for quarterly results which can either support or deny the feasibility of the plan.
Please also note that for budgeting purposes, many budgets have to be aggressive in nature, but they might not be realistic to be used as a basis for a Discounted Cash Flow Valuation if one has to draw a realistic picture of the expected financial future of the company.
(4) Forecast Year 5 gets Better than Any Other Year Before
Entrepreneurs are always optimistic about the future of their company, so there is a natural bias to paint a bright picture of the company’s future. Also, mostly only next year’s budget needs to be defended as it can be challenged more easily than a figure 5 years down the road. This can lead to a bias where the business plan gets overly optimistic. This concerns mostly business plans promoting strong growth rates and profit margin increase at the same time, wherein reality mostly, it’s either pushing revenues at lower profit margins or focusing on profitable business by foregoing less profitable sales.
Another way to look at it is to focus on ROIC (Return of Invested Capital) which indicates the yearly profitability of the invested capital (equal to capital employed). Normally, ROIC should be a bit higher than WACC, but in the long-term, attractive ROICs will draw in competitors which make the ROICs diminish in the long-term. Therefore, for the final year of the forecast period – which also serves as the normalized cash flow year used in the Terminal Value calculation – there needs to be some caution applied when claiming to generate high ROICs till eternity.
(5) Cash Missing to execute the Business Plan
The business plan below shows a negative cash balance during year 1 to 3 of the forecast years. By focusing only on the Free Cash Flow calculation, one would not even notice it. Only by also checking the forecasted Balance Sheet, one can see the negative cash balance showing up. This means, the business is underfunded and will need an additional capital injection to execute this business plan. This needs to be considered in the valuation as well.
When looking at the business plan from a bank financing perspective, one needs to compare the operating profits vs. its financial debt obligations. Normally banks fund up to 3.0x Financial Debt/EBITDA, and values above either require a waiver or some additional guarantee/collateral in order to satisfy the risk department of the bank.
Below is a plan that shows clearly that there is way more financial debt used than the EBITDA justifies it. One explanation could be that e.g. the owner or the parent company had to provide a personal or corporate guarantee. This means the business cannot be valued as is, but actually, the value of the required guarantee needs to be considered as well as the valuation model should reflect the value of the business on a standalone basis without any need for additional guarantees or collaterals. One way to solve this problem is to include the amount of the guarantees as required equity injection in order to bring Financial Debt/EBITDA ratios down to a more reasonable level.
(6) Depreciation higher than CAPEX in Terminal Value
The last forecast year serves as a basis for the Terminal Value calculation, thus, all cash flows need to be normalized as they will be assumed to go on till eternity. One common mistake one can notice is that depreciation is assumed to be higher than the Capital Expenditures (CAPEX) in the long-run. This is illogical as the Fixed Asset Balance, which is increased by CAPEX and reduced by Depreciation, would become negative at some point if depreciation is higher than CAPEX. Normally, CAPEX is set equal to depreciation or set slightly higher than depreciation to count for the investment required to sustain future growth.
(7) Unrealistic WACC – Discount Rate
The Weighted Average Cost of Capital (WACC) is one of the key value drivers in any DCF calculation, as a higher WACC discounts future cash flows more than a lower WACC (present value gets higher). WACC bases on an opportunity cost calculation. The required return needed to convince an investor is to put his money into the company rather than investing in a company with a similar risk profile on the stock market. Thus, the WACC needs to compensate equity shareholders and lenders, for the assumed risk ,and ergo has two components:
- Cost of Debt
- Cost of Equity
Cost of debt can be determined when looking at a reasonable financing structure the company can use (Debt/Equity ratio) and by checking what are the debt financing costs. The challenge today is that the risk-free rates are very low and bank financing is very cheap in Europe and the US. So normally, we see the cost of debt before tax, between 3% – 6%, whereas the majority actually is the debt premium charged by the banks.
Cost of equity equals to the risk-free rate plus a market premium (ca. 4.5% – 6% for US and Europe depending on source). The market risk premiums is multiplied by the company’s beta (risk factor with respect to movements in the stock market). Additional premiums can be added if needed, especially if the company is highly dependent on a single key man (key man adjustment) or is small in size (Small Cap Premium).
Below is an example which uses a WACC of only 6%, hardly compensating investors and lenders for the risks of a dynamic and growing company. Hence, the impact on the valuation is that the company’s value becomes overstated. See also an example WACC calculation here for a detailed calculation of the discount rate.
(8) Terminal Value appears overstated
DCF valuations where nearly all value comes from the terminal value are problematic. The main issue is that it’s not that easy to accurately predict cash flows in 5 years. Thus, the quality of the forecast becomes weaker in the future and so does the quality of the valuation argumentation becomes weaker if nearly all value comes from the Terminal Value. Also, there must be a very good reason if the other forecast years are way below the cash flow generation capacity than the terminal value.
Terminal value is an estimate of what the company is worth in 5 years’ time, considering all future cash flows on a normalized level. Any valuation would need to be tested by the market. As a quick check, one can simply compare the Enterprise Value (EV) to EBITDA ratio at the time of exit.
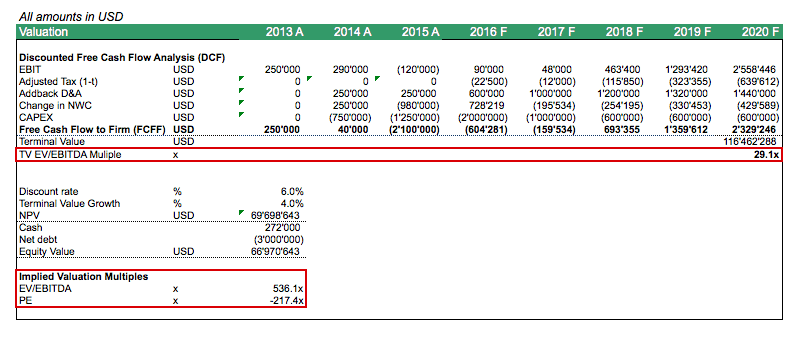
Below is an example that shows a 29.1x EV/EBITDA multiple, which is way beyond any reasonable range (normally, an EV/EBITDA ratio is between 4.0x – 8.0x). Only some industries showing higher growth or are less capital intensive, manage to get higher EV/EBITDA valuation multiples. So, one should simply check back the Terminal Value for the implied EV/EBITDA multiple.
Another solution can also be to extend the forecast period to 10 or 20 years instead of using a Terminal Value formula and model the cash flows more careful on a yearly basis.
In this case, the estimation of Terminal Value uses a simple FCFF/(WACC-g) formula (Free Cash flows capitalized by the Discount rate minus the Terminal value growth rate). The netted capitalization rate, thus, is only 2%. This appears unrealistic. So, the solution might be to recheck for a reasonable WACC and use a lower growth rate so that when checking for the implied EV/EBITDA multiple, the multiple appears realistic.
(9) DCF includes Free Cash Flows prior to the Valuation Date
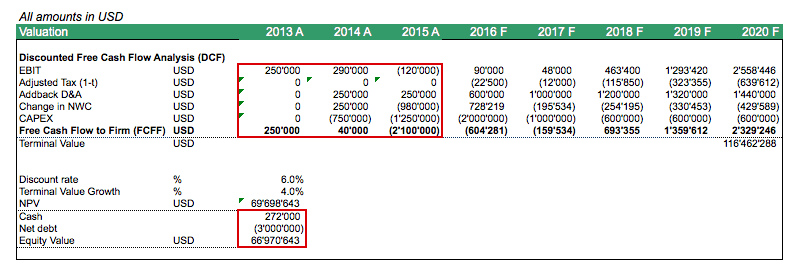
Discounted Free Cash (DCF) analysis means that only the future free cash flows should be considered in the valuation exercise. The example below also includes historic cash flows (2013 – 2015) which are not correct from a methodological point of view. If the valuation date is Dec. 31st, 2015 only cash flows from 2016 onwards should be considered. Each DCF valuation assumes a certain date, thus, the financial model should ensure only the future cash flows from that date are included in the valuation of the company.
(10) Implied Valuation Multiples are Out of Market
A DCF valuation should be checked also for its implied valuation multiples, mostly the implied EV/EBITDA multiple, and other multiples such as Price / Earnings (P/E) or Price to book (P/B) ratio. Those multiples should be compared to industry benchmarks based on publicly available data or recent transactions in that sector.
Below is another example that shows very high valuation multiples raising the question, how realistic those multiples are when having to convince an investor to pay his hard earned money for that company under fair market conditions.
As always, it is important to review your financial model properly and look at the whole. The same with building a DCF model, there will be times when you missed certain details which will greatly affect the accuracy of the projections in your model.
So, we hope that the above summary gave you a good overview of the most common mistakes when doing a DCF company valuation and highlight the areas to watch out for.
If you want to see more examples, check the excel files below for your reference. Also, if you think we missed something in our list, please free to let us know by making a comment below.
DCF – Financial Model Template


