
0 ITEMS

Why Financial Forecasting Models Are Vital for Your Business

Financial forecasting is essential for planning, decision-making, and risk management in a business.
- It estimates future revenues, expenses, and cash flows based on historical data and assumptions.
- Accurate models help identify key value drivers and set realistic targets.
- Forecasting methods include quantitative analysis of numerical data and qualitative judgment from experts.
- Using financial ratios, KPIs, and scenario analysis enhances understanding and strategic planning.
- Recognizing the limitations of forecasting models ensures better interpretation and more reliable results.
This article covers how financial forecasts support business growth and strategic decisions.
Financial Forecasting Definition – Predict, Plan, Prosper
The financial forecasting definition means estimating or predicting future financial outcomes or performance based on historical data, current trends, and relevant factors. It involves analyzing financial data, economic indicators, market conditions, and other variables to make informed projections about a company’s financial position, revenues, profits, expenses, and cash flows.
Financial forecasting models help businesses anticipate future financial needs, set realistic goals, evaluate potential risks and opportunities, and make informed financial decisions. These projections can cover short-term periods, such as monthly or quarterly forecasts, and long-term periods, such as annual or multi-year forecasts. An effective financial forecasting model is based on accurate financial and fundamental analysis. It shows how key value drivers develop and derive financial projections.
It’s important to note that a financial forecasting template does not guarantee accuracy in predicting future financial outcomes, as it relies on assumptions and estimates that may be subject to uncertainty or unforeseen events. However, it provides valuable insights and helps guide decision-making processes by providing a structured approach to understanding and planning for the future financial performance of an entity.
Financial Forecasting Methods
Financial forecasting is essential to the financial planning and analysis process flow. Financial forecasting methods can be broadly categorized into two: quantitative forecasting and qualitative forecasting.
- Quantitative forecasting relies on historical numerical data and statistical models to predict future financial outcomes. It involves using mathematical and statistical techniques to analyze and extrapolate historical patterns and trends into the future.
- Qualitative forecasting involves a more subjective and judgment-based approach to predicting future financial outcomes. It relies on expert opinions, market intelligence, surveys, and qualitative data rather than solely on historical numerical data. Qualitative forecasting is particularly useful when historical data is limited or there are significant uncertainties, such as changes in market dynamics, regulatory environments, or technological disruptions. It helps incorporate subjective insights and qualitative factors into the forecasting process.
A financial forecasting template often combines quantitative and qualitative approaches to understand future financial performance comprehensively.
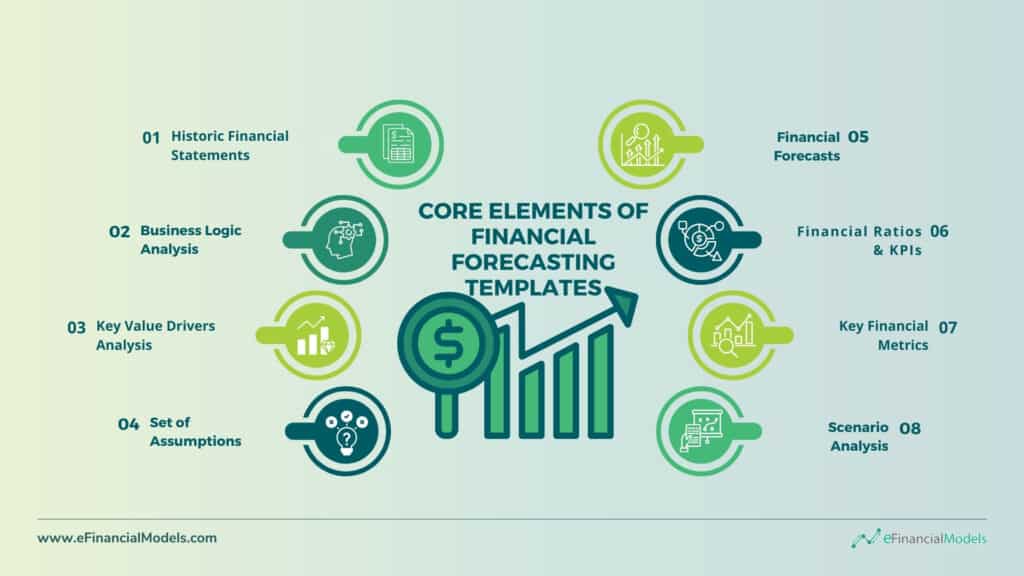
Core Elements of Financial Forecasting Templates
Financial forecasting models transform raw financial data into actionable insights. Some important elements of a financial forecasting template are as follows:
The elements of a financial forecasting model can vary depending on the specific requirements and industry. Here are some common components:
1. Historical Financial Statements
These include past income, balance sheets, and cash flow reports. Analyzing historical data helps establish trends and patterns that can be used for forecasting. Historical financial statements identify the relationships between revenues, costs, investments, etc. Financial analysis based on historical data builds a solid understanding of how a business works in the past and gives first indications of how it works in the future.
2. Business Logic Analysis
Understanding business operations, market dynamics, and industry trends is crucial. This analysis helps identify the key drivers that impact the company’s financial performance. We need to identify how the business logic works and what influences revenues, cost, and cash flows going forward. Business logic analysis answers the following questions:
- Where does the revenue come from?
- What are the reasons why volumes grow?
- What are the determinants of a business’s revenues?
3. Key Value Drivers Analysis
These are the factors that have a significant impact on the company’s financial results. Examples include sales growth, cost of goods sold, pricing strategy, market share, customer retention, etc. It is important as they define how to build a forecast that reflects the business logic. Key Value Drivers analysis provides valuable insights to management and capital providers by highlighting the areas that can create the most value and guide decision-making processes. By understanding the key drivers and their interdependencies, businesses can:
- Allocate resources effectively
- Optimize operations
- Prioritize investments
4. Set of Assumptions
A forecasting model then needs to take the analysis results and propose a set of assumptions to build a forecast. Financial forecasting involves making assumptions about future events and conditions. Assumptions can be related to market growth rates, inflation, interest rates, exchange rates, regulatory changes, and other relevant variables. Assumptions are vital to financial forecast models because they provide the foundation for projecting future financial outcomes.
5. Financial Forecasts
Financial forecasts are created based on historical data, business logic analysis, and key value drivers. These projections typically include income statements, balance sheets, and cash flow statements for a specified period (e.g., one year or five years). Building a forecast is a fundamental component of a financial forecasting model because it provides a roadmap for planning, decision-making, resource allocation, performance evaluation, communication with capital providers, risk management, and strategic planning. It helps businesses navigate the future by estimating financial outcomes and guiding their actions to achieve desired results.
6. Financial Ratios & Key Performance Indicators (KPIs)
They help better understand the forecast. Financial ratio analysis examines financial ratios and key performance indicators derived from a three-statement financial model. Ratios such as liquidity, profitability, and solvency provide insights into the company’s financial condition and performance. These ratios can be used to compare the company’s performance with industry benchmarks or historical trends. These metrics provide insights into the financial health and performance of the company. Examples of financial ratios include:
- Profitability Ratios (e.g., gross profit margin, net profit margin)
- Liquidity Ratios (e.g., current ratio, quick ratio)
- Efficiency Ratios (e.g., inventory turnover, accounts receivable turnover)
7. Key Financial Metrics
These are often considered to assess the financial performance and value of the company. They provide valuable insights into the financial health and performance of a business. Key financial metrics help analysts, investors, and other capital providers evaluate the company’s current and future financial prospects. For example, Net Present Value (NPV) or Internal Rate of Return (IRR) are two of the most popular key financial metrics for investment decisions. Generally, a positive NPV indicates that the project is expected to generate a return higher than the discount rate, while a higher IRR suggests a more attractive investment opportunity.
8. Scenario Analysis
Financial forecasting models should incorporate scenario analysis to assess the impact of different scenarios on the company’s financials. Common scenarios include best-case, worst-case, and upside-case scenarios.
- The best-case scenario represents the most favorable or optimistic outcome. It assumes that everything goes smoothly, all goals are achieved, and any potential obstacles or risks are overcome.
- The worst-case scenario represents the most unfavorable or pessimistic outcome. It considers all the risks, challenges, and obstacles that could arise and considers the most negative impact they could have on the situation.
- The upside-case scenario represents a favorable but less optimistic outcome than the best-case scenario. It considers realistic improvements, positive trends, or unexpected opportunities that could arise and lead to positive outcomes.
It’s important to note that financial forecasting models should be tailored to the business’s specific needs and may include additional elements based on industry, company size, and other relevant factors.























































Forecasting Financial Statements – Insight, Strategy, Growth
Forecasting financial statements play an integral role in developing and analyzing financial projections for your business. They provide a systematic way to assess the impact of key assumptions and inputs on your financial statements and metrics. There are several reasons why financial forecasting should be a key part of your business processes and why financial models are helpful in financial forecasting:
Benchmarking
Financial forecasts provide targets that can be used to evaluate your actual performance. They help you understand whether your business meets key financial objectives and metrics. Forecasting financial statements allow you to benchmark your company’s performance against industry standards and key performance indicators (KPIs). You can evaluate your company’s strengths and weaknesses by comparing your financial metrics like revenue growth, profit margins, and cash flow against industry averages or competitors. It helps determine if you’re meeting key business objectives and where improvement opportunities exist.
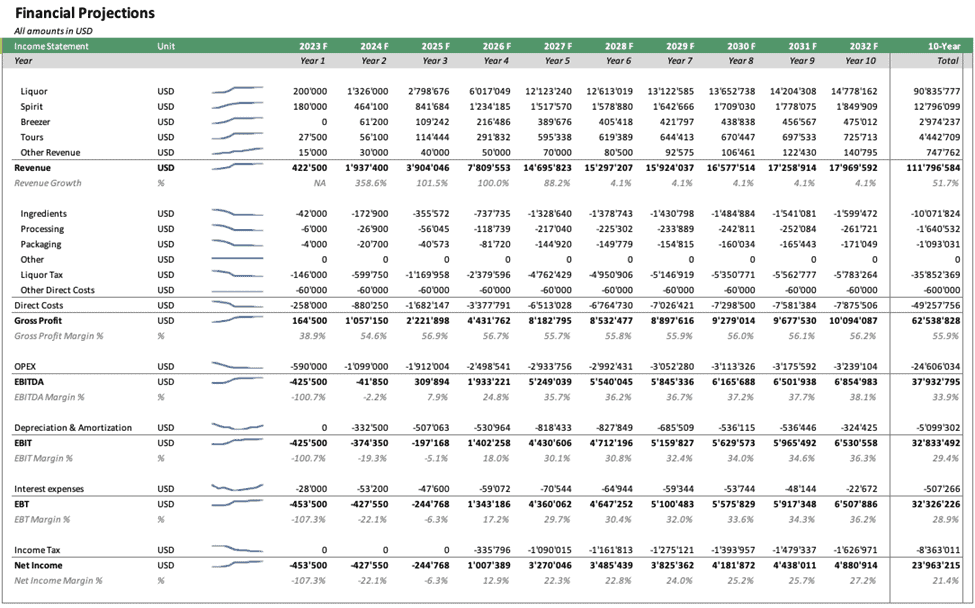
The financial forecasting template above shows a detailed projection of the company’s revenues over ten years, broken down by various product lines. It allows for comparison against industry averages and setting realistic sales targets. Direct costs associated with production are itemized, enabling a granular view of cost control and optimization. Comparing these costs to benchmarks helps identify areas where the company spends more or less than competitors. Furthermore, the Gross Profit Margin and Net Income Margin are critical profitability indicators. These metrics allow businesses to compare their profit margins against industry benchmarks, assessing whether they are operating at, above, or below standard profitability levels.
Budgeting
Financial forecasts form the basis for budgets by estimating future revenues and expenditures. Budgets help ensure that resources are allocated properly, and costs are controlled. Forecasting financial statements play a crucial role in budgeting by providing valuable insights and predictions about future financial performance. They analyze historical data, market trends, and other relevant factors to estimate future revenue streams. By understanding the expected inflow of funds, budgeting becomes more accurate and realistic. Expense projection enables businesses to allocate funds more effectively and make informed decisions.

Forecasting financial statements is a crucial tool for budgeting by providing a comprehensive view of a company’s financial health, projected monthly. The P&L section tracks the company’s revenue and Earnings Before Interest, Taxes, Depreciation, and Amortization (EBITDA) over each month. The EBITDA margin percentage indicates the operating profitability as a percentage of revenue. It allows the business to monitor its monthly financial performance against budgeted figures, adjust operational spending, and manage resources to meet financial targets. The Cash Flow section provides insights into the company’s liquidity, detailing cash from operations, financing, and investments. It helps understand how cash moves in and out of the business.
Cash Flow Management
Accurately projecting your business’s cash flows is critical for effective financial forecasting and management. Cash flow projections estimate the inflows and outflows of cash over a given period of time and help determine potential cash shortfalls or surpluses. They allow businesses to take corrective actions, such as reducing expenses or increasing funding, to avoid cash flow problems. Cash flow forecasting models help project the timing and amount of cash inflows and outflows. This knowledge allows businesses to plan for potential cash shortages or surpluses, ensuring adequate funds are available to cover expenses and investments.

Financial forecasting models provide a detailed breakdown of cash inflows and outflows. It allows management to see how operations, investments, and financing activities contribute to the company’s cash position over a 10-year forecast period. By visualizing cash flows over multiple years, the model helps identify trends, such as periods of cash surplus or shortfall. It can inform decision-making regarding capital expenditures, investment opportunities, or the need for external financing.
External Communication Tool for Capital Providers
External capital providers, such as investors, creditors, and analysts, rely on accurate and reliable financial information to make informed decisions about their organizational engagement. Financial forecasting provides transparency by communicating the organization’s expected financial performance, potential risks, and future prospects. It demonstrates the organization’s commitment to accountability and helps establish trust with external capital providers.
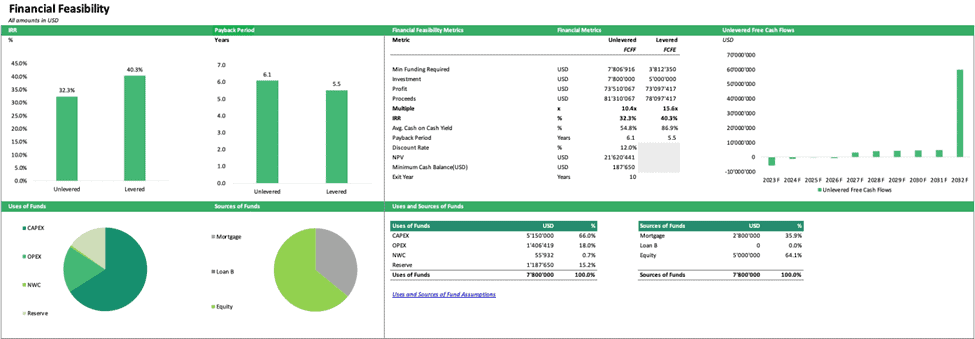
The Executive Summary in a financial forecasting template is essential for engaging with capital providers such as investors, lenders, and shareholders. It provides a financial feasibility dashboard showing detailed metrics, including the Net Present Value (NPV), Internal Rate of Return (IRR), Payback Period, Cash on Cash Yield, and multiple. They can become focal points for discussions on terms of financing, rates of return expected, and negotiation on equity stakes or loan conditions.
Investment Analysis
Forecasting financial statements can analyze historical data, market trends, and relevant financial indicators to predict a company’s or investment’s future performance. They can help investors assess the risks associated with an investment. By incorporating different scenarios and sensitivity analysis, these models can simulate potential outcomes and quantify the level of risk involved. This information enables investors to make risk-adjusted investment decisions and determine the likelihood of achieving desired returns.
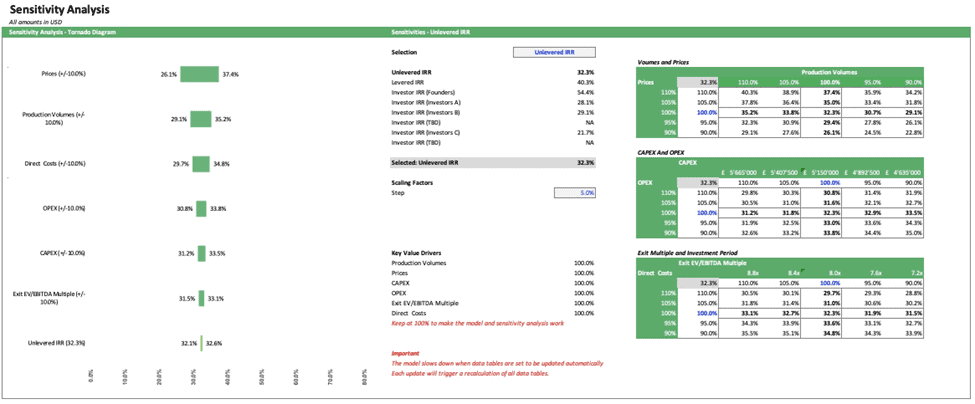
The tornado diagram on the left of the image above shows how sensitive the Unlevered IRR is to changes in various input variables such as prices, production volumes, direct costs, OPEX (Operational Expenditure), CAPEX (Capital Expenditure), and exit EV/EBITDA multiples. Adjusting these inputs helps investors understand which factors have the most significant impact on project returns. Investors use this information to gauge the robustness of their investment under varying conditions, identify the most critical assumptions that affect the investment’s performance, and make informed decisions by considering different risk-return profiles.
Performance Evaluation
A well-developed financial forecast helps set the organization’s realistic and achievable financial goals. By projecting future revenues, expenses, and profits, it provides a clear target for performance evaluation. It allows businesses to align their efforts and resources toward specific financial objectives. The forecasts generated by a financial forecasting template allow you to set concrete targets around your key metrics and monitor progress toward those goals.
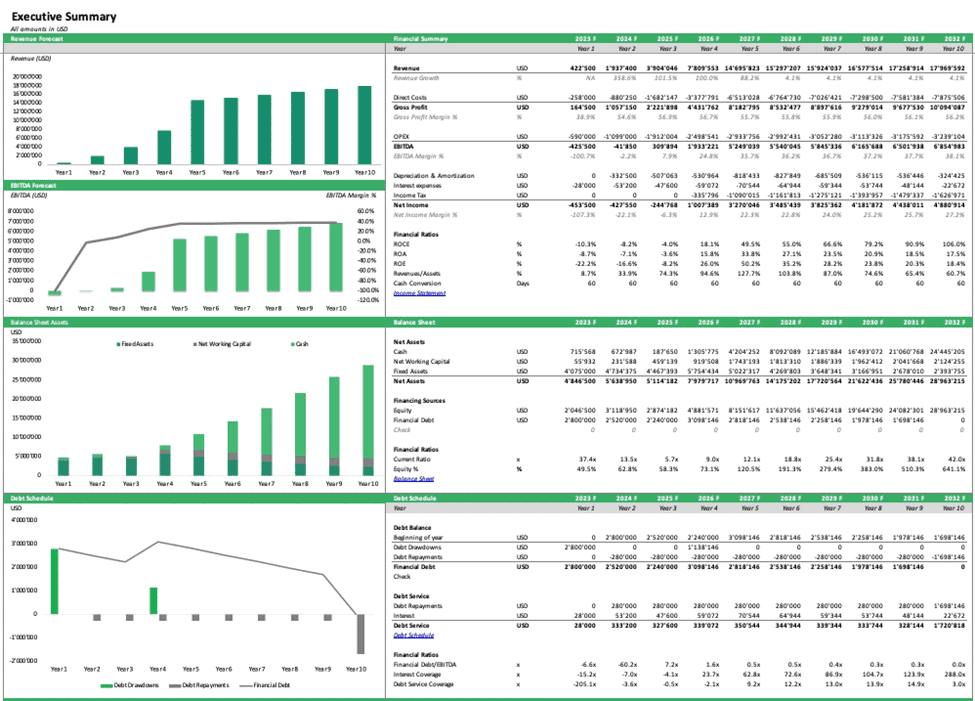
The above financial forecasting model provides a detailed breakdown of an organization’s financial projections over ten years. It can help with performance evaluation in several ways:
- Ratios such as ROCE (Return on Capital Employed), ROE (Return on Equity), and Current Ratio provide insights into how effectively the company is using its capital and assets to generate profits. These are important for evaluating management’s performance.
- The bar charts for Revenue and EBITDA visually represent expected growth or decline over the years. It can evaluate how well the company will likely perform against its sales targets and operating profitability metrics.
- The table includes vital financial metrics such as Revenue Growth, Gross Profit Margin, EBITDA Margin, and Net Income Margin. These metrics are crucial for evaluating the efficiency and profitability of the company over time.
Risk Management
Financial forecasts consider various scenarios, including optimistic and pessimistic ones. It helps identify key risks and uncertainties that could impact your business so you can develop appropriate risk mitigation strategies. Financial forecasting models also help with risk analysis by allowing you to create best-case and worst-case scenarios. The best-case scenario indicates the optimal outcome if business conditions are favorable. The worst-case scenario helps determine if your company has enough cash or access to financing to sustain operations if you experience below-average results or an economic downturn. By simulating different scenarios, you can evaluate risks to your business and incorporate appropriate risk management strategies into your plans.
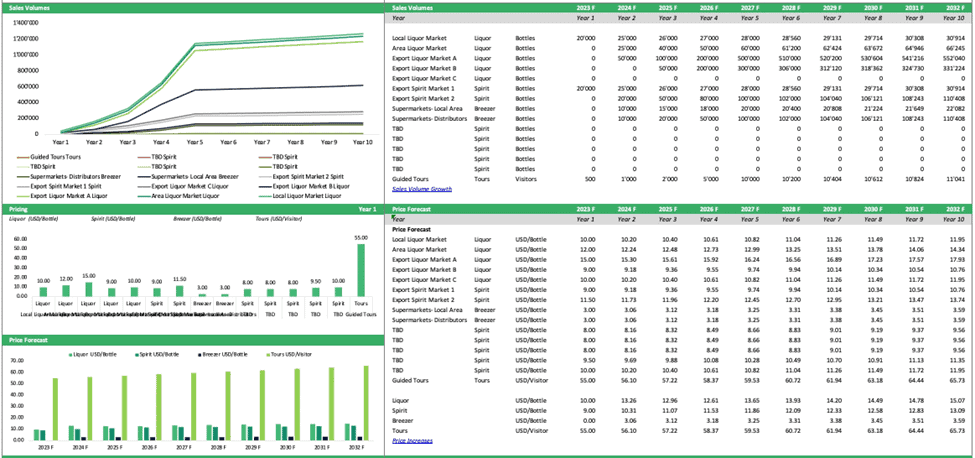
For instance, the chart above shows sales volumes over ten years for different products and services. By analyzing the expected volumes, a company can assess demand variability and potential revenue fluctuations, which are key factors in risk assessment. Diversification is a common risk management strategy as it reduces dependency on a single market or product line. The model covers various markets (local and export) and products, which helps understand the business’s diversification. The pricing chart for different products provides insight into the expected average price over time. It can help understand the impact of inflation, cost changes, and pricing power on the company’s revenues and margins.
Strategic Decision-Making
As a business owner, you are tasked with making important strategic decisions to ensure the success and longevity of your company. However, these decisions must be made with sufficient data to support them. Comprehensive forecasting financial statements provide the quantitative insights you need to make strategic choices confidently.
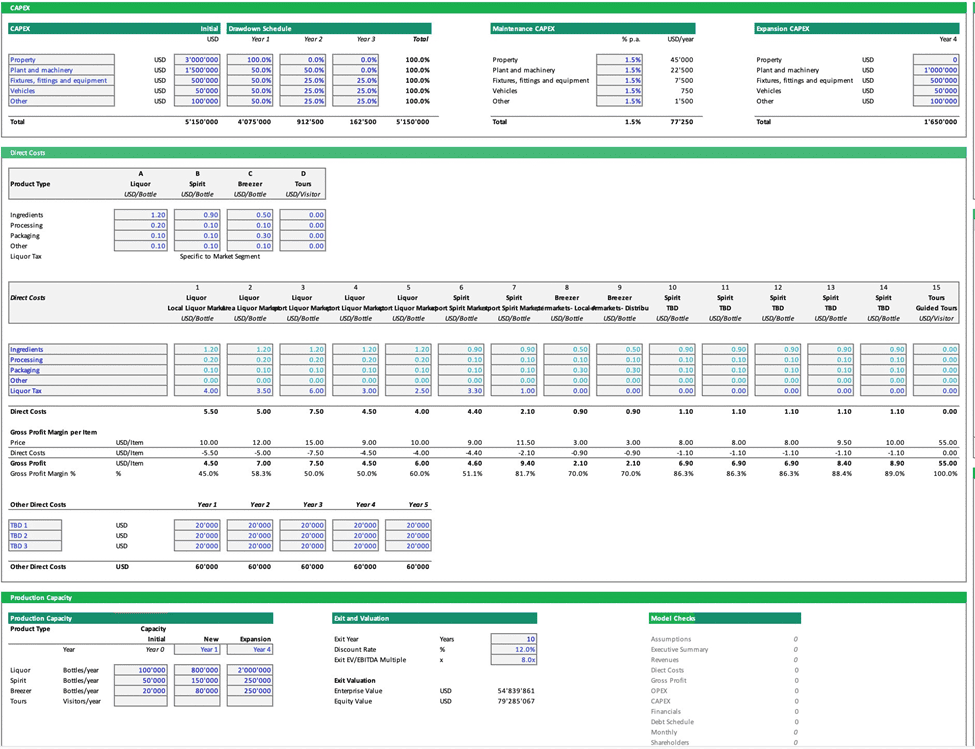
A financial forecasting model is a complex and detailed tool that can significantly aid a business in strategic decision-making.
- The CAPEX calculates the initial and ongoing investment required for physical assets such as property, plant, and machinery. It also includes maintenance and expansion costs. Decision-makers can use this information to plan for capital allocation, assess the timing of investments, and evaluate the impact of these investments on the company’s cash flow and growth potential.
- Direct Costs break down the variable costs associated with producing different product types. Understanding these costs is crucial for pricing strategies, determining break-even points, and identifying cost-saving opportunities.
- Gross Profit Margin indicates the profitability of each product type by subtracting direct costs from the price. High-level decisions on product mix, discontinuation of unprofitable items, and focus on high-margin products are informed by this data.
- Understanding the current and projected capacity can inform decisions on whether to scale up operations or invest in efficiency improvements. It can also help determine if there is a need for capital investment in new facilities or equipment.
Valuation
Financial forecasts are required to determine a fair valuation for your business. They estimate future financial performance, a key input in most business valuation models and methods. Financial forecasting models are invaluable tools for determining a company’s current and future value. The discounted cash flow (DCF) analysis, a common method for valuing companies, relies on multi-year forecasting financial statements to estimate future cash flows, which are then discounted at the weighted average cost of capital. The total of the discounted cash flows represents the company’s intrinsic value.
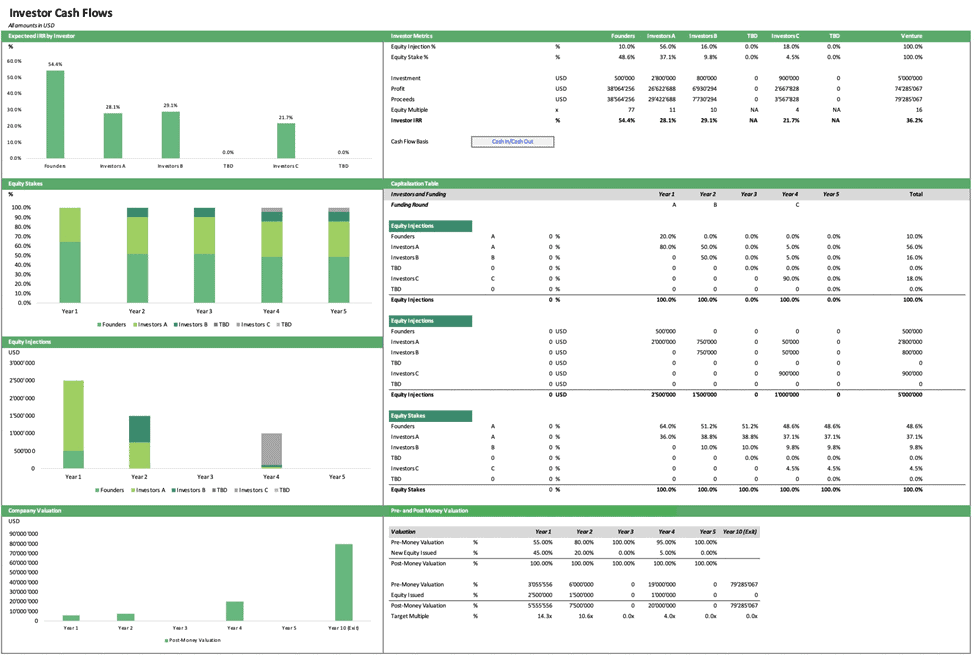
The Investor Cash Flows section in a financial forecasting template calculates the Internal Rate of Return (IRR) for each investor, which measures the investment’s profitability. A higher IRR represents a more attractive investment. It helps in estimating the expected return on investment for each party involved. The section also lists essential figures like the amount invested, the profits, proceeds, equity multiple, and IRR. These metrics are critical for investors to assess the financial health and potential of the company.
In summary, financial forecasting models provide insightful projections into companies’ future financial state and assets. Using historical data and forward-looking assumptions, these models estimate revenues, expenses, cash flows, and valuations over multi-year periods to facilitate data-driven decisions that maximize value and mitigate risks. Financial forecasting should be an integral part of managing any business































Limitations of a Financial Forecasting Template
While useful tools for estimating future financial performance, financial forecasting models are subject to several limitations.
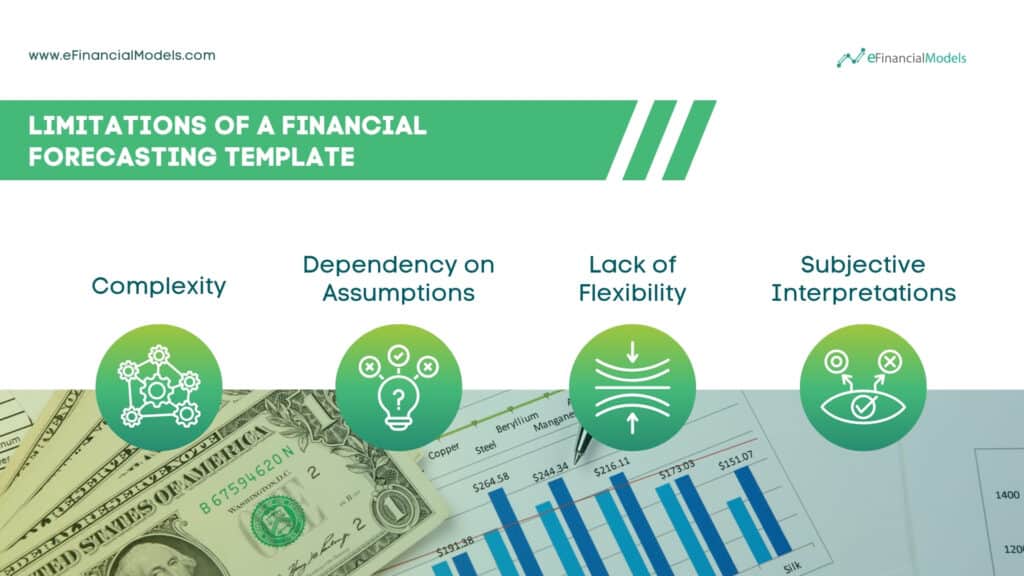
- Complexity: Developing and maintaining financial forecasting models can be complex and time-consuming. It requires expertise in financial analysis, data management, and statistical modeling. Additionally, significant computing resources may be needed to process large volumes of data.
- Dependency on Assumptions: Forecasting models are only as good as the data they receive. The model’s predictions may be flawed if the available data is complete, updated, or accurate. Only accurate or complete financial statements, reliable market data, or insufficient industry information can limit the accuracy of forecasts. Financial forecasting models often make assumptions to simplify complex financial scenarios. These assumptions may not always hold true in the real world. For instance, assumptions about customer behavior, market trends, or cost structures may not accurately reflect actual conditions. Any deviations from these assumptions can lead to inaccurate forecasts.
- Lack of Flexibility: Forecasting models typically rely on historical data patterns and may need help to adapt to rapid changes or new market conditions. The models may need to be adjusted or recalibrated if there are significant shifts in the business environment.
- Subjective Interpretations: Financial forecasting models are designed and operated by humans, who may introduce biases consciously or unconsciously. Assumptions, personal judgments, or preferences can influence the inputs, algorithms, or interpretations used in the model. Biases can result in unrealistic forecasts, skewed projections, or over-optimistic/pessimistic estimates.
It is crucial to acknowledge these limitations when using financial forecasting models and supplement them with qualitative analysis, expert judgment, and continuous monitoring of real-time information to improve the accuracy and reliability of financial forecasts.








Financial Forecasting Models: Forecast, Command, Thrive
Ultimately, business financial forecasting models provide an essential strategic business growth and success roadmap. By analyzing historical data and developing forward-looking projections, you gain valuable insights into potential risks, expenses, and cash flows — allowing you to make data-driven decisions. Robust financial forecasting helps ensure your company is poised to achieve short-term and long-term goals. The time you invest in building useful financial models will pay dividends through improved benchmarking, budgeting, risk mitigation, and valuation. Don’t leave your business’s future to chance.
eFinancialModels.com offers invaluable tools for businesses seeking to forecast, command, and thrive in their respective markets. Our financial forecasting models are tailored to accommodate entrepreneurs’, startup founders’, and finance professionals’ unique needs. They enable users to perform detailed financial analysis, incorporating a range of variables such as market trends, operational costs, and revenue projections. By utilizing these models, businesses can forecast future financial performance with greater accuracy and identify critical areas for growth and investment.
You might also like:
- 10 Tips to Develop a First Class Business Valuation Report
- Financial Planning for Small Business Owners – Taking an SBA Loan
- 5 Practical Tips to Help Raise Funds For Startups
- Achieve Financial Success By Knowing Your Business Plan Model
- Financial Modeling for Startups and Small Businesses
- How to Build a Capitalization Table
- Strategic Insights to Secure Series B Financing
- Financial Statements – Definition, Uses, Contents and Templates
- Understanding the Levelized Cost of Energy Formula
- 12 Funding Sources for Businesses and Startups
- Top 5 Tips For a Good Financial Due Diligence
- Calculating Revenue Growth Rate: A Key Metric for Business Success
- Commercial Real Estate Valuation Methods: Helping Investors in Taking Informed Decisions
- Financial Modeling for a Gold Mining Investment
- How to Secure Seed Financing?
- Business Valuation Service
- Cash Flow Analysis in Excel
- Monthly Recurring Revenue for SaaS Business
- How to Write a Business Plan Step-by-Step
- Why Financial Forecasting Models Are Vital for Your Business