
0 ITEMS

Value Your Business With the EV/Revenue Multiple
Table of Content
- Understanding the EV to Revenue Multiple
- What Does the EV-to-Sales Multiple Reveal?
- Why Calculate the Enterprise Value to Revenue Multiple?
- Limitation of the EV/Revenue Multiple
- How Do You Calculate the EV to Revenue Multiple?
- Financial Modeling for Accurate Enterprise Value to Revenue Multiple Calculation

Understanding a company’s valuation often starts with the Enterprise Value to Revenue multiple, a key metric in financial analysis.
- The EV/Revenue multiple compares enterprise value to total sales, highlighting how much investors are willing to pay per revenue dollar.
- It’s especially useful for valuing early-stage or high-growth companies that may not yet be profitable.
- Calculating EV involves market cap, total debt, and subtracting cash, providing a comprehensive picture of a company’s total value.
- High multiples often indicate expectations of strong growth, while lower multiples may suggest market skepticism or undervaluation.
- Using this multiple alongside industry benchmarks helps investors assess valuation consistency and growth potential.
Continue to refine your valuation skills with clear insights into how EV/Revenue multiples influence investment decisions.
Understanding the EV to Revenue Multiple
The EV to Revenue Multiple is also called the EV-to-Sales Multiple. It’s a valuation metric that compares a company’s enterprise value (EV) to its total revenue. It helps investors gauge how much they pay for each revenue dollar. This multiple is particularly useful when comparing companies that may not yet be profitable. It focuses on top-line performance rather than earnings, which may be less stable in the early stages of growth.
The EV to Revenue Multiple is mainly used to value companies, not individual assets. It measures overall financial health and revenue generation. Enterprise Value (EV) reflects the full value of a company, covering equity, debt, and cash. By comparing EVs to sales, the multiple shows how well a company turns revenue into value. This makes it a helpful benchmark for comparing similar companies. In contrast, individual assets are valued based on cash flows, costs, and depreciation, making the EV to Revenue Multiple less useful for them. For public companies, calculating Enterprise Value (EV) is easy since it comes from the market capitalization based on the stock price. Revenue data is also accessible from public financial statements. The process is more complex among private company valuations. Without a market capitalization, EVs must be estimated using comparable transactions or industry multiples. Sales figures may need to come from internal sources, making data availability and reliability challenging.
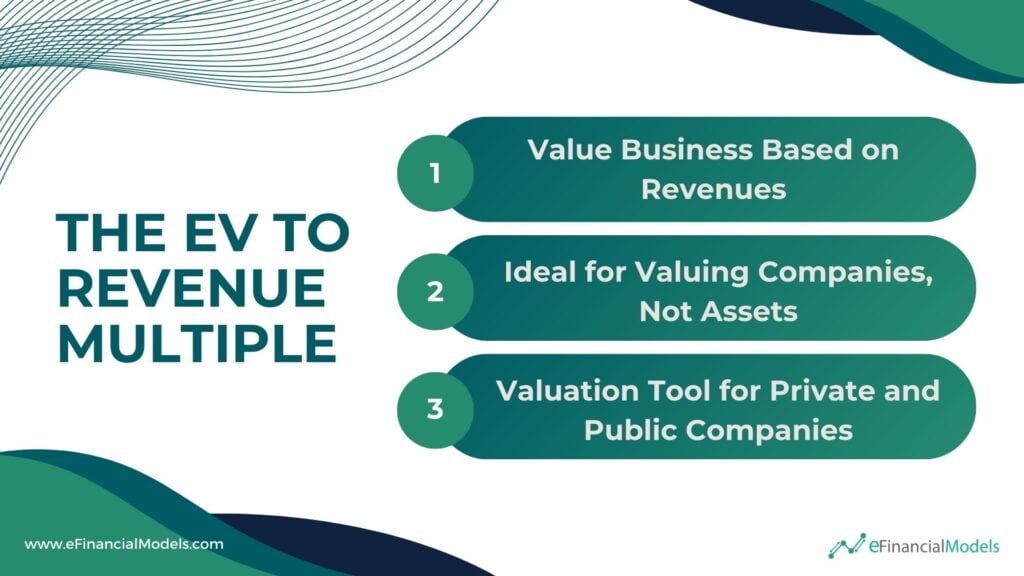
The EV to Revenue Multiple is particularly useful for evaluating companies in sectors like Software as a Service (SaaS), where earnings may be minimal or negative due to significant growth investments.
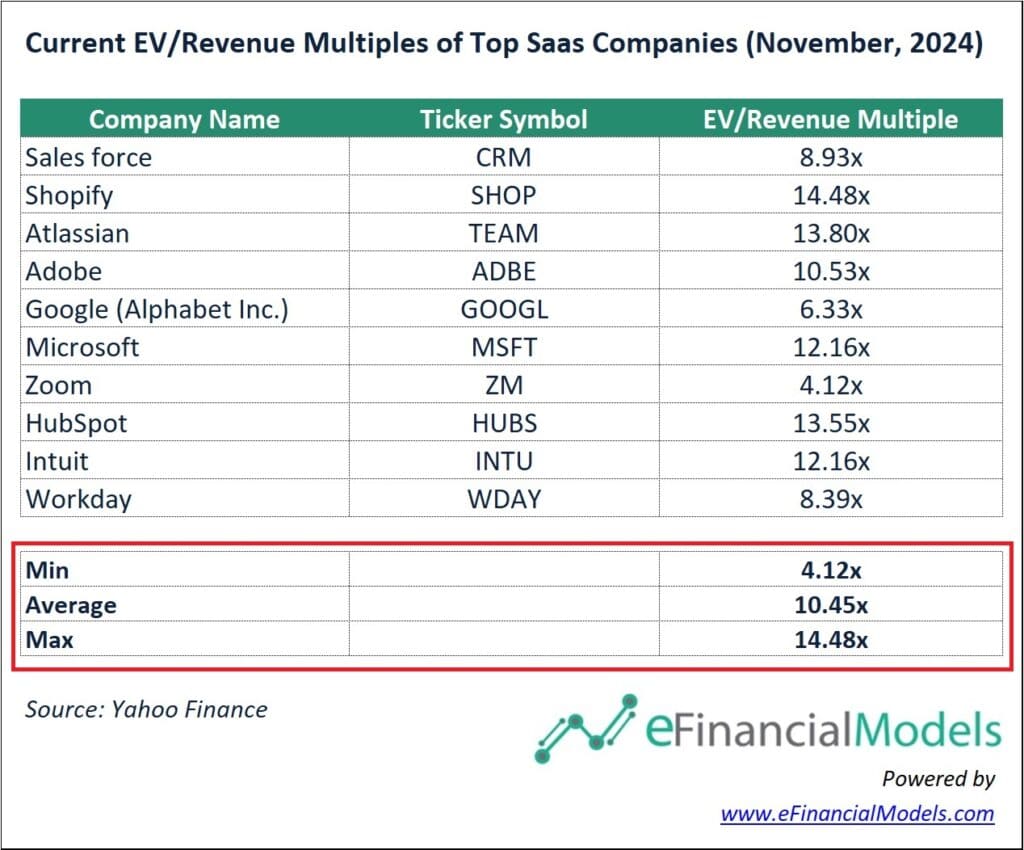
Note: The EV/Sales multiples are approximate and based on recent financial data as of November 2024. These figures can fluctuate due to market conditions and company performance.
The table above presents current EV/Revenue multiples for leading SaaS companies in 2024, showing how much investors are willing to pay for every dollar of revenue. Shopify has the highest multiple at 14.48x, indicating a strong growth expectation. Zoom has the lowest at 4.12x, suggesting lower perceived growth or profitability potential. The average multiple across these companies is 10.45x, reflecting healthy valuations typical of SaaS businesses. These figures highlight the varied investor sentiment towards each company’s growth prospects and business model efficiency in the competitive SaaS industry.
What Does the EV-to-Sales Multiple Reveal?
The EV-to-Sales Multiple shows how much investors pay for each dollar of a company’s revenue. It factors in both equity and debt by using the total enterprise value, which includes market cap, debt, and cash. Unlike price-based ratios, it offers a fuller view of a company’s value. This metric is particularly useful for comparing companies in sectors with different capital structures, as it captures the impact of both equity and debt financing.
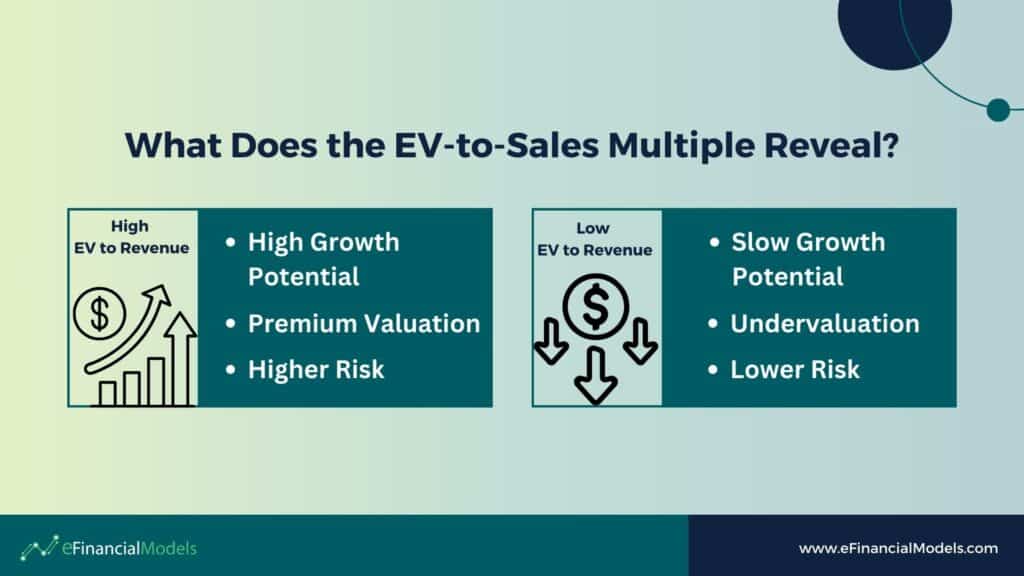
A high EV-to-Sales Multiple typically suggests strong growth. It shows that investors believe the company is in a rapidly growing market with high scalability and market share opportunities. A high EV-to-Sales ratio may also mean the company has unique strengths, justifying a premium valuation. These can be a strong brand, innovative technology, or a loyal customer base. However, it also signals higher risk, as the valuation relies on future performance that might not meet expectations.
A low EV-to-Sales Multiple can mean slow growth potential. It may show that the market is pessimistic about future growth. They are likely due to declining sales, tough competition, or lack of product differentiation. It could also reflect broader industry challenges or specific operational issues. However, a low multiple might also signal undervaluation, offering a potential opportunity for investors who believe the market lacks key strengths. Investors can benefit from a hidden asset, a strategic plan that could drive growth or turnaround potential. It also suggests the company is valued cheaply relative to revenue, indicating lower risk since the market has set conservative expectations.
Why Calculate the Enterprise Value to Revenue Multiple?
Investors, analysts, and business owners often use the Enterprise Value to Revenue Multiple to determine how a company is valued relative to its revenues. It is a critical tool in the financial analyst’s toolkit, offering unique insights that other valuation metrics may not provide.
- Comprehensive Valuation: The multiple offers a more comprehensive company valuation than just looking at its earnings or book value. It assesses a company’s operational efficiency and market valuation simultaneously. By considering both equity and debt in the valuation process, it reflects the total financial obligations of the company, offering a holistic picture of its market worth. It helps stakeholders better understand how effectively a company utilizes its revenue to create value for shareholders and debt holders.
- Growth Potential Assessment: The Enterprise Value to Revenue Multiple helps assess a company’s growth potential. A high multiple suggests that investors expect strong growth and are willing to pay more per dollar of revenue. A low multiple might mean the company is undervalued or has low growth prospects. Understanding this metric allows investors to make informed decisions based on future potential, not just past earnings.
- Industry Comparisons: Calculating the Enterprise Value to Revenue Multiple helps compare companies across industries. Industries differ in profit margins, risk, and growth rates. For instance, tech companies often have higher multiples due to fast growth, while utilities have lower ones due to steady but slow growth. Comparing a company’s multiple to its peers shows if it’s valued consistently within its sector. This comparison helps investors spot investment opportunities and understand how a company measures up against competitors.
- Valuation Benchmarking: The multiple helps investors benchmark valuation. It shows if a company offers good value compared to others. By tracking this metric over time, investors can see if a company trades at a premium or discount, guiding them on when to buy or sell shares.
- Valuing Early-Stage Startups: The Enterprise Value to Revenue Multiple is useful for valuing early-stage startups that aren’t yet profitable. Traditional metrics like the Price to Earnings (P/E) Ratio don’t work for startups with negative earnings. However, startups often have strong revenue growth, making this multiple more effective for assessing their value. It focuses on revenue, helping investors gauge the potential of startups in their early stages.




















































Limitation of the EV/Revenue Multiple
While the EV/Revenue multiple is a useful valuation tool, it comes with certain limitations that investors should consider. Understanding these drawbacks can provide a more balanced view of a company’s value beyond its revenue figures.
- Lack of Profitability Insight: It focuses only on total sales, ignoring profitability and costs. A company with high sales but low margins may have the same EV/Revenue ratio as a more profitable company with better cost control. This can be misleading, especially when comparing companies with different cost structures or efficiency levels. Investors should also consider other metrics to determine how well a company turns sales into profit..
- Industry Differences: The EV/Revenue multiple can be misleading when comparing companies from different industries. Each sector has unique traits affecting sales growth and valuation. For example, tech companies often grow sales quickly but need ongoing investment, leading to higher valuations than stable industries like utilities. Industries with high capital needs or unique cost structures also have different “normal” EV/Revenue multiples. Ignoring these differences can result in inaccurate conclusions about a company’s value or potential..
- Ignores Debt and Cash: Enterprise value considers a company’s debt and cash, but the EV/Revenue multiple does not show how well a company manages them. It does not reveal the effects of heavy debt interest obligations on profitability. Similarly, large cash reserves suggest financial stability, but the ratio ignores this liquidity. As a result, this multiple alone gives an incomplete view of financial health, making it essential to use other metrics to assess debt and cash management.

How Do You Calculate the EV to Revenue Multiple?
Calculating the EV to Revenue multiple helps assess how the market values a company’s sales. This metric is ideal for comparing companies within the same industry, especially when profitability isn’t the main concern, like with growth or early-stage firms. Here’s a step-by-step guide to calculate it:
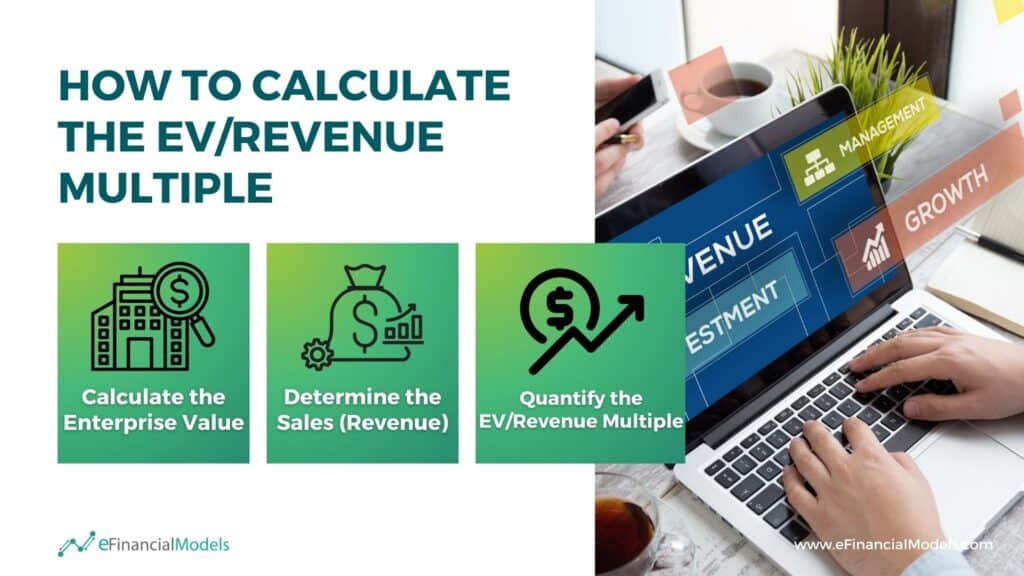
Step 1: Calculate the Enterprise Value
Before calculating, understand its components: Enterprise Value (EV) and Revenue. EV represents the total value of a company, including equity and debt minus cash. It reflects the theoretical price to acquire the business. The formula for EV is:

Where:
- Market Capitalization = the total market value of a company’s outstanding equity shares. It’s calculated by multiplying the share price by the number of outstanding shares. Market capitalization reflects the equity value as perceived by shareholders and market conditions.
- Total Debt = the sum of both short-term and long-term debt. Adding debt gives a more comprehensive view of the company’s obligations because, in a theoretical acquisition, the buyer would also assume the company’s debt. Total debt represents the obligations that any potential acquirer would need to satisfy.
- Cash and Cash Equivalents = the sum of highly liquid assets that can be quickly converted into cash. Subtracting cash from the formula adjusts for the liquid assets already on hand, which could be used to pay down debt post-acquisition. In essence, this reduces the overall cost of acquiring the business.
Step 2: Determine the Revenue
Identify the company’s revenue from its income statement. Revenue, also called sales, is the total income generated over a specific period, usually annually or quarterly.
Step 3: Quantify the EV/Revenue Multiple
Calculate the multiple using the EV/Revenue formula: Enterprise Value / Revenue. After calculating EV and finding the total revenue, use this formula to see how much value investors assign to each dollar of revenue. The EV to Revenue multiple has no units and shows how often the enterprise value compares to revenue, such as “2x” or “3.5x.” For instance, if the multiple is “3x,” the company’s value is three times its revenue, indicating what investors are willing to pay for each dollar.
Sample Quantify the EV/Revenue Multiple Calculation
Suppose a technology company has the following metrics:
- Market Capitalization = $200,000
- Total Debt = $50,000
- Cash and Cash Equivalents = $20,000
- Annual Revenue (Sales) = $100,000
First, let us find the Enterprise Value:

Now, we can calculate the EV/Revenue Multiple:

It shows that the company is valued at 2.3 times its annual revenue, which is typical in tech valuation due to growth potential.
Here’s another example:

The Discounted Cash Flow (DCF) Valuation Model summarizes projected free cash flows, terminal value calculations, and enterprise value. It uses a two-stage value driver model with a 9.9% discount rate (WACC) to estimate the present value of future cash flows and terminal value. Terminal value is calculated using Gordon Growth and Exit Multiples (e.g., EV/Revenue Multiple).
Financial Modeling for Accurate Enterprise Value to Revenue Multiple Calculation
Investors and analysts can gain a competitive edge by incorporating the Enterprise Value to Revenue Multiple into their valuation toolbox, ensuring a more comprehensive analysis of potential investments. While such a metric is not without its limitations—as with any single metric—it should be used in conjunction with other financial indicators to paint a fuller picture. Understanding industry benchmarks and the factors influencing EV/Sales can significantly enhance investment decision-making. Incorporating the EV-to-Sales Multiple into your financial analysis can lead to more informed capital allocation decisions, benefiting entrepreneurs, investors, and businesses.
Financial modeling is crucial for accurately calculating the EV-to-Sales Multiple, enabling businesses to gain clear insights into their valuation relative to sales performance. By incorporating financial models, you can forecast revenue trends, understand operational efficiency, and position your business more effectively for investment opportunities. The precision offered by robust financial modeling ultimately helps ensure that your valuation metrics truly reflect your enterprise’s potential. Ready to elevate your financial analysis? Explore our specialized financial modeling templates today to start calculating accurate valuation multiples.








































You might also like:
- How to Value a Business Using a Discounted Cash Flow Model
- How Are Valuation Multiples Determined
- 10 Tips to Develop a First Class Business Valuation Report
- Finding a Valuation Model for Your Business
- Business Valuation
- 12 BUSINESS VALUATION METHODS
- Financial Modeling for Startups and Small Businesses
- Financial Ratios Analysis and Its Importance
- Investing
- Venture Capital vs. Private Equity: Which is Right for You
- Financial Planning for Small Business Owners – Taking an SBA Loan
- Top 5 Tips For a Good Financial Due Diligence
- How to Write a Business Plan Step-by-Step
- Calculating Revenue Growth Rate: A Key Metric for Business Success
- Financial Planning for Gym Startups
- 12 Funding Sources for Businesses and Startups
- How to Secure Seed Financing?
- Free Online Budget Planner Excel Template for Goods Company
- Creating a Budget Plan – Using the Best Excel Budget Template
- Agriculture
Tags: valuation