
0 ITEMS

Balancing Balance Sheet and Income Statement: A Comprehensive Guide

Financial statements like the balance sheet and income statement are essential for understanding a company’s financial health and performance.
- The balance sheet provides a snapshot of assets, liabilities, and shareholders’ equity at a specific point in time.
- The income statement summarizes revenues, expenses, and net profit or loss over a period, showing profitability.
- Balancing these statements is key to accurate financial analysis and assessing long-term sustainability.
- Using financial models with these reports helps forecast future performance, evaluate strategic options, and communicate with stakeholders effectively.
- Integrating both statements in financial planning improves decision-making for growth and risk management.
Continuing helps you master how to use these tools for better financial insight and planning.
Financial Insights from a Three-Statement Financial Model
Do you need to make informed financial decisions? Do you want to communicate your company’s financial performance effectively? Or do you need to assess the impact of various business scenarios? You will need a three-statement financial model. It’s a dynamic tool that can be adapted to address a wide range of financial and strategic challenges.
A three-statement financial model provides a comprehensive view of a company’s revenues, expenses, assets, liabilities, and cash flows. It consists of three main financial statements:
- Income Statement (Profit and Loss Statement)
- Balance Sheet
- Cash Flow Statement
By creating and analyzing a three-statement financial model, businesses and analysts can gain insights into a company’s financial health, liquidity, profitability, and solvency. It’s an essential tool for budgeting, forecasting, and making strategic decisions, such as raising capital, investing in projects, or evaluating potential mergers and acquisitions.





















































Balance Sheet: A Financial Position Snapshot
A balance sheet is one of the three main financial statements businesses typically use. It provides a snapshot of a company’s financial position at a specific point in time. It is often referred to as a “financial position snapshot” because it presents a clear and concise overview of:
- What a company owns (its assets)
- What a company owes (its liabilities)
- The residual value that belongs to its owners (shareholders’ equity)
The finance team commonly updates the balance sheet at the end of an accounting period, such as a fiscal quarter or year.
Here’s a breakdown of the assets and liabilities list of a balance sheet:
Assets
Assets represent everything a company owns and can use to generate future economic benefits. You can find the assets on the left side of a balance sheet. They have two main types:
- Current Assets: These assets can be converted into cash or used up within one year or one operating cycle, whichever is longer. Common current assets include cash, accounts receivable, inventory, and short-term investments.
- Long-Term Assets: Non-current assets are not expected to be converted into cash or used up within one year. Non-current assets include property, plant, equipment, long-term investments, and intangible assets like patents and trademarks.
Liabilities
Liabilities are the company’s debts or financial obligations to external parties. They are found on the right side of the balance sheet together with the shareholders’ equity. Like assets, they have two main types:
- Current Liabilities: These obligations must be settled within one year or one operating cycle, whichever is longer. Common current liabilities include accounts payable, short-term loans, and accrued expenses.
- Long-Term Liabilities: These obligations are not expected to be settled within one year. Pension commitments, deferred tax payments, and long-term debt are a few examples.
Shareholders’ Equity
Shareholders’ equity represents the residual interest in the company’s assets after deducting its liabilities. Equity remains for the shareholders after all assets are sold and all liabilities are paid off. Shareholders’ equity includes:
- Common stock
- Retained earnings are cumulative gains or losses over a period of time
- Additional paid-in capital from stock issuances
The Balance Sheet Equation
The balance sheet follows a fundamental accounting equation known as the accounting equation or the balance sheet equation. Mathematically, it can be expressed as:
Assets = Liabilities + Shareholders’ Equity
This equation must always hold true, ensuring a balance sheet is balanced. In other words, a company’s assets must equal its liabilities and shareholders’ equity. This equation reflects the fundamental principle that a company’s assets are funded by either borrowing (liabilities) or investments from shareholders (equity).
In summary, a balance sheet equation provides a concise snapshot of a company’s financial health by detailing its assets, liabilities, and shareholders’ equity at a specific point in time. This financial statement is valuable for investors, creditors, and management to assess the company’s financial stability, liquidity, and overall financial position.

Income Statement: Periodical Performance Summary
Another term for the income statement is the profit and loss statement (P&L). It is one of the three main financial statements businesses use. It summarizes a company’s financial performance over a specific period, typically monthly, quarterly, or yearly. An income statement is a fundamental tool for assessing how well a business has generated revenue and controlled expenses and, ultimately, whether it has made a profit or incurred a loss during that period.
Here’s a breakdown of the items included in an income statement:
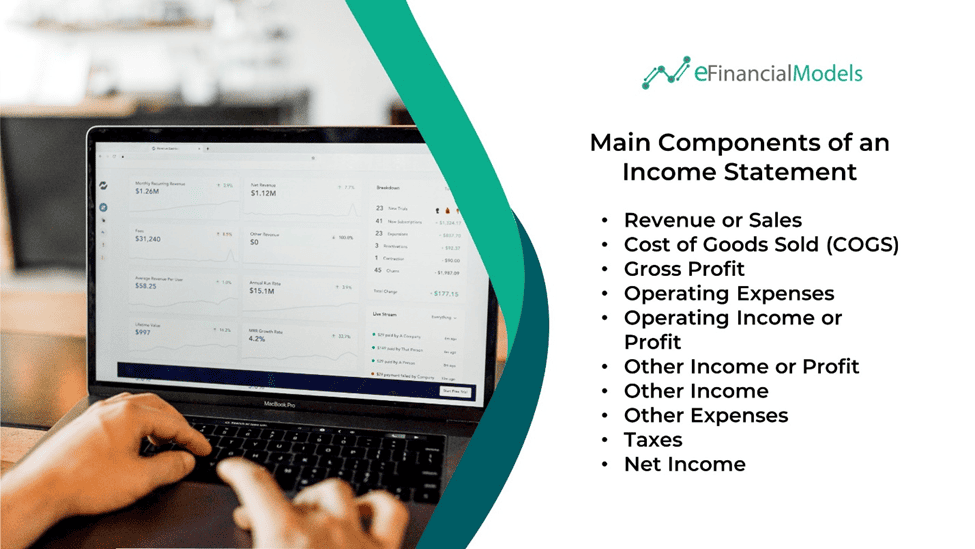
- Revenue or Sales: The total income generated from selling goods or services.
- Cost of Goods Sold (COGS): The direct costs of producing the goods or services sold.
- Gross Profit: Calculated as revenue minus COGS, it shows the profit before considering operating expenses.
- Operating Expenses: These include costs such as salaries, rent, utilities, marketing, and other day-to-day expenses incurred while running the business.
- Operating Income or Profit: This results after subtracting operating expenses from the gross profit.
- Other Income: Any additional income that is not generated from the core business operations, such as interest earned or gains from investments.
- Other Expenses: These are non-operating expenses, such as losses from investments or one-time charges.
- Taxes: The income tax expense incurred by the company.
- Net Income (Net Profit or Loss): The final figure, net income, remains after accounting for all expenses, including taxes. It represents the company’s profit or loss for the specified period.
The Income Statement Equation
The income statement equation represents the fundamental accounting formula used to calculate a company’s net income. Mathematically, it can be expressed as:
Net Income = Revenue – COGS – Operating Expenses + Other Income – Other Expenses – Taxes
By calculating the income statement equation, a company can determine its net income, which is the profit (or loss) generated during the period after accounting for all revenues, costs, and expenses. It provides a snapshot of a company’s financial performance and is a crucial metric for assessing its profitability.






































Balance Sheet vs. Income Statement
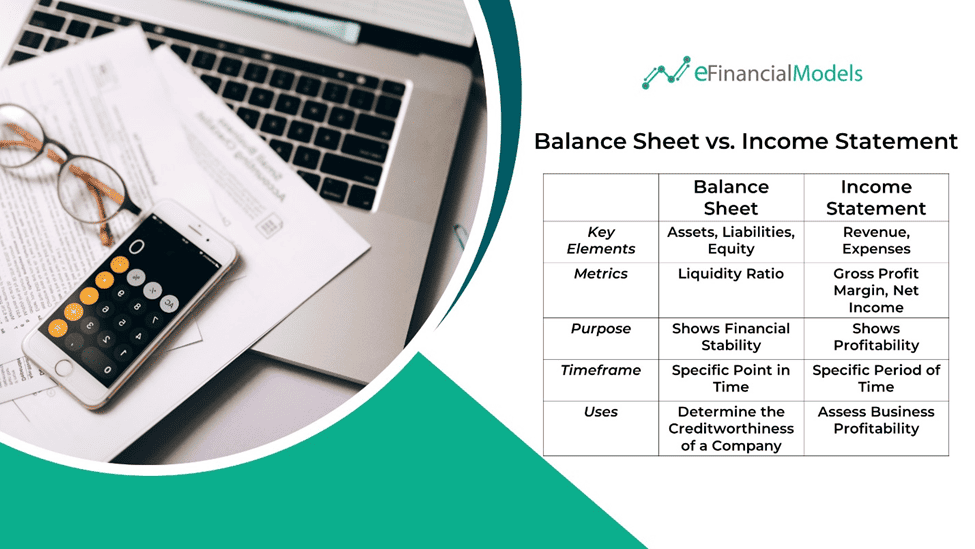
The balance sheet and income statement are two fundamental financial statements that provide different insights into a company’s financial health and performance. Here are five key differences between these balance sheet vs. income statement:
Key Elements
The balance sheet provides a snapshot of a company’s financial position and consists of three main elements: assets, liabilities, and equity. On the other hand, the income statement reports a company’s financial performance and has two primary components: revenue and expenses.
Metrics
The primary financial metric of the balance sheet is the liquidity ratio, which helps assess a company’s ability to meet its short-term obligations using its current assets. The critical metrics associated with the income statement include the gross profit margin and net income.
Purpose
The primary purpose of the balance sheet is to provide insight into a company’s financial stability and overall financial position at a specific time. It helps stakeholders understand the company’s assets, liabilities, and equity. The income statement shows the company’s profitability over a particular period, indicating whether it is making a profit or incurring losses from its operations.
Timeframe
The balance sheet represents a specific point in time, such as the end of a quarter or fiscal year. It does not provide information on the company’s performance or changes over time. The income statement covers a specific period of time, such as a month, quarter, or year. It reflects the company’s performance and financial results during that period.
Uses
Business owners, creditors, and investors use the balance sheet to assess a company’s financial health and creditworthiness. It helps them understand the company’s assets, debts, and equity, which can inform investment and lending decisions. The income statement primarily assesses a company’s performance and profitability. Investors, analysts, and managers analyze it to evaluate the effectiveness of the company’s operations and its ability to generate profits.
In summary, the balance sheet vs. income statement serves different purposes in financial reporting. While the balance sheet focuses on the financial position at a specific time, the income statement highlights a company’s performance over a defined period, each providing valuable insights for different purposes of financial analysis.
Why Should You Use Financial Models for Balance Sheets and Income Statements?
Using financial models for balance sheets vs. income statements can benefit individuals and businesses. These templates provide a structured format for planning and forecasting financial performance. You can create a roadmap for your financial future by inputting relevant data and assumptions.
A balance sheet and income statement Excel template can enhance financial planning, decision-making, and communication. They are valuable tools for individuals and businesses to manage their finances effectively and make informed financial choices. Suppose you’re presenting your financials to stakeholders or seeking funding from investors or lenders. In that case, a balance sheet and income statement Excel template can make your financial information more accessible and understandable to others.
Furthermore, a monthly budget template (with financial statements) or a monthly Google Sheets budget (with financial statements) can help set and track budgets. It can help businesses allocate resources more effectively and compare actual performance against their budget to identify areas that need attention.
Many companies must also produce accurate financial statements for regulatory or tax purposes. A balance sheet and income statement Excel template can simplify generating these statements. Using balance sheet and income statement Excel templates can save time and reduce errors compared to manually creating scratch balance sheets and income statements.
You might also like:
- 10 Tips to Develop a First Class Business Valuation Report
- 10 Main Elements of a Business Plan
- 14 Best Practices in Financial Modeling
- Financial Statements – Definition, Uses, Contents and Templates
- How to Build a Capitalization Table
- Understanding the Debt Service Coverage Ratio: An Essential Metric for Financial Analysis
- Steps to Building Financial Models in Excel
- Mastering the Art of IRR Calculation: A Comprehensive Guide for Investors
- How to Calculate the Compound Annual Growth Rate (CAGR)
- How to Prepare a Financial Feasibility Study?
- Calculating Revenue Growth Rate: A Key Metric for Business Success
- Financial Ratios Analysis and Its Importance
- Cash Flow Analysis in Excel
- Financial Model Templates Easy to Use
- Financial Planning for Startups and Small Businesses
- Financial Planning Retirement Tips
- Business Valuation
- Financial Reporting
- Business Plan Models – Using Business Models as Examples
- 10-Step Financial Planning Checklist for Smart Executives
- E-Commerce & Web Shops
Tags: financial modeling