
0 ITEMS

How to Measure the Quality of Revenue in Your Business
Table of Content
Apple, Amazon, Google, Facebook (Meta), and Microsoft are global tech giants that have revolutionized industries through innovation in consumer electronics, e-commerce, search, social media, and software, shaping the digital economy. But when it comes to financial strength, which of these giants boasts the highest revenue quality?
If we had to choose just one company with the highest quality of revenue today, it would be Microsoft. This Cloud, Software, and AI leader founded by Bill Gates relies on stable, high-margin businesses. Its subscription-based models, such as Microsoft 365 and Azure, generate steady, recurring income. Unlike ad-driven or retail-heavy companies, Microsoft faces less risk from market shifts. Businesses and governments depend on its products, making demand consistent. Strong pricing power and low churn rates further boost revenue stability. While others battle volatility, Microsoft thrives on reliability.
Revenue is the lifeblood of any business, but not all revenue is created equal. High-quality revenue is sustainable, predictable, and diversified, contributing to long-term business growth. Understanding the quality of revenue helps businesses make informed financial decisions, attract investors, and ensure financial stability. This article explores how to assess and improve revenue quality for sustained success.
Understanding the Different Types of Revenues
Before we learn how to measure revenue quality, it is essential to understand the different types of revenues. Revenue is the money a business earns from selling goods or services. It comes before expenses and shows how well a company generates sales. Higher revenue means strong demand, while low revenue signals weak performance. Businesses track revenue to measure growth and plan for the future. It’s the foundation for profits and long-term success.
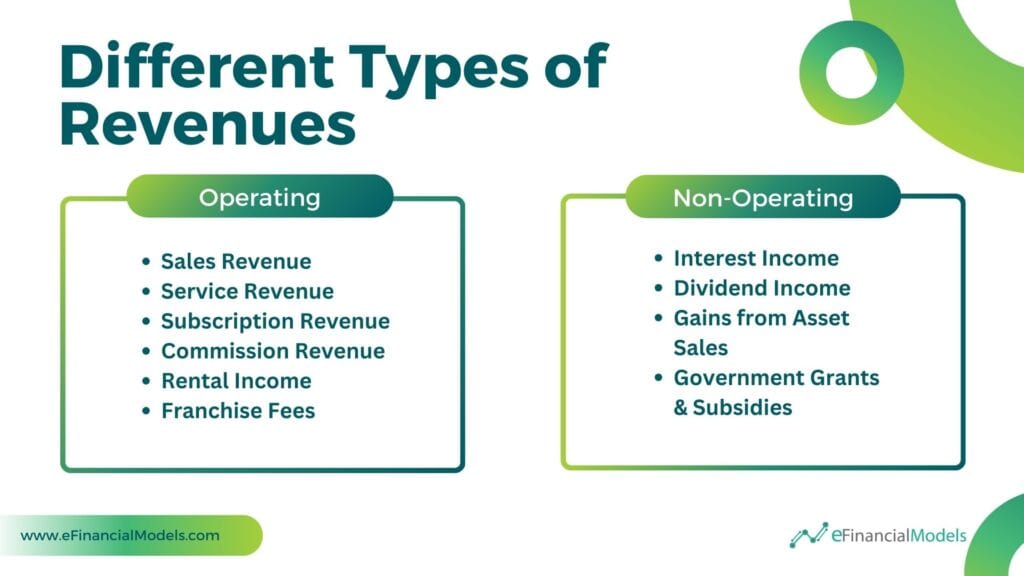
The income statement has two types of revenues: operating and non-operating.
- Operating revenue comes from a company’s core business activities. It reflects the company’s main source of income.
- Non-operating revenue comes from secondary activities. It does not relate to daily business operations.
While operating revenue shows business performance, non-operating revenue highlights extra gains.
Some common examples of operating revenues are:
- Sales Revenue – Income from selling products or services.
- Service Revenue – Earnings from providing services.
- Subscription Revenue – Income from recurring service fees.
- Commission Revenue – Earnings from facilitating transactions.
- Rental Income – Revenue from leasing properties.
- Franchise Fees – Payments received from franchisees.
Some common examples of non-operating revenues are:
- Interest Income – Earnings from investments, savings, or loans.
- Dividend Income – Money received from stock investments.
- Gains from Asset Sales – Profits from selling property, equipment, or investments.
- Government Grants & Subsidies – Financial aid from government programs
Understanding the different types of revenues helps businesses assess revenue quality. Operating revenue, earned from core activities, is often seen as more reliable. Non-operating revenue, like investments or one-time gains, can be unpredictable. Recognizing these distinctions allows companies to focus on stable, long-term growth. By analyzing revenue sources, businesses can improve decision-making and maintain financial health.
Why High-Quality Revenue Matters Most?
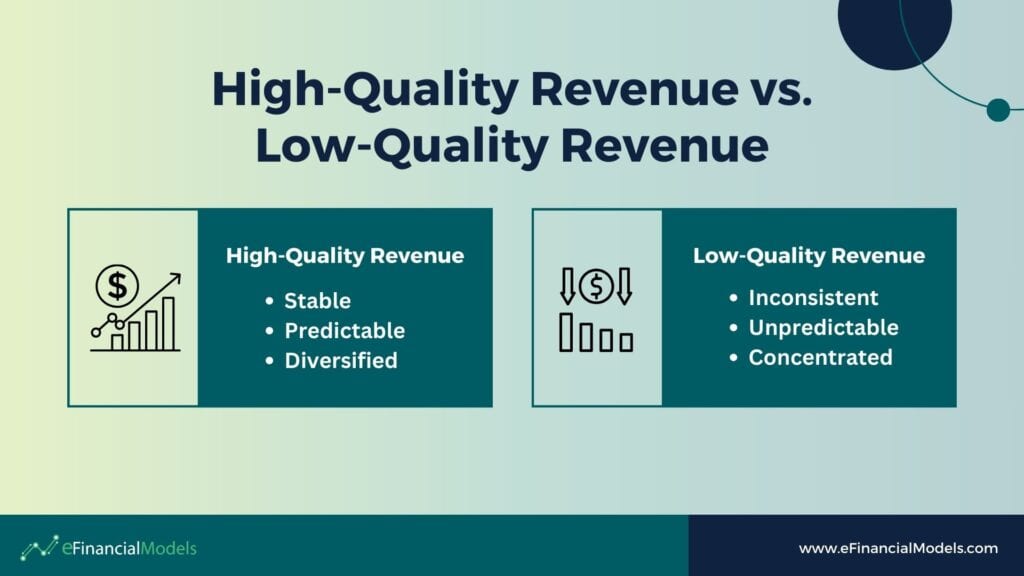
High-quality revenue comes from stable, predictable, and diversified sources. It often includes recurring revenue, high customer retention, and strong profit margins. Businesses with high-quality revenue rely on loyal customers who see long-term value in their products or services. This type of revenue grows sustainably, supports long-term success, and attracts investors looking for reliable returns. Low-quality revenue is inconsistent, unpredictable, and concentrated among a few customers. It often comes from one-time sales, deep discounts, or customers who churn quickly. Businesses that depend on low-quality revenue struggle to maintain stability and long-term growth. While it may boost short-term cash flow, it fails to create lasting value, making it less appealing to investors and limiting financial security.
High-quality revenue matters most because it ensures long-term stability, profitability, and business growth. This type of revenue creates predictable cash flow, allowing businesses to plan investments, expand operations, and innovate with confidence. Investors and stakeholders prioritize high-quality revenue because it signals financial strength and reduces risk. In contrast, low-quality revenue is unreliable and can lead to financial instability. Without a solid foundation of high-quality revenue, growth becomes unsustainable, and profitability suffers. A focus on high-quality revenue helps companies build lasting value, strengthen competitive advantage, and attract long-term investment.















































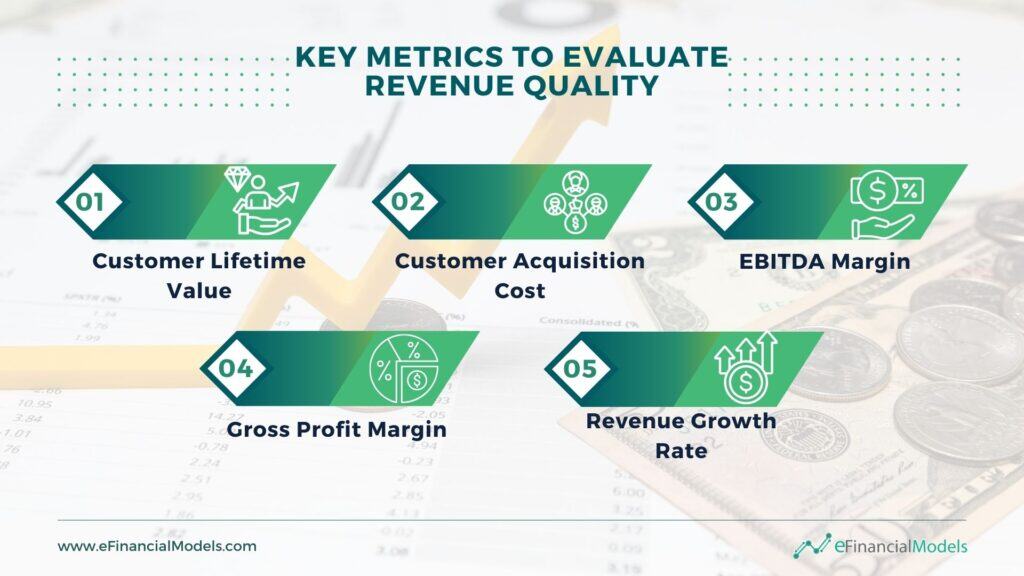
Key Metrics to Evaluate Revenue Quality
Strong revenue isn’t just about high sales numbers—consistency, profitability, and growth potential. Evaluating revenue quality means looking beyond surface figures to understand how stable, predictable, and sustainable earnings are. Key financial metrics can reveal whether a business can maintain its financial health over time. By analyzing these factors, businesses can make smarter decisions, attract better investors, and build long-term success.
Customer Lifetime Value (CLV)
Customer lifetime value (CLV) measures the total revenue a business expects to earn from a customer throughout its relationship. It helps companies understand long-term profitability beyond a single purchase. CLV is a key metric for revenue quality because it reflects customer loyalty, repeat purchases, and sustainable income. High CLV means strong retention and predictable revenue. It also shows the effectiveness of marketing and product value. Businesses with high CLV rely less on costly new customer acquisition.
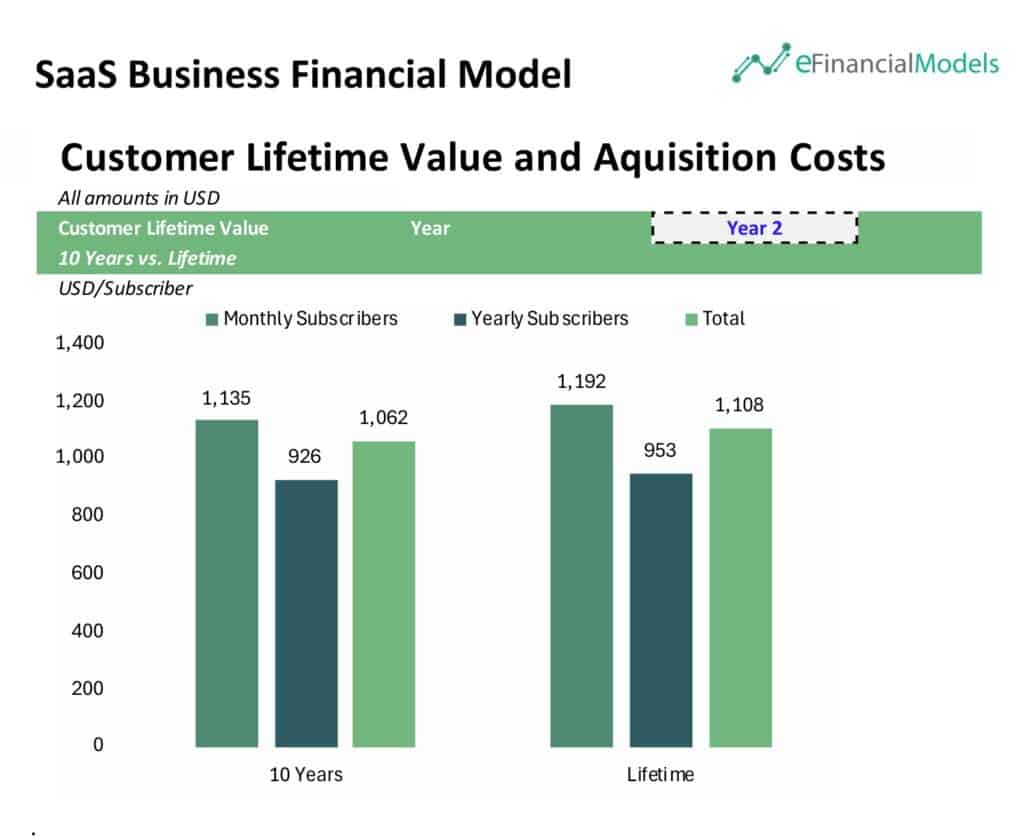
The chart above shows the Customer Lifetime Value (CLV) from a SaaS Business Financial Model. It measures revenue quality by comparing the monthly and yearly CLV for subscribers over 10 years and a lifetime. The gap between 10-year and lifetime CLV reveals customer retention strength. Yearly subscribers generate more predictable income, reducing churn risks.
Customer Acquisition Cost (CAC)
Customer Acquisition Cost (CAC) measures the total cost of gaining a new customer, including marketing, sales, and any other expenses directly tied to attracting and converting leads. Businesses calculate CAC by dividing total acquisition costs by the number of new customers within a period. CAC is a key metric for evaluating revenue quality because it shows how efficiently a company turns spending into paying customers. A low CAC means the business attracts customers cost-effectively, leading to higher profit margins. A high CAC signals inefficiencies and potential revenue problems. Sustainable revenue growth depends on keeping CAC lower than the lifetime value of a customer (LTV). If CAC rises too much, profitability declines, making long-term success harder.
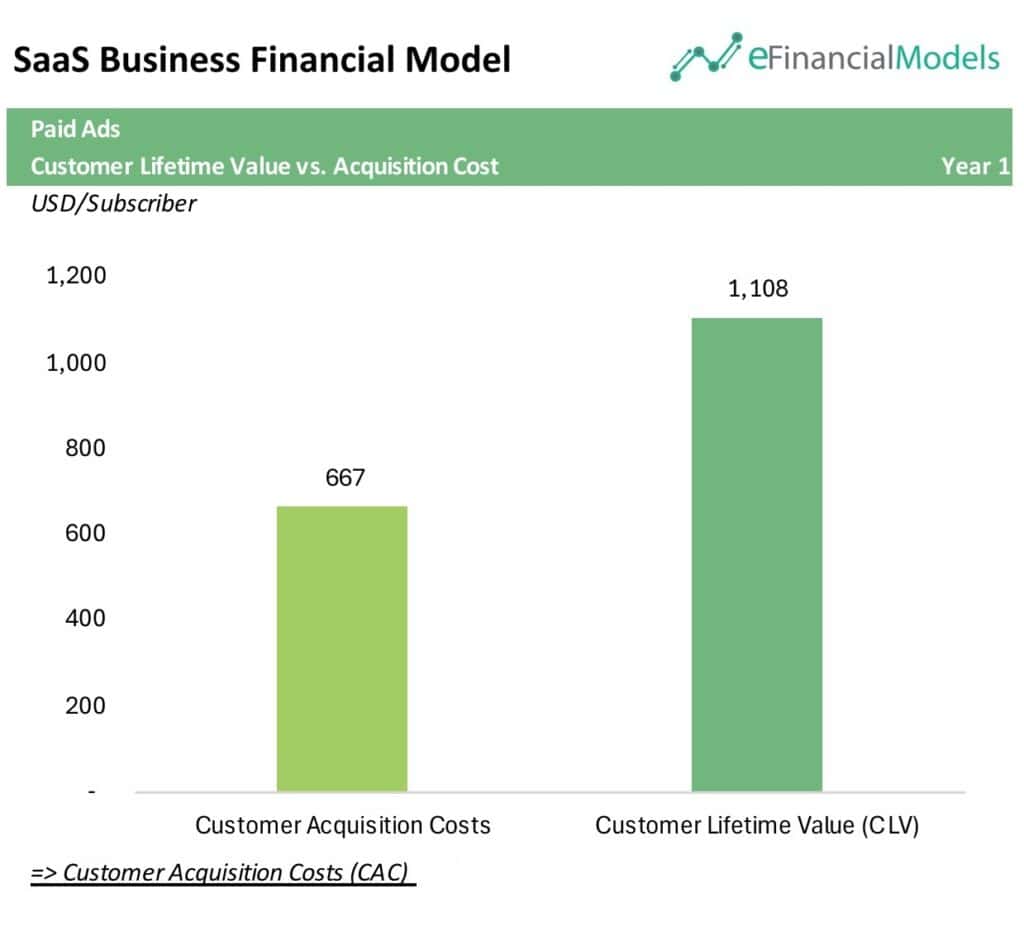
The above chart compares Customer Acquisition Cost (CAC) and Customer Lifetime Value (CLV) to measure the revenue quality of a SaaS company. In this case, the CAC is $667, and the CLV is $1,108, meaning each customer brings in more revenue than the cost to acquire them. CAC is a key metric because high acquisition costs can erode profits, even with strong revenue growth. A sustainable business model ensures that CLV significantly exceeds CAC, maximizing profitability.
EBITDA Margin
EBITDA margin measures a company’s earnings before interest, taxes, depreciation, and amortization as a percentage of revenue. It shows how efficiently a business turns sales into profit before accounting for financial and non-operating costs. A high EBITDA margin signals strong pricing power, cost control, and operational efficiency. It highlights revenue quality by revealing if growth comes from sustainable operations or excessive costs. A stable or growing EBITDA margin indicates healthy revenue, while a declining margin may signal rising costs or weak pricing power.
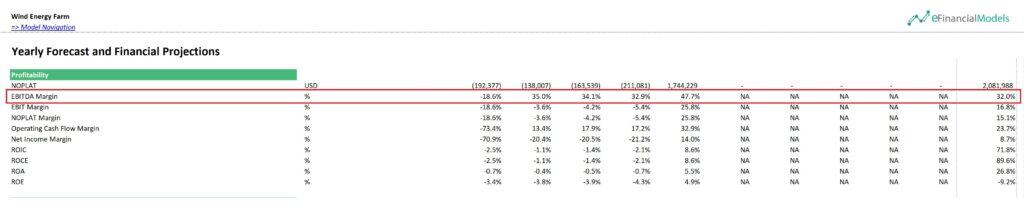
The EBITDA margin in the chart above from a Wind Energy Farm Financial Model measures how efficiently revenue turns into operating profit before deducting interest, taxes, depreciation, and amortization. A positive margin, like 32.0% in the later years, signals strong operational efficiency and cost control. Early negative margins indicate high initial costs, which are common in capital-intensive industries like wind energy.
Gross Profit Margin
Gross profit margin measures the percentage of revenue left after subtracting the cost of goods sold (COGS). It shows how efficiently a company produces and sells its products. The formula is:
Gross Profit Margin (%) = (Revenue – COGS) / Revenue × 100
A strong gross profit margin signals healthy pricing power and cost control. It reveals how much profit remains to cover operating expenses, invest in growth, and generate returns. A declining margin suggests rising costs, weak pricing, or inefficiencies.

The chart above from a Brandy Distillery Business Financial Model shows a strong revenue quality with a gross profit margin averaging around 48%. A higher gross profit margin indicates efficient cost control and strong pricing power, meaning the business retains a significant portion of revenue after covering production costs. Ass seen in the model, a stable or growing margin signals resilience and financial health, making the business more attractive to investors and stakeholders.
Revenue Growth Rate
Revenue Growth Rate measures how fast a company’s revenue increases over a specific period. It is calculated as a percentage change from one period to the next, typically monthly, quarterly, or annually. A strong growth rate signals demand, market traction, and business scalability. Consistent and sustainable growth indicates reliable revenue streams, reducing financial risk. Rapid but unstable growth can suggest short-term gains without long-term stability. Evaluating growth trends helps assess revenue health, customer retention, and future earnings potential. A high-quality revenue stream comes from steady, predictable, diversified growth rather than short-lived spikes.
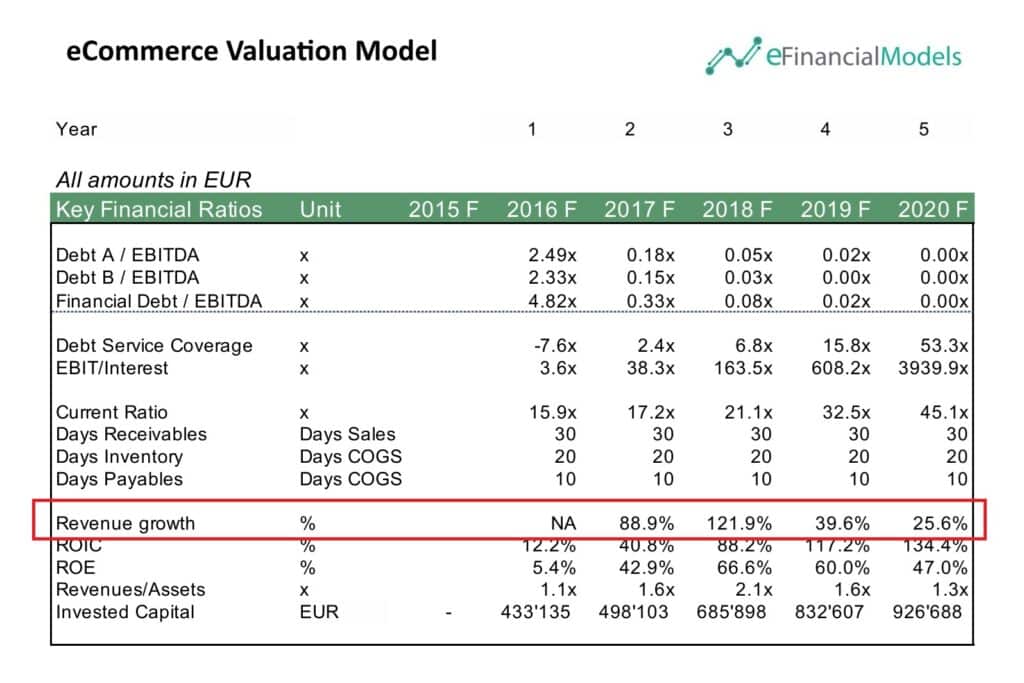
The revenue growth rates in the eCommerce Valuation Model above show a strong early-stage expansion, followed by a slowdown. Growth surged from 88.9% in 2016 to 121.9% in 2017, reflecting aggressive scaling. However, it dropped to 39.6% in 2018 and 25.6% in 2019, signaling market saturation or operational constraints. This trend suggests the business initially captured demand quickly but faced challenges in sustaining high growth. Investors may assess whether the slowdown results from industry limits, competition, or internal inefficiencies. The high early growth is promising, but long-term revenue stability and profitability are key to strong revenue quality.
Boost Revenue Quality with Smarter Financial Modeling
To measure the quality of revenue in your business, track key financial metrics that reflect profitability, efficiency, and growth. The focus is on customer lifetime value (CLV) to assess long-term revenue potential, while customer acquisition cost (CAC) helps evaluate spending efficiency. EBITDA Margin reveals operational profitability, and Gross Profit Margin highlights cost management. Lastly, the Revenue Growth Rate shows business expansion over time. Strong performance in these areas signals sustainable, high-quality revenue that supports long-term success.
Improve your revenue quality by using smarter financial modeling. Analyze key metrics like CLV, CAC, and profit margins to make data-driven decisions. Identify growth opportunities, cut unnecessary costs, and maximize profitability. A strong financial model helps you predict future revenue and confidently adjust strategies. Start optimizing your business today—explore expert financial models at eFinancialModels.com.


















































You might also like:
- 10 Ideas to Increase Average Revenue Per User
- Calculating Revenue Growth Rate: A Key Metric for Business Success
- How to Calculate Annual Recurring (ARR) Revenue for Sustainable Growth
- 5 Best Practices for Managing Days Receivables
- Financial Modeling for Startups and Small Businesses
- 10-Step Financial Planning Checklist for Smart Executives
- Invest Smart With a Surfboard Rental Business
- How Contribution Margin Analysis Can Drive Your Business to Financial Success
- Understanding the Debt Service Coverage Ratio: An Essential Metric for Financial Analysis
- How to Secure Seed Financing?
- Real Estate
- Revenue Model Templates and their Characteristics
- Financial Model Templates Easy to Use
- Business Valuation
- Marketing
- Cash Flow Analysis
- Financial Ratios
- Detailed Financial Model
- Financial Projections
- Simple Budget Planner Template
Tags: Investment Analysis