
0 ITEMS

How to Calculate Revenue Growth Rate
Tracking revenue growth rate reveals how quickly your business is expanding or contracting over time.
- It compares current revenue to past revenue to show percentage change.
- Calculating this metric helps identify trends and assess overall financial health.
- Understanding the influence of sales volume and pricing on revenue guides strategic decisions.
- Accurate calculation supports benchmarking against competitors and industry standards.
- Using financial models to analyze growth rate ensures smarter resource allocation and planning.
Staying aware of how revenue grows is essential for making informed business decisions and sustaining long-term success.
What Is Revenue Growth Rate?
The revenue growth rate indicates the rate at which a company’s sales are increasing over time. It compares current revenue to past revenue and expresses the change as a percentage of the past revenue. This key financial metric is key for investors and managers to track business performance, set goals, and make informed decisions. It helps spot trends early—whether it’s strong momentum or warning signs of a slowdown.
The revenue growth rate is the percentage increase in a company’s sales over a specific period. It shows how quickly a business is expanding by comparing its current revenue to past revenue. Revenue growth is often shown as a percentage. This makes it easy to compare companies of different sizes. It’s clearer than using raw numbers, especially with large figures. This metric helps track business performance, evaluate momentum, and forecast future potential. The revenue growth rate measures how quickly a company’s income increases over time, typically on a weekly, monthly, quarterly, or annual basis. To maintain clarity and consistency, many businesses adhere to a set interval.
Understanding how to calculate revenue growth rate is essential for tracking business momentum over time. It indicates whether a company is expanding, maintaining its status quo, or contracting by comparing revenue from one period to the next. A positive revenue growth rate means your business is earning more than before—sales are rising, and the company is expanding. A zero growth rate shows no change—your revenue stayed flat, which might be fine in stable markets but could signal stagnation. A negative growth rate means revenue is dropping—something is going wrong, like losing customers, shrinking demand, or falling behind competitors. Each rate gives a clear signal about your business’s direction and financial health.

Knowing how to calculate the revenue growth rate—by comparing current revenue with that of a past period and converting the difference into a percentage—is key to spotting trends early and making informed decisions

























































Breaking Down the Revenue Growth Rate Formula
The revenue growth rate formula can be mathematically expressed as:
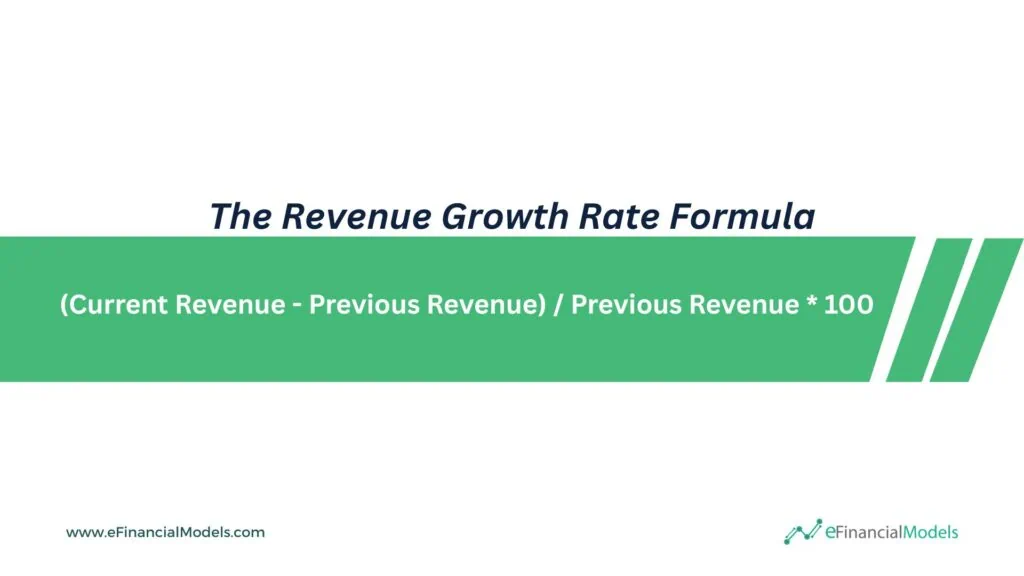
Where:
- Current revenue refers to the total income a company earns during a specified period, typically a month, quarter, or year. It shows the business’s recent revenue and serves as a key input for comparing performance over time. This figure reflects growth, decline, or stability when matched against older revenue numbers.
- Previous revenue refers to the income earned in a comparable period in the past. It provides the baseline for measuring progress. By comparing it with current revenue, businesses can determine whether their sales efforts, market changes, or new strategies have been effective.
- The number 100 turns the calculated ratio into a percentage. This makes the growth rate easy to understand and compare. Without multiplying by 100, the result would be decimal and less intuitive to interpret in a business context.
Example Calculation
For example, let us forecast a company’s monthly recurring revenue for six years. The assumptions are as follows:
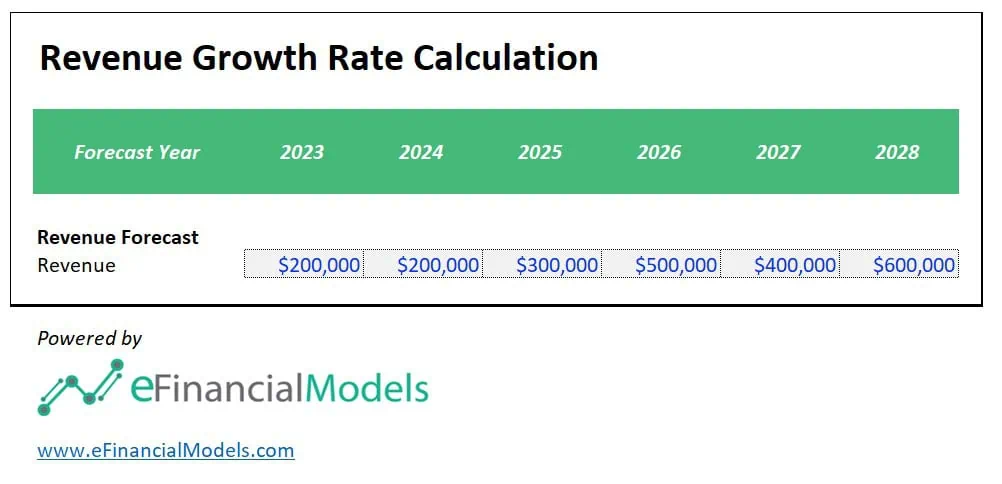
Using the revenue growth rate formula, we can now proceed with the annual revenue growth rate calculation from 2024 to 2028.

The spreadsheet above shows that the company will have fluctuating revenue growth rates from 0% to 66.7% within five years. It is common among businesses due to various factors such as market conditions, economic conditions, changes in customer behavior, and competition.
We can also break down revenue into volume and price to examine their effects. Revenue for a given period is calculated by multiplying volume and price. As such, we can also calculate the revenue growth rate using this mathematical formula:

Where:
- Volume Growth Rate is the percentage change in volume from one period to the next.
- Price Growth Rate is the percentage change in price from one period to the next.
Example Calculation
Let us break down the revenues in our previous example into volume and prices as follows:

From these assumptions, we can now calculate the annual volume, price, and revenue growth rates.

Using a different revenue growth rate formula, including sales volume & price, the spreadsheet above showed the same results. Further interpreting the revenue growth rate calculation, notice that despite a price decrease in 2026, the company still registered a positive growth rate because of the sales volume. It just holds true that sales volume is directly proportional to revenue growth, assuming the price remains constant. In 2027, despite a price increase, the revenue growth decreased because of the sales volume. That means revenue growth could be negatively impact if the price increase decreases sales volume. These are the main reasons we need to understand the factors directly affecting revenue growth.
What Factors Directly Affect Revenue Growth?
The revenue growth rate formula may be broken down into parts by examining how much growth is attributable to increased quantities and prices. By breaking down the growth rate into quantity (volume) and price components, you can gain insights into what’s pushing revenues higher. Understanding which one (or both) is driving growth can clarify the dynamics of the business and its market.
Sales Volume
Sales Volume refers to the quantity of goods or services sold. Increasing sales volume commonly results in proportional revenue growth, assuming the price remains constant. Conversely, a decrease in sales volume can result in a lower revenue growth rate or even a contraction in revenue. Increased sales volume often leads to economies of scale, which might reduce production costs per unit, further enhancing profitability. It can also imply an increase in market share, enhancing the business’s competitive position and potentially leading to further revenue growth.
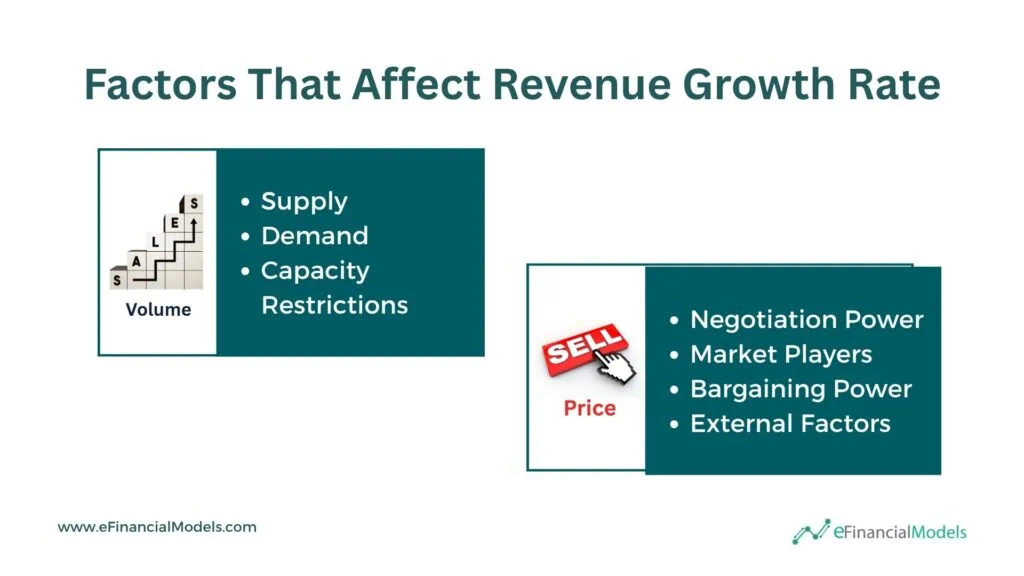
Understanding volume growth requires a deep examination of various factors:
- Supply: Adequate production capacity is essential to meet growing demand. The availability of resources, technology, and workforce will influence the volume. A streamlined supply chain enables quicker delivery, positively impacting sales volume. However, regulations might impose limitations or opportunities, affecting the overall supply and, thus, the volume.
- Demand: Changing consumer preferences can increase or decrease demand for a product or service. General economic conditions influence demand, spending power, and sales volume. As a countermeasure, effective marketing strategies can drive demand by attracting more customers.
- Capacity Restrictions: Space, machinery, or other physical constraints can limit volume growth. Furthermore, limited financial resources may hinder the ability to invest in increasing production or sales capacity, decreasing sales volume.
Selling Price
Sale Price or Selling Price is the cost a customer pays for a product or service. If a company raises the selling prices of its products without a corresponding decrease in volume, it will generally lead to increased revenue. On the other hand, lowering selling prices might result in a temporary increase in volume but might not necessarily lead to a higher revenue growth rate. If the increase in volume doesn’t compensate for the price decrease, revenue growth could be negatively impacted.
Sale price growth may result from various market dynamics:
- Negotiation Power: A company with significant market power, like a monopoly on a product, can set prices, contributing to price growth. A strong brand image might enable higher pricing.
- Market Players and Competition: Competitors’ pricing strategies can influence a firm’s ability to raise prices. The availability and pricing of substitute products will also impact pricing decisions. Products offering the same values significantly affect the pricing.
- Bargaining Power of Suppliers and Customers: The relative power of suppliers and customers can shape price levels, where strong suppliers may drive costs up, and powerful customers may push prices down.
- External Factors: Inflation or general price level increases can lead to price growth in particular products or services. Taxes, tariffs, and regulations can impact costs and prices.
Why Every CFO Should Know How to Calculate Revenue Growth Rate Accurately?
Understanding how to calculate revenue growth rate is essential for unlocking your business’s full potential. This metric offers critical insights into your company’s financial health and overall performance. By consistently tracking it, you’ll be better equipped to make data-driven decisions and implement strategies that drive sustainable revenue growth. Here are a few reasons why revenue growth rate calculation is important:
- Assess Company Performance: Calculating revenue growth rate enables businesses to instantly evaluate their performance over a specified period. A positive growth rate indicates that the company is expanding and its strategies are working. At the same time, a negative rate can signal potential issues. Tracking this metric over multiple periods can give insights into trends and the consistency of growth.
- Benchmarking: Another significant benefit of calculating revenue growth rate is that it allows you to benchmark your business against industry standards and competitors. Understanding how your growth rate compares to others in your industry can provide insights into your market position and help you identify areas where you may need to improve or differentiate yourself.
- Forecasting Financials: Tracking your revenue growth rate can help you make more accurate financial forecasts and projections. By analyzing historical growth patterns, you can make informed predictions about future revenue and plan your business strategies accordingly. It is particularly important for attracting potential partners or securing investments.
- Strategic Decision Making: Understanding how revenue grows can help make informed decisions about resource allocation and expansion strategies. For instance, if a company sees a consistent uptick in its growth rate, it might enter new markets or scale operations. On the other hand, a declining rate could indicate the need for strategic adjustments or even cost-cutting measures.
- Valuation: The revenue growth rate is a critical metric for investors and stakeholders. Rapidly growing companies often command higher valuations because they present greater potential for future returns. Businesses can attract investment and enhance shareholder value by showcasing a consistent and high revenue growth rate.
In essence, the revenue growth rate acts as a barometer for business health, aids in attracting and assuring stakeholders, and shapes strategic decisions.

Financial Modeling for Revenue Growth Optimization
Understanding your business’s Revenue Growth Rate is critical to gauging its health and potential for future success. This metric provides insights into how effectively your company is expanding its operations and generating increased revenue over time. You must actively track this to ensure you get vital information about your company’s trajectory and performance.
Financial modeling is a crucial tool for revenue growth optimization. For any business aiming to optimize its revenue growth, adopting a robust financial modeling approach is not just beneficial — it’s imperative. It transforms abstract data into actionable intelligence, driving sustainable and strategic growth in an ever-evolving market landscape. The precision, foresight, and adaptability these models offer help companies understand how revenue growth drives business success.
Take your business’s growth seriously. Take action now:
- Dive deep into your financials.
- Calculate your Revenue Growth Rate.
- Make informed strategic decisions for a brighter, more prosperous future.























You might also like:
- 10 Ideas to Increase Average Revenue Per User
- 10 Main Elements of a Business Plan
- 10 Tips to Develop a First Class Business Valuation Report
- 14 Best Practices in Financial Modeling
- 5 Best Practices for Managing Days Receivables
- Business Valuation
- Cash Flow Analysis in Excel
- Business Valuation
- Fundraising
- Retail
- E-Commerce & Web Shops
- Food Truck
- How to Calculate Annual Recurring (ARR) Revenue for Sustainable Growth
- How to Grow an Event Organizer Business
- How to Start a Construction Machinery Rental
- 10-year Financial Projections
- Mastering Business Finance: The Three-Statement Financial Model
- Business Valuation Service
- The Potential of Carbon Capture and Sequestration
Tags: business valuation