
0 ITEMS

Earnings Per Share Explained in Simple Terms

Earnings Per Share (EPS) is a key indicator of a company’s profitability, showing how much profit is generated per share of stock.
- EPS helps investors evaluate company performance and compare firms of different sizes easily.
- It influences stock valuation when used with the P/E ratio, indicating whether a stock is undervalued or overvalued.
- Basic EPS considers only current shares, while diluted EPS accounts for potential shares from options or convertible securities, offering a more conservative profit estimate.
- A higher EPS generally signals a more profitable company, but industry context and growth stages matter when assessing if EPS is “good.”
- Understanding and calculating EPS accurately is essential for making informed investment decisions and analyzing financial health.
Continue reading to see how EPS impacts investment strategies and stock valuation in 2025.
Earnings Per Share Definition: What It Reveals?
Earnings Per Share (EPS) is a fundamental financial ratio that helps investors understand how much profit a company generates for each share of its stock. In simple terms, the earnings per share definition tells you how much money a company makes per share, making it easier to compare the profitability of different companies, regardless of their size.
If a company has a high EPS, it’s earning more for each share outstanding, which is often a positive sign for investors. Typically reported on a company’s quarterly and annual financial statements, This clear snapshot of profitability is a key factor many investors consider before buying or selling stock, as it can signal company growth, efficiency, and potential for returns.
The earnings per share definition technically measures a company’s profit for each share of its common stock within a specific time frame, typically one year. It clearly shows how much each shareholder would receive if the company shared all its earnings equally. A higher EPS often means the business is more profitable and may offer better returns. It’s a simple yet powerful way to measure performance and guide investment decisions.

Basic and Diluted EPS
The most common types of Earnings Per Share (EPS) are basic EPS and diluted EPS. Basic EPS shows how much profit is available to each common share without considering potential shares from stock options or convertible securities. Diluted EPS, on the other hand, includes those potential shares, giving a more conservative estimate. It reflects what EPS would be if all convertible instruments were exercised. Diluted EPS is most used in valuation because it offers a clearer picture of potential dilution risks. Investors and analysts prefer it since it shows the lowest possible earnings per share, helping them avoid overestimating a company’s profitability.
What’s a Good Earnings per Share?
A good earnings per share (EPS) means the company is earning well for each share, but there’s no magic number. What’s good depends on the type of business. Fast-growing tech firms can have low EPS if growth is strong. Mature companies usually need higher EPS, often around $3 to $5. Compare EPS to similar firms and watch if it’s rising each year—that shows the company is growing its profits per share.
Still, EPS alone isn’t enough. A high EPS means little if the stock price is too high. That’s where the Price to Earnings (P/E) ratio matters. It shows if a stock is cheap or expensive based on earnings. A P/E near 15 is the long-term average. Above 15 may be pricey; below 15 might be a bargain. But always check the industry average, too. And remember—if the stock price climbs but EPS doesn’t, the P/E rises, and the stock gets more expensive.
U.S. News & World Report is an American media company known for publishing financial analysis, news, and rankings. It created its list of highest earnings per share stocks by analyzing publicly traded companies with strong profits relative to their number of shares. They used data from reliable financial sources to calculate each company’s earnings per share (EPS). Then, they ranked the stocks based on this key metric, which signals how well a company is performing. The goal was to highlight companies with solid potential to deliver value to investors through high EPS.
Here’s the top 10 Highest earnings per share stocks in 2025:

The table above shows Forbes’ 2025 top 10 highest earnings per share stocks. It showcases companies like IBM, Philip Morris, Exxon Mobil, etc., with strong EPS performance. From the list, we gathered data such as stock price, EPS, and P/E ratios from Google Finance. EPS reflects a company’s profitability—higher EPS often boosts investor confidence and can lift the stock price. For instance, IBM tops the list with an EPS of $3.92 and a high stock price of $236.22. However, a stock’s price also depends on its price-to-earnings (P/E) ratio, which tells investors how much they pay for each dollar of earnings. A lower P/E like Devon Energy’s 6.46 may signal undervaluation, while a higher one like IBM’s 34.22 suggests strong growth expectations. EPS and P/E guide investors in valuing stocks beyond just the current price tag.






















































Why Earnings per Share Is Important?
Earnings Per Share (EPS) is a crucial metric for investors because it shows how much profit the company makes for each outstanding stock share. This helps investors evaluate whether a company generates enough earnings to justify its stock price and reward shareholders with dividends.
- Drives Stock Valuation: EPS influences a company’s stock price, guiding investors in assessing its value through the P/E ratio—calculated by dividing the stock price by EPS to gauge how much they pay for each dollar of earnings. Higher EPS often means the company is doing well. That can push the stock price up. It gives a quick view of value per share. A low P/E ratio may signal the stock is undervalued—or cheap—while a high P/E could mean it’s overvalued—or expensive. Investors compare the P/E to industry peers or the company’s past to judge if the price makes sense. Together, EPS and the P/E ratio offer a simple but powerful snapshot to decide if a stock is worth buying or too pricey for its profits.
- Guides Investment Decisions: EPS tells investors if a company is growing. A rising EPS may signal strong performance. A falling one may raise red flags. It helps investors decide whether to buy, hold, or sell. EPS is a simple way to track company health. Let’s say a young investor compares two retail stocks. One company shows steady EPS growth over four quarters. The other has flat or falling EPS. Based on this, the investor chooses the company with rising earnings, expecting stronger future return on investments.
- Impacts Dividend Payouts: EPS shows how much a company can pay in dividends. If earnings are strong, the company might pay more to shareholders. Low EPS may lead to smaller payouts. It helps set expectations for income from stocks. There was a time when Coca-Cola posted high EPS and announced a dividend hike. The earnings support the larger payout. Shareholders see the company has enough profit to share, which increases trust and investor satisfaction.
- Measures Profitability: EPS shows how much profit a company makes for each share. It links earnings to ownership. The higher the EPS, the more profitable the company is. It’s a clear signal of financial success. Suppose a small business goes public and reports its first EPS. Analysts compare earnings to the number of shares. The strong EPS shows the company makes good profit per share, proving it’s running efficiently even at its early stage.
- Useful for Comparing Companies: EPS makes comparing companies of different sizes easier. It shows which firm earns more per share. That levels the playing field. Investors use it to find stronger performers in the same industry. For example, two carmakers report annual results. Both have similar revenues, but one has a much higher EPS. Investors favor the higher-EPS company, knowing it turns income into profit more effectively, even if both generate similar sales.

It is also essential to note that EPS shapes how we read the price-to-earnings (P/E) ratio. Since EPS is the bottom part of that formula, a higher EPS lowers the P/E ratio if the stock price stays the same—making the stock look more attractive. A lower EPS does the opposite, possibly pointing to weak performance or high-growth bets. Investors use this link to judge if a stock’s price fits its earnings and how it stacks up against competitors.
How the Earnings Per Share Calculation Formula Works
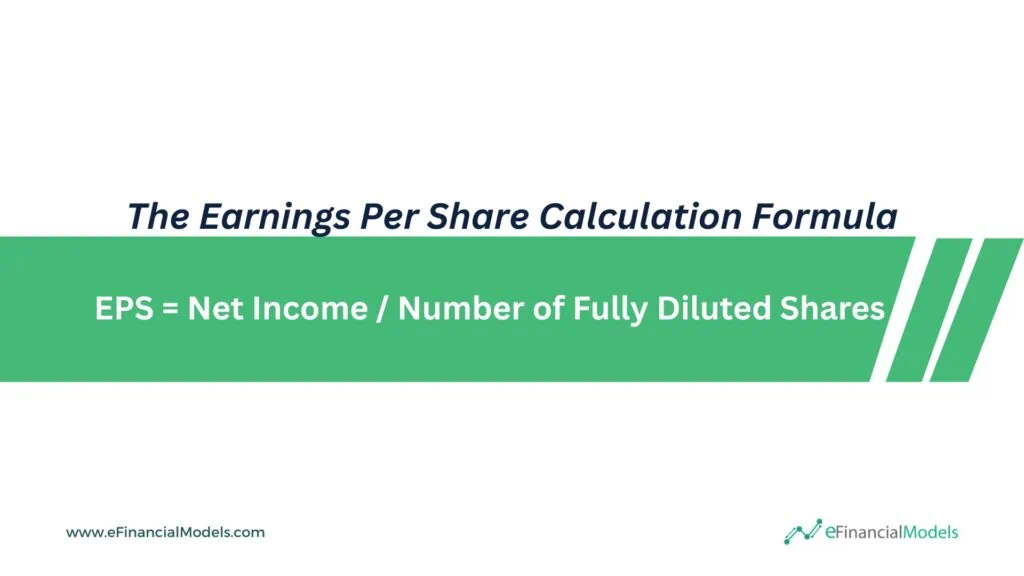
The earnings per share calculation formula helps investors understand how much profit a company earns for each share. We focus on Diluted EPS because it shows the worst-case scenario for existing shareholders. It accounts for all possible shares that could dilute earnings, such as stock options or convertible securities. This makes it more accurate when analyzing a company’s profitability, especially for businesses with stock-based compensation or convertible debt. Diluted EPS gives a clearer view of potential value per share if all instruments are converted into stock.
The earnings per share calculation formula is simple:
Where:
- Net income means the company’s total profit after subtracting all costs, taxes, and expenses. It shows how much money the business made during a period. This profit belongs to shareholders. If you scroll to the bottom of the income statement, the last line is typically labeled “net income” or “profit. In the earnings per share calculation formula, net income sits at the top because it drives the value of EPS. A higher net income means more earnings for each share. It reflects how well the company runs its operations and controls its costs.
- Fully Diluted Shares go beyond just basic shares. They include basic shares outstanding, convertible securities, and potential shares from stock options and warrants (adjusted using the treasury stock method) and other dilutive instruments. This broader view helps analysts understand the most conservative profit per-share estimate, especially when dilution can impact shareholder value.

Earnings Per Share Calculation Formula Example
Here’s an example of the earnings per share calculation formula from our Mergers and Acquisitions (M&A) Financial Model.
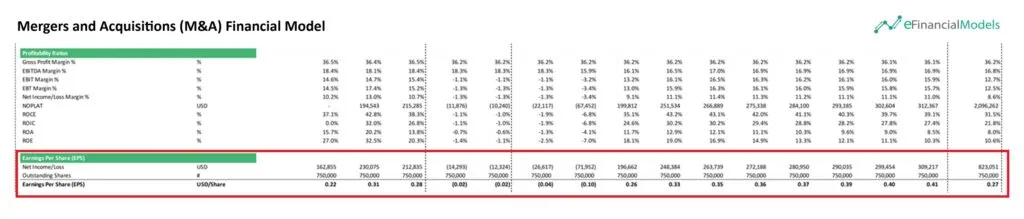
Using real figures, this earnings per share calculation formula example shows how EPS changes over time. It divides net income by 750,000 outstanding shares. For instance, in the first year, a net income of $162,855 results in an EPS of $0.22. As net income rises to $230,075, EPS climbs to $0.31. When net income drops below zero (e.g., –$14,293), EPS turns negative (–$0.02), showing a loss per share. Later, as earnings recover—reaching $823,051—EPS peaks at $1.10. This clear view helps you track how profitability affects shareholder value across different years.
Financial Modeling: The Key to Understanding and Forecasting EPS
Earnings Per Share (EPS) shows how much profit a company earns for each share of stock. It’s a simple yet powerful way to measure a company’s profitability. EPS also plays a key role in calculating the price-to-earnings (P/E) ratio, one of the most used tools to value a stock. A higher EPS can lower the P/E ratio, making a stock look more attractive if the price stays the same. This means that investors pay less for each dollar of earnings, often making the stock look like a better deal. It can signal that the company is more profitable without the price being too high—an attractive combo for many investors.
EPS is calculated by dividing a company’s net earnings by the number of outstanding shares, offering a quick way to compare companies within the same industry. In addition, investors should watch for diluted EPS, which accounts for potential shares from stock options or convertible securities and often presents a more conservative view of profitability.
Financial modeling helps you understand and forecast EPS. It connects income and expenses and shares data to show how earnings move over time. You can test how revenue, costs, or share count changes affect EPS by running different scenarios. This makes it easier to spot risks, plan growth, and make smart investment calls. In short, financial modeling turns EPS into a powerful tool for better decisions.
Frequently Asked Questions
What does Earnings Per Share (EPS) mean?
Earnings Per Share (EPS) is a financial ratio indicating how much profit a company generates for each outstanding share of its common stock. It is a widely used metric to estimate corporate value and profitability on a per-share basis.
How do you calculate Basic Earnings Per Share (EPS)?
Basic Earnings Per Share is calculated by taking the company’s Net Income, subtracting any dividends paid to preferred shareholders, and then dividing the result by the weighted average number of common shares outstanding during the period. The formula is: Basic EPS = (Net Income – Preferred Dividends) / Weighted Average Common Shares Outstanding.
What is the difference between Basic EPS and Diluted EPS?
Basic EPS calculates profitability per outstanding common share. Diluted EPS adjusts this figure to include the impact of all potential shares that could be created from convertible securities like stock options and convertible bonds. Diluted EPS usually results in a lower figure than Basic EPS and provides a more conservative view of profitability per share assuming all potential shares were issued.
You might also like:
- 10 Ideas to Increase Average Revenue Per User
- How to Make Smart Decisions with 6 Key Financial Metrics?
- Financial Ratios Analysis and Its Importance
- Understanding the Debt Service Coverage Ratio: An Essential Metric for Financial Analysis
- Master the Free Cash Flow Formula for Smarter Financial Decisions
- Financial Model for Mobile App | Mobile App Business Plan
- 10 Main Elements of a Business Plan
- 5 Best Practices for Managing Days Receivables
- 5 Practical Tips to Help Raise Funds For Startups
- How to Calculate Net Present Value (NPV)?
- Financial Forecasting Models by eFinancialModels
- Budget
- Real Estate
- Marketing
- Financial Analysis
- Financial Statements – Definition, Uses, Contents and Templates
- Creating a Budget Plan – Using the Best Excel Budget Template
- How to Raise Series A Funding?
- IRR vs NPV in the Context of Financial Decision-Making
- Investment
Tags: financial metrics