
0 ITEMS

How to Effectively Read a Company’s Annual Report

Understanding a company’s annual report provides valuable insights into its financial health and strategic direction.
- Annual reports include key financial statements like the income statement, balance sheet, and cash flow statement, which reveal revenue, expenses, assets, and liabilities.
- Analyzing financial ratios such as EBITDA margin, debt/EBITDA, and return on equity helps assess operational efficiency and profitability.
- Carefully reading the management discussion and narrative sections offers context on growth strategies and future outlooks.
- Deep knowledge of financial metrics supports smarter investment decisions and more accurate valuation.
- Developing skills in financial modeling can simplify interpreting complex data and forecasting future performance.
This guide helps break down the components of annual reports so you can read them with confidence and make informed business decisions.
What are Annual Reports for Companies?
An annual report is a document publicly traded companies must release annually. It is a communication tool sent to shareholders in anticipation of the yearly shareholders’ meeting where the board of directors is elected. The goal is to keep shareholders informed about the company’s activities and performance over the past year. Moreover, these reports are usually available on the company’s website, making them accessible to the general public interested in its affairs.
Please note that annual reports for companies can be formal documents or 10-K filings with the U.S. Securities and Exchange Commission (SEC). In this discussion, we focus on the annual report financial statements. This content primarily provides a detailed overview of the company’s operational and financial status. They are crucial information for shareholders and potential investors as it aids them in making educated decisions regarding their investment in the company. Investors can gauge the company’s health and prospects by analyzing the annual report financial statements.
Who Uses Annual Report Financial Statements?
Annual reports are a vital communication tool for companies, bridging information gaps between them and their stakeholders. Companies can build trust and align interests with diverse audiences by providing a detailed and transparent overview of their performance and strategies. Among them are:
- Shareholders: Existing shareholders use annual report financial statements to assess the company’s performance and economic status, helping them make informed decisions about holding, selling, or buying more shares. They are particularly interested in profits, dividends, and the company’s growth strategies.
- Potential Investors: Individuals or institutions considering investing in a company closely examine annual report financial statements to perform due diligence. They look for revenue, profit margins, debt levels, and operational efficiency information. Potential investors use this data to analyze the company’s valuation, compare it with competitors, and assess the risk and potential return on investment.
- Banks: Banks need to read a company’s annual report to evaluate its financial health and stability, which is crucial for assessing the risk associated with lending money or extending credit to the company. Annual report financial statements provide detailed financial performance information, including revenue, expenses, profit, and cash flow, which helps banks determine the company’s ability to repay loans. Additionally, annual reports for companies offer insights into the company’s management, strategic direction, market position, and potential challenges or opportunities, enabling banks to make informed decisions regarding the level of financial support and the terms of any financial arrangement.






















































How Do You Read and Understand a Company’s Annual Report?
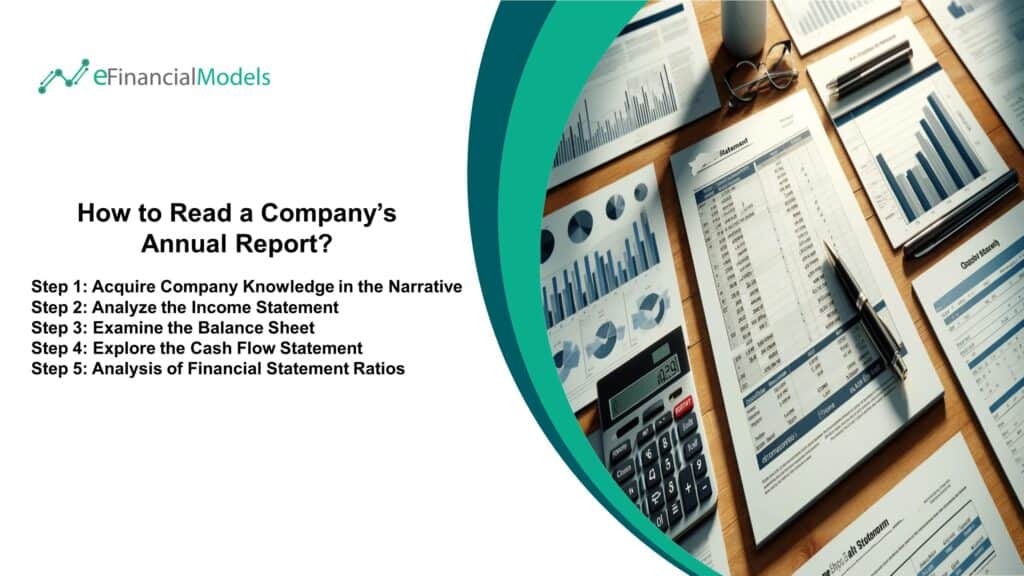
Reading and understanding a company’s annual report is crucial for investors, analysts, and stakeholders to gauge a company’s financial health and future prospects. Here’s a breakdown of how to approach this process step-by-step:
Step 1: Acquire Company Knowledge in the Narrative
This initial step is about getting acquainted with the company’s basics through the narrative sections of the annual report for companies. These narratives include a letter from the CEO, a discussion and analysis by management, and descriptions of the company’s business. This part of the report provides insight into what the company does, its customers, and which industry or industries it operates in. This foundational knowledge sets the stage for a deeper dive into the company’s financials and operations. Understanding the company’s business model, target market, and competitive landscape is essential before delving into the numbers. This context helps in the analysis of financial statement ratios more accurately, as it frames the company’s results within the larger narrative of its operational environment and strategic goals.
Before diving into the financial details of an annual report, consider asking a few basic questions:
- How much money did the company make? The annual report shows the company’s revenue and profits, clearly showing its earning power over the year.
- What does the company own and owe? It details the company’s assets (what it owns) and liabilities (what it owes), offering insight into its financial stability.
- How does the company spend its money? The report breaks down expenses, revealing where the company invests its resources.
- What is the company’s growth strategy? It often includes a letter from the CEO or management discussion and analysis (MD&A) section outlining future plans, growth strategies, and how the company intends to tackle challenges.
- How does the company reward its shareholders? Information on dividends paid, stock performance, and future investment opportunities show how the company plans to provide value to its shareholders.
Step 2: Analyze the Income Statement
Analyzing the income statement is crucial in understanding a company’s financial health and operational performance over the fiscal year. The income statement, one of the primary financial statements, provides a detailed account of the company’s revenues, expenses, and net income. Investors and analysts can identify significant changes or trends by comparing these figures with those of the previous year.
It’s essential to address several key questions regarding the company’s income statement to conduct a thorough analysis:
- What are the primary sources of revenue? This question seeks to identify how the company generates income through product sales, service offerings, or other revenue streams. Understanding the sources helps assess the company’s market position and dependency on specific sectors or products.
- Is the company’s revenue growing or shrinking? Observing revenue trends helps evaluate the company’s growth trajectory and market demand for its offerings. Consistent revenue growth is generally positive, indicating successful business operations and market expansion.
- Is the profit margin (EBITDA) improving or going down? The EBITDA margin, which stands for Earnings Before Interest, Taxes, Depreciation, and Amortization, measures a company’s operating profitability as a percentage of its total revenue. Analyzing this margin over time can reveal how efficiently a company is being managed and its ability to generate profit from its operational activities.
- Is the company’s bottom line (net income) profitable? Net income tells if the company is making more money than it spends. It reveals the company’s profitability after all payments have been deducted from total revenues, offering a clear picture of the bottom line and its year-over-year trajectory. Net income is crucial for assessing the company’s financial viability.
- Is the company paying taxes? This question helps us understand the company’s fiscal responsibility, potential benefits from tax incentives, and the impacts of tax rates on its profitability.
- Overall, is the company profitable? Beyond the current period’s profitability, this overarching question considers the company’s ability to maintain profitability over time, considering factors like revenue growth, expense management, and market challenges.
Step 3: Examine the Balance Sheet
Reading an annual report effectively requires a thorough analysis of its financial health, primarily through the balance sheet, which details the company’s assets, liabilities, and shareholders’ equity. A healthy balance sheet is characterized by a robust and balanced ratio of assets to liabilities, indicating financial stability and the capacity to cover short-term obligations without excessive debt.
To delve deeper into the company’s financial well-being, consider the following critical questions:
- How much capital is needed to produce the profits? This question aims to understand the efficiency of the company’s use of capital expenditures to generate earnings. A lower amount of capital required for generating profits indicates high capital efficiency, a desirable trait that suggests the company can achieve more with less.
- How much financial debt does the company have on its balance sheet? This inquiry helps quantify the company’s total financial obligations. A healthy company should have a manageable level of debt that supports growth without endangering its economic stability. Excessive debt, conversely, may signal financial distress or a heavy reliance on borrowing, which can pose risks to the company’s long-term sustainability.
- How much is the Invested Capital? Invested capital is the total amount of money invested in the company by both debt and equity holders. It provides insight into the total resources available to the company for generating returns.
- What is the return on the invested capital (ROIC)? Return on invested capital (ROIC) measures how effectively the company uses the money invested in its operations to generate profits. A high ROIC indicates the company is using its capital efficiently to generate returns above its cost of capital.
- Overall, does the company have sufficient liquidity? This question assesses whether the company has enough liquid assets to cover its short-term liabilities. Adequate liquidity ensures the company can meet its financial obligations and withstand operational uncertainties.
Step 4: Explore the Cash Flow Statement
Exploring the cash flow statement is crucial in understanding a company’s annual report. It provides transparent insights into the company’s ability to generate cash to fund operations, repay debts, and return to shareholders. The cash flow statement is divided into three main sections: cash flows from operating, investing, and financing activities. Examining these sections helps us understand how the company earns and spends its cash and whether its core operations are profitable.
It is best to find answers to the following questions:
- Did the company produce positive cash flow from operations? This question determines if the company’s core business operations generate enough cash to sustain and grow the business. A positive cash flow from operations suggests that the company is viable and healthy from a cash perspective, mainly because this cash comes from the company’s primary business activities.
- Did the company repay its debt or take on new debt? This inquiry helps understand the company’s financing activities and its strategy for managing debt. Repaying debt improves a company’s balance sheet and reduces interest expenses. Taking on new debt may indicate financing for expansion or operations, which could either be a positive sign of growth or a red flag if the company accumulates debt unsustainably.
- Is the company paying dividends? This question assesses the company’s approach to rewarding its shareholders and its ability to do so. Paying dividends might indicate a company’s confidence in its financial health and profit generation capabilities. On the other hand, if a company raises additional financing instead of paying dividends, it may be looking to invest in growth opportunities or strengthen its financial position.
- Is the company overleveraged? This question examines whether the company has taken on more debt than it can comfortably manage. An overleveraged company may need help paying off its debt, especially if it encounters a downturn in its business or the broader market.
- Overall, can the company service its debt? It is critical to assess the company’s ability to meet its debt obligations with its operating income. It combines cash flow management, debt levels, and profitability to evaluate if the company can sustain its operations and grow while servicing its debt. Companies that can comfortably service their debt are generally considered less risky investments.
Step 5: Analysis of Financial Statement Ratios in An Annual Report
Analysis of financial statement ratios is a more technical step because it transcends mere numbers on a company’s annual report. It means translating them into actionable insights. These ratios distill complex financial information into comparable metrics that highlight a company’s financial health, efficiency, and profitability. They are essential for providing a basis for evaluating a company’s performance relative to its peers and industry standards.
Key aspects to focus on the analysis of financial statement ratios include:
- Revenue Growth Ratio: A revenue growth ratio measures the rate at which a company’s sales income increases over a specific period, indicating the business’s financial health and expansion pace. A positive growth rate means a company’s increasing ability to generate sales and expand its business. This ratio is crucial for assessing the company’s potential for future growth and its competitive position in the market.
- EBITDA Margin: The EBITDA Margin measures a company’s operating profitability as a percentage of its total revenue, calculated by dividing Earnings Before Interest, Taxes, Depreciation, and Amortization (EBITDA) by total revenue. It is a crucial indicator of a company’s operational profitability and efficiency before financing and accounting decisions impact earnings. It helps investors understand how well a company generates cash from its operations, excluding non-operating expenses. A higher EBITDA margin suggests better operational health and less reliance on financial engineering to achieve profitability.
- Debt/EBITDA: Debt/EBITDA is a leverage ratio that assesses a company’s ability to pay off its incurred debts. A lower ratio indicates that a company can theoretically pay off its debt quicker, highlighting stronger financial stability. This ratio is critical for creditors and investors in evaluating the risk associated with lending to or investing in the company.
- Debt Service Coverage Ratio (DSCR): The Debt Service Coverage Ratio (DSCR) measures a company’s capacity to service its debt with its operating income. It is an essential gauge for creditors to assess the risk of lending to the company. A higher DSCR means more net operating income is available to cover debt payments, indicating a lower financial risk.
- Current Ratio: The Current Ratio is a liquidity ratio that measures a company’s ability to pay off short-term liabilities with short-term assets. It provides a snapshot of financial health in terms of liquidity. A higher ratio suggests that a company is in a better position to fulfill its short-term obligations, reducing the risk of economic distress.
- Return on Equity (ROE): Return on Equity (ROE) measures how effectively a company uses equity from shareholders to generate profits. It’s a key performance metric for investors to evaluate the return on their investments. High ROE values indicate efficient management and potentially higher dividends for shareholders.
- Dividend Payout Ratio: The Dividend Payout Ratio is significant for investors interested in the dividend income from their investments. It shows the proportion of earnings a company pays to its shareholders as dividends. A sustainable payout ratio suggests that a company can continue to pay dividends without compromising its growth prospects.
Each of these ratios opens a different window into the company’s financial health and operational effectiveness, collectively providing a comprehensive picture that’s vital for informed decision-making. Analysis of financial statement ratios provides a quantitative measure of a company’s performance over time. It helps make informed decisions about investing in or engaging with the company.
The Components of Annual Report Financial Statements
The components of annual report financial statements are crucial for stakeholders to assess a company’s financial health and performance. These four essential elements include the balance sheet, income statement, statement of cash flows, and financial ratios. Here are the components of annual report financial statements and the key questions they can answer:

Example Annual Report Financial Statement
Income Statement Sample

The income statement above shows a net profit margin of 6.6% in 2023. A “good” net profit margin represents how effectively a company converts revenue into actual profit after all expenses. Generally speaking, a net profit margin of 5% is often considered adequate, 10% good, and 20% or higher excellent, though the specific industry and market conditions can heavily influence this.
Balance Sheet Sample
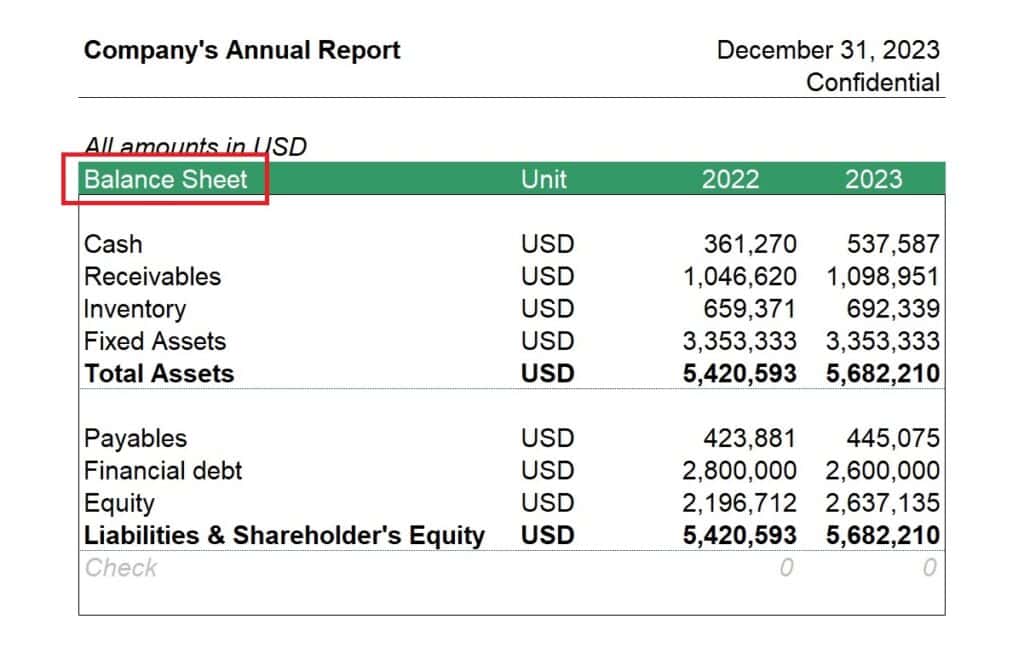
The balance sheet above showed an increase in asset values, a decrease in financial debt, and an increase in equity for 2023. An asset increase generally suggests improved operational strength and potential for future growth. Lower liabilities typically enhance a company’s financial stability and reduce its risk profile. Increasing equity demonstrates confidence in the business and supports future financing and investment opportunities by strengthening the company’s economic base. The combination can signal strong management performance and a robust strategic position, making the company more attractive to investors and lenders.
Cash Flow Statement Sample
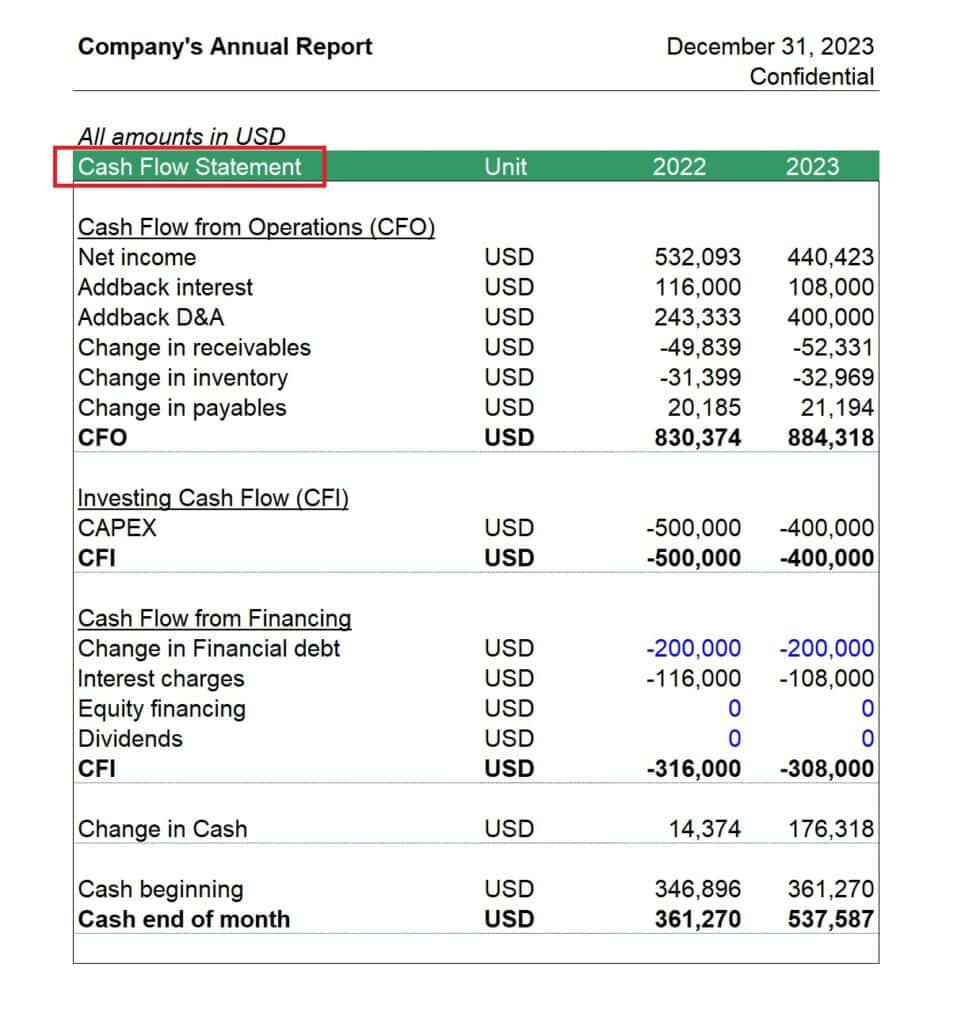
The cash flow statement above displayed an increase in cash flow for 2023. indicates that a company generates more cash from its operational activities, investments, and financing efforts than it is spending. This improvement in cash flow can reflect enhanced operational efficiency. It signals robust financial health and can give a company a competitive edge by providing the flexibility to make strategic decisions without the immediate pressure of financial constraints.
Financial Ratios Sample
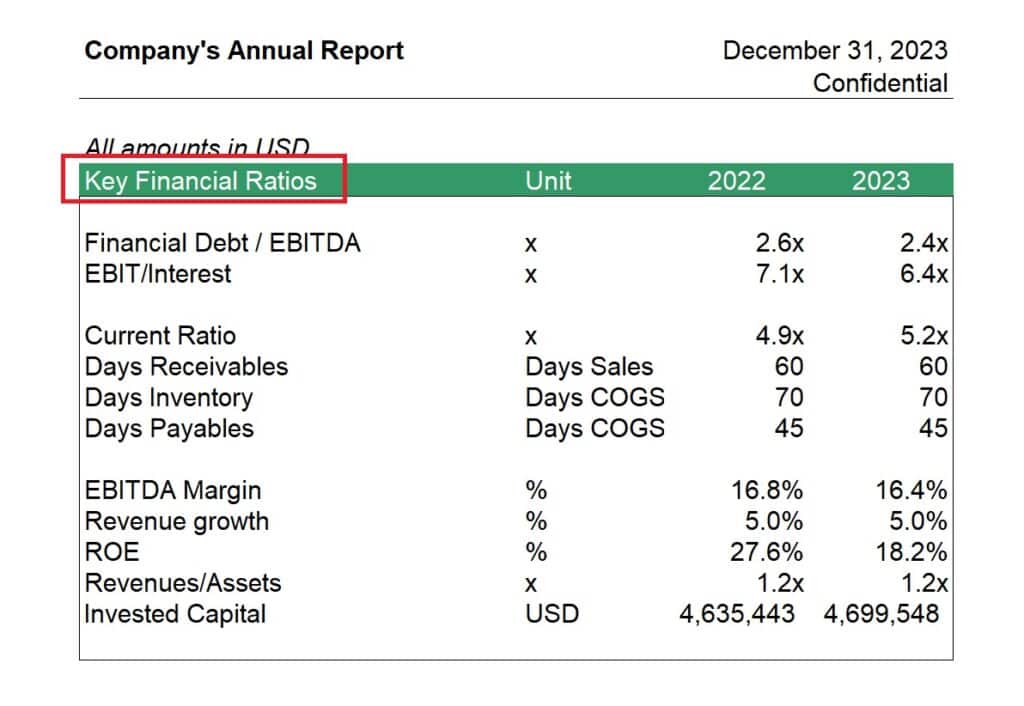
Based on the financial ratios presented above, the company’s performance in 2023 shows a mix of stability and some areas of concern:
- The Financial Debt / EBITDA ratio has decreased from 2.6x to 2.4x, suggesting the company is either generating higher earnings before interest, taxes, depreciation, and amortization (EBITDA) or reducing its financial debt, indicating improved financial stability.
- The EBIT/Interest decrease from 7.1x to 6.4x could imply that the company’s earnings before interest and taxes (EBIT) have decreased relative to interest expenses or interest expenses have increased, potentially indicating more costly debt servicing.
- A Current Ratio increase from 4.9x to 5.2x shows that the company has more current assets relative to its current liabilities, which could mean better liquidity and short-term financial health.
- Days Receivable remained constant at 60 days, indicating that the company’s efficiency in collecting accounts receivable has remained constant.
- Days Inventory also remained steady at 70 days; the company consistently turned over inventory within the same timeframe as the previous year.
- Days Payables have remained unchanged at 45 days; the company is paying its suppliers in the same time period as the previous year, maintaining its payment cycle.
- EBITDA Margin slightly decreased from 16.8% to 16.4%, suggesting a slight decline in operational profitability relative to sales.
- Revenue Growth is steady at 5.0%, indicating consistent yearly revenue increase.
- ROE (Return on Equity) showed a significant decrease from 27.6% to 18.2%, indicating that the company is generating less profit from shareholders’ equity than the previous year, which might be a concern for investors.
- Revenues/Assets have remained shareholders’ 1.2x, indicating the efficiency with which the company uses its assets to generate revenue has stayed the same.
- Invested Capital have increased from 4,635,443 USD to 4,699,548 USD, suggesting the company still needs to increase its sales or income.
These financial ratios alone can provide insights into different areas, such as debt management, operational efficiency, or profitability. However, they are most potent when analyzed in context and over time to understand the company’s overall financial performance and strategy.
For further information, you can check our Financial Ratios Cheat Sheet, a summary guide to financial ratios detailing the definitions and formulas for the most commonly applied financial metrics.
Model Your Way Through An Annual Report
Navigating a company’s annual report is akin to embarking on a treasure hunt, where the treasure is a comprehensive understanding of the company’s financial health, strategic direction, and future prospects. These reports, dense with numbers and narratives, offer a goldmine of information for investors, analysts, and stakeholders. However, the challenge lies in decoding the complex financial statements and key performance metrics to make informed decisions. Mastery in reading these reports is crucial as they reflect past and present performances and offer clues about future potential. Thus, an adept reading can reveal opportunities and red flags, guiding investment and strategic decisions.
Financial modeling is a powerful compass in this intricate journey, simplifying the complexities of annual reports. By translating the vast array of numerical data and qualitative information into dynamic, interpretable models, financial modeling enables a deeper, more analytical exploration of a company’s operations and economic standing. It allows for scenario analysis, forecasting, and valuation, turning raw data into actionable insights. This hands-on approach demystifies the data, fostering a more intuitive understanding of the company’s financial narratives and underlying health, thereby making the reading of annual reports not only easier but also significantly more insightful.













You might also like:
- 10 Tips to Develop a First Class Business Valuation Report
- 10 Main Elements of a Business Plan
- Financial Statements – Definition, Uses, Contents and Templates
- How to Write a Business Plan Step-by-Step
- Understanding the Key Differences Between Levered and Unlevered Free Cash Flow
- Understanding Debt Sizing & Project Finance Ratios
- How to Calculate Annual Recurring (ARR) Revenue for Sustainable Growth
- How to Evaluate a New Solar Park for Investment?
- How to Prepare a Financial Feasibility Study?
- How to Calculate Net Present Value (NPV)?
- Cash Flow Analysis in Excel
- Developing a 5 Year Financial Projection Template
- 5 Practical Tips to Help Raise Funds For Startups
- 10-Step Financial Planning Checklist for Smart Executives
- Commercial Real Estate Valuation Methods: Helping Investors in Taking Informed Decisions
- Business Valuation Service
- A Deep Dive Into Understanding 10K Reports
- Financial Ratios Analysis and Its Importance
- Case Study: Financial Model Templates Easy to Use
- Understanding What is Yield to Maturity and Why It Matters