
0 ITEMS

How to Build a Capitalization Table

When a startup seeks to raise its first round of venture capital funding, a detailed capitalization table is essential to present the current ownership structure and potential dilution to prospective investors. Additionally, when issuing stock options to employees, a cap table helps ensure that equity distribution is accurately tracked and managed. A startup capitalization table provides a clear and comprehensive snapshot of a company’s ownership structure. It details who owns what percentage of the company. This information is vital for making informed decisions about equity financing, stock options, and future fundraising rounds.
- It clearly shows ownership distribution among founders, investors, and employees.
- The cap table tracks share types, ownership percentages, and valuation metrics like pre- and post-money valuation.
- Maintaining an accurate cap table simplifies due diligence and transparency during funding rounds.
- Visual tools like charts and graphs make complex data easier to interpret and share.
In this guide, we invite you to explore the elements of a capitalization table and learn how to build and read one. Whether you’re a startup founder, an investor, or someone interested in the mechanics of equity financing, understanding how to create and interpret a cap table is invaluable. Let’s dive in and demystify the process of building a capitalization table.
What Is a Capitalization Table?
A startup capitalization table, often called a cap table, is a detailed spreadsheet or document that outlines a company’s ownership structure or startup equity distribution. It lists all of the company’s securities along with the names of the investors or owners and the percentage of ownership held by each. The cap table is essential for tracking the equity stakes of founders, employees, and investors and helps understand startup equity dilution. It is also a critical tool for managing equity distribution, making strategic decisions, and ensuring transparency for stakeholders.

Essential Components of a Cap Table Excel Template
A cap table Excel template typically takes the form of a spreadsheet with several columns and rows. It consists of several essential components.
Shareholders Categories & Entry Stage
This section of the cap table lists all the company’s shareholders per category, such as founders, investors, employees, and advisors. Some may also be grouped as early investors (such as angel investors and seed funds) and institutional investors (like venture capital firms). Each category indicates the entry stage at which these shareholders acquired their stakes in the company, providing insight into the investment and ownership distribution timeline. This section helps stakeholders understand the evolution of ownership, the relative influence of different shareholder groups, and the company’s funding history.
Share Types, Ownership & Percentage
Share types refer to the different classes of shares issued by the company, such as common shares, preferred shares, convertible securities, and warrants.
- Common shares represent ownership in a company, giving shareholders voting rights and a claim on a portion of the company’s profits through dividends. They are the most common form of equity ownership in a corporation.
- Preferred shares are a class of equity that typically provide dividends at a fixed rate and have priority over common shares in the event of a company’s liquidation. However, preferred shareholders generally do not have voting rights.
- Convertible securities are financial instruments, such as bonds or preferred shares, that can be converted into a predetermined number of common shares. The conversion can be initiated at the holder’s discretion or according to specific terms set by the issuer.
- Warrants are financial instruments that give the holder the right, but not the obligation, to buy a company’s stock at a specified price before the expiration date. Companies often issue warrants to raise capital or as incentives for investors.
Each type of share can have different rights and privileges, including voting rights, dividend entitlements, and liquidation preferences. Distinguishing between share types is crucial for understanding the hierarchy of ownership and the specific terms associated with each type of equity.
Details on the number of shares each investor owns and the corresponding total ownership percentage are also essential. This helps visualize how much control and influence each shareholder has in the company. This section often includes calculations to show both the number of shares and the ownership percentage, providing a clear picture of equity distribution.
Price Per Share
The price per share indicates the purchase price or the value at which shares have been issued to investors. This figure is essential for understanding the valuation at different funding rounds and the price at which future equity might be sold. It can also provide insights into the company’s growth and shareholder return on investment.
Equity Valuation
Equity valuation refers to the total value of the company’s equity based on the current share price and the total number of outstanding shares. This section calculates the company’s overall worth and provides a basis for evaluating investment opportunities. It’s a critical metric for both current shareholders and potential investors to assess the company’s financial health and market position.
- Pre-money valuation is the value of a company before it receives any new external financing or investment. It represents the company’s worth based on its current assets, earnings, market potential, and other factors before adding any new equity from investors.
- Post-money valuation is a company’s value immediately after receiving external financing or investment. It is calculated by adding the amount of new equity raised to the pre-money valuation. This valuation represents the company’s total value, including the new investment.
In a capitalization table, the pre-money valuation helps determine the price per share for the new investment. In contrast, after adding the new capital, the post-money valuation shows the company’s total worth. This distinction is crucial for understanding ownership percentages and dilution effects on existing shareholders.
Investor IRR
The Internal Rate of Return (IRR) measures an investment’s long-term profitability. It calculates the annualized rate of return by considering the timing and amount of cash flows. In a cap table, the IRR helps investors evaluate the efficiency of their investments and make informed decisions about future funding rounds or exits. It is a key indicator of a company’s financial performance and potential growth.
Investors’ Cash on Cash Multiple
The cash-on-cash multiple measures the return on investment for shareholders based on the cash invested and the cash returned. It is calculated by dividing the amount of cash received from the investment by the initial amount invested. This metric helps investors understand the profitability of their investments and compare the performance of different investment opportunities.
Each component provides crucial information for understanding a company’s ownership structure, financial health, and investment potential, making the cap table an indispensable tool for stakeholders.




















































Uses of a Startup Capitalization Table
A startup capitalization table is a strategic tool for managing a company’s financial structure and ownership details. It provides a comprehensive overview of the equity distribution among founders, investors, and other stakeholders, ensuring clear visibility of the company’s financial landscape. By maintaining an accurate and updated cap table, startups can make informed decisions, attract potential investors, and effectively manage equity and debt, ultimately supporting their growth and strategic goals. Below are the most common uses of a cap table Excel template:
Display Ownership Structure
A startup capitalization table lists all shareholders, the number of shares they hold, and the percentage of ownership this represents. It provides a detailed breakdown of who owns what portion of the company, including founders, investors, employees, and other stakeholders. This visual representation helps founders and management to understand the distribution of equity and maintain clarity on the ownership stakes at any given time.
Key Due Diligence Tool
Regarding fundraising or acquisition, the cap table is not just a document but a key player in financial due diligence. It provides transparency about the company’s equity structure, showing how much equity has been allocated, to whom, and under what terms. This information is not just useful but crucial for potential investors or acquirers to evaluate the company’s financial health and investment potential.
Monitor Equity Value
Regarding financial management, a cap table is like a compass that helps a startup navigate the ups and downs of equity value. By keeping track of the shares issued, stock options granted, and any other equity transactions, the cap table allows founders and investors to see how the company’s equity value evolves. This monitoring is not just a passive observation but an active tool that aids in making informed decisions regarding future fundraising and valuation.
Provide Investor Information
Investors rely on the cap table to clearly understand their investment and its potential return. It details the equity stakes of all shareholders, including preferred and common stockholders, and the terms associated with their shares. This information is vital for investors to understand their position relative to other shareholders, the potential for dilution, and their influence on company decisions. Regularly updating investors with cap table changes keeps them informed and builds trust.
Support Stock Option Management
The cap table simplifies the complex task of managing stock options. It tracks the issuance, exercise, and vesting of stock options granted to employees and other stakeholders. By maintaining accurate records of who holds options and the terms under which they were granted, the cap table helps ensure compliance with legal and financial regulations. It also supports strategic decisions around employee compensation and incentive programs, helping to attract and retain top talent.

A Step-by-Step Guide to Building a Cap Table Excel Template
This step-by-step guide will walk you through building a comprehensive cap table Excel template, helping you maintain accurate records and make informed financial decisions.
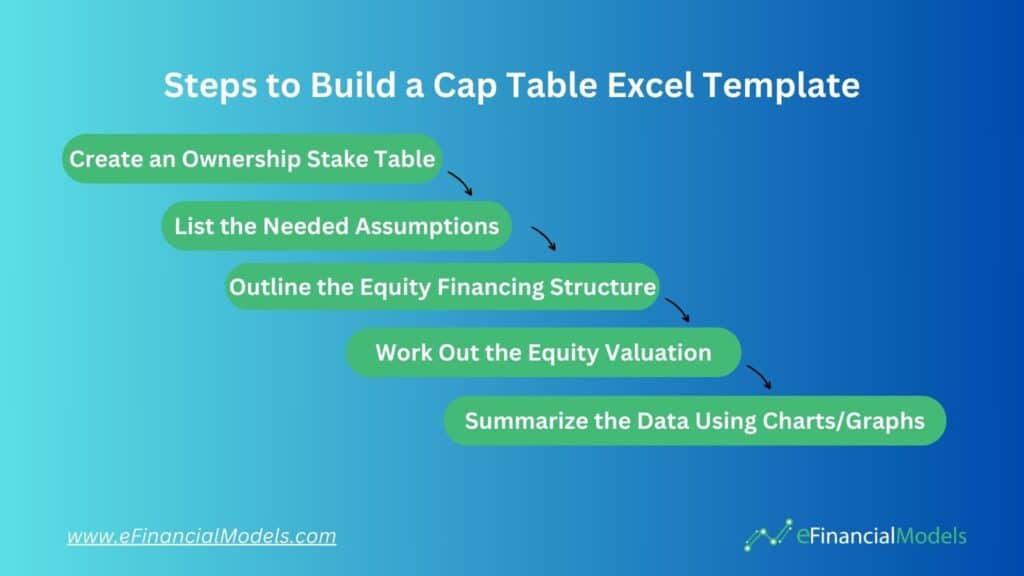
Step 1 – Create an Ownership Stake Table
The first step to building a cap table Excel template is to set up the following columns:
- Capitalization As Of Date
- Group Shareholder per Share Type & Category
- Entry Stage
- Investment Value Number of Shares (New Shares & Total Shares)
- Percentage Ownership
- Purchase Price or Price Per Share
Step 2 – List the Needed Assumptions
In step 2 of creating a cap table Excel template, you must list all the needed assumptions by first cataloging all shareholders and identifying their equity types, such as common stock, preferred stock, or options. Record the entry stage for each shareholder, whether it’s seed, Series A, or later stages. Next, index the investment price per shareholder, ensuring you have an accurate record of each shareholder’s share price. Quantify each shareholder’s total investment by multiplying their price by the number of shares purchased. Finally, calculate each shareholder’s percentage ownership by dividing their total investment value by the total equity value, summing these percentages to ensure they align with the total ownership distribution.
Step 3 – Outline the Equity Financing Structure
In step 3 of building a cap table Excel template, you outline the equity financing structure by cataloging all types of equity, including common stock, preferred stock, convertible notes, and options. For each equity type, detail the number of shares issued, the price per share, and any relevant terms like liquidation preferences, conversion rights, and voting rights. Sum up the total number of shares for all shareholders, reflecting the cumulative ownership structure. Additionally, include the total value of new financing rounds and the cumulative value of all financing rounds to date. This comprehensive summary provides a clear picture of the company’s overall equity distribution, the impact of various financing events, and the total investment received, ensuring transparency and facilitating informed decision-making.
Step 4 – Work Out the Equity Valuation
In step 4 of building a cap table Excel template, calculate the equity valuation by first determining the pre-money valuation, which sets the company’s value before new investments and helps establish the price per share for new investors. Then, calculate the post-money valuation, which includes the new capital infusion and shows the company’s total worth after the investment.
To evaluate the efficiency and profitability of the investments, calculate the Investor’s Internal Rate of Return (IRR), which measures the annualized return over the investment period. Additionally, compute the cash-on-cash multiple, which compares the amount of cash received from an investment to the amount invested. This provides insight into overall profitability and allows investors to compare the performance of different investment opportunities. This comprehensive valuation analysis ensures a clear understanding of the financial impact of new investments and the overall health of the company’s equity structure.
Step 5 – Summarize the Data Using Charts and Graphs
In step 5 of building a cap table Excel template, summarize the data using charts and graphs to provide a clear and visual representation of key metrics. Create pie charts or bar graphs to illustrate share ownership, showing the equity distribution among different shareholders and equity types. Use line charts or bar graphs to depict equity valuation over time, highlighting pre-money and post-money valuations. Display the Investor’s Internal Rate of Return (IRR) using line graphs to show the profitability and efficiency of investments over different periods. Similarly, bar charts or line graphs can represent the cash-on-cash multiple, allowing investors to compare the profitability of various investments easily. These visual tools help stakeholders quickly grasp the company’s financial status, ownership structure, and investment performance, facilitating better decision-making and communication.
























































Capitalization Table Example
Here’s a capitalization table example to help illustrate how equity is distributed, tracked, and managed through various stages of a company’s growth and funding rounds.
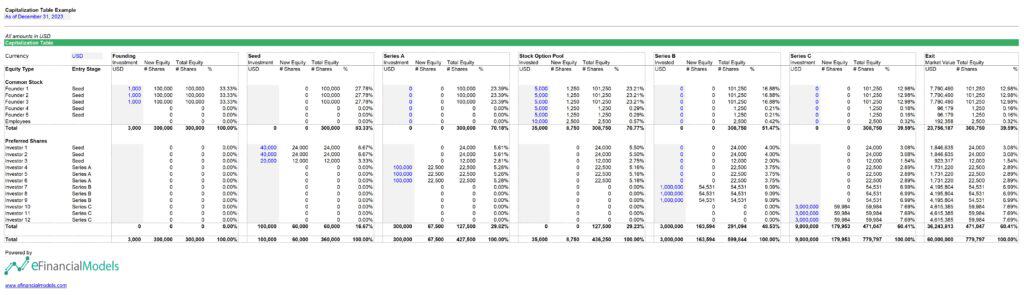
The capitalization example table above is divided into multiple sections: the equity types include common stocks, preferred shares, and stock option pools. There are also columns for different funding stages and rounds:
- The founding stage is the initial phase, where the startup is conceptualized and often self-funded or supported by friends and family.
- The seed stage involves early investment in developing the business idea, usually involving angel investors or early-stage venture capitalists.
- Series A is the first significant round of venture capital funding to optimize product and market fit and scale operations.
- Series B is a funding round to expand the business, improve infrastructure, and enhance market reach.
- Series C is an investment in scaling the business further, often leading to international expansion and preparation for exit.
- The exit stage is when the startup is acquired, merged, or goes public, realizing its market value.
As you can see in the capitalization table example above, the founders started with an investment of $1,000 each, totaling $3,000, and initially held 100,000 shares each. The seed investors invested $40,000 for 24,000 shares, diluting the founders’ ownership to about 27.78%. In Series A, a new investor invested $100,000 for 22,500 shares, reducing the founders’ and seed investors’ percentages. In Series B, an investor invested $1,000,000 for 54,531 shares, further diluting existing shareholders. In Series C, an investor invested $3,000,000 for 59,984 shares. The Exit Stage shows the final market value of the total equity held by each shareholder.
Furthermore, here are the key data points in our capitalization table example:

The capitalization table example shows the price per share upon founding is $0.01. The number of shares started at 300,000 during the founding stage. It gradually increased through Series A, B, and C, reaching 12,403,000 shares before the exit. The price per share increases significantly from $0.01 at the founding stage to $76.94 at the exit stage, indicating the growth in the company’s value. The company’s pre-money and post-money valuations increase with each funding round, reflecting its growing value as it secures more investments. Furthermore, each funding round introduces new equity and increases total equity, leading to dilution of ownership for existing shareholders but providing the necessary capital for the company’s growth.
Now, let us go to the Investor’s IRR calculation of our capitalization table example:
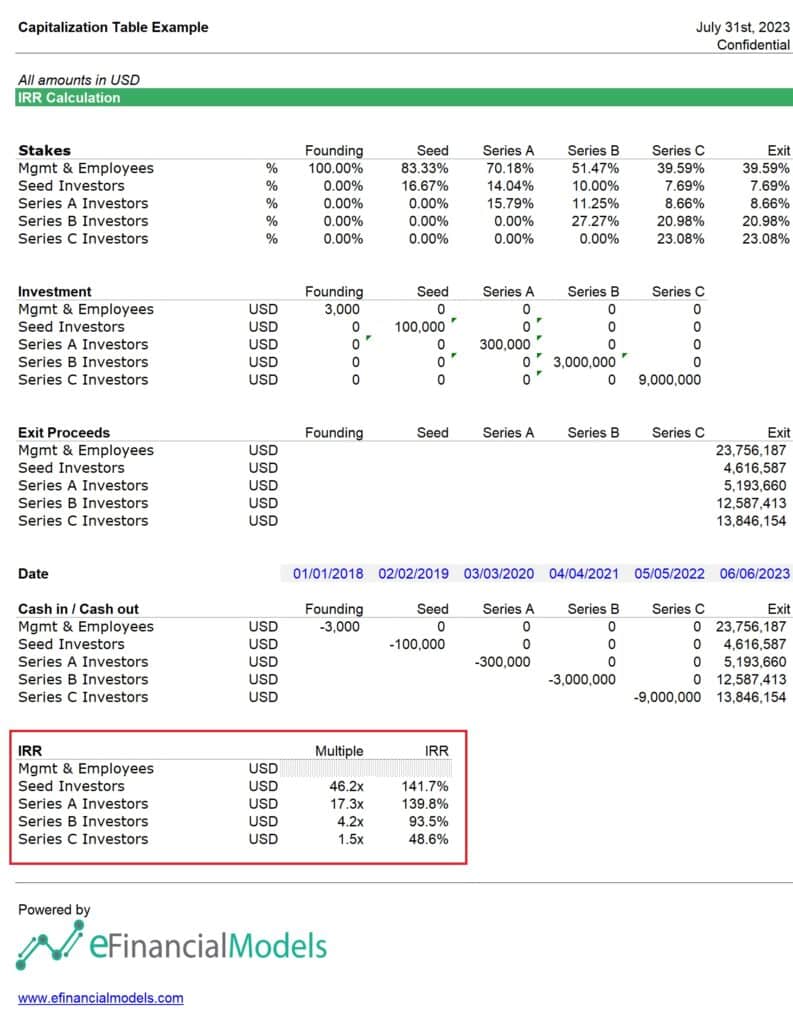
The IRR calculations indicate the annualized effective compounded return rate for each group of investors based on their cash inflows and outflows over the investment period. In our in our capitalization table example, the figures are as follows:
- Management & Employees achieve a cash-on-cash multiple of 46.2x and an IRR of 141.7%.
- Seed Investors achieve a cash-on-cash multiple of 17.3x and an IRR of 139.6%.
- Series A Investors achieve a cash-on-cash multiple of 4.2x and an IRR of 93.3%.
- Series B Investors achieve a cash-on-cash multiple of 1.5x and an IRR of 48.6%.
- The Series C Investors are not explicitly shown but can be inferred as a part of the overall proceeds.
Our capitalization table example ends with an executive summary worksheet. This worksheet provides an easily understandable overview of critical data points, making complex financial information more accessible. It also helps stakeholders quickly grasp the equity distribution and financial structure without analyzing detailed numerical data.
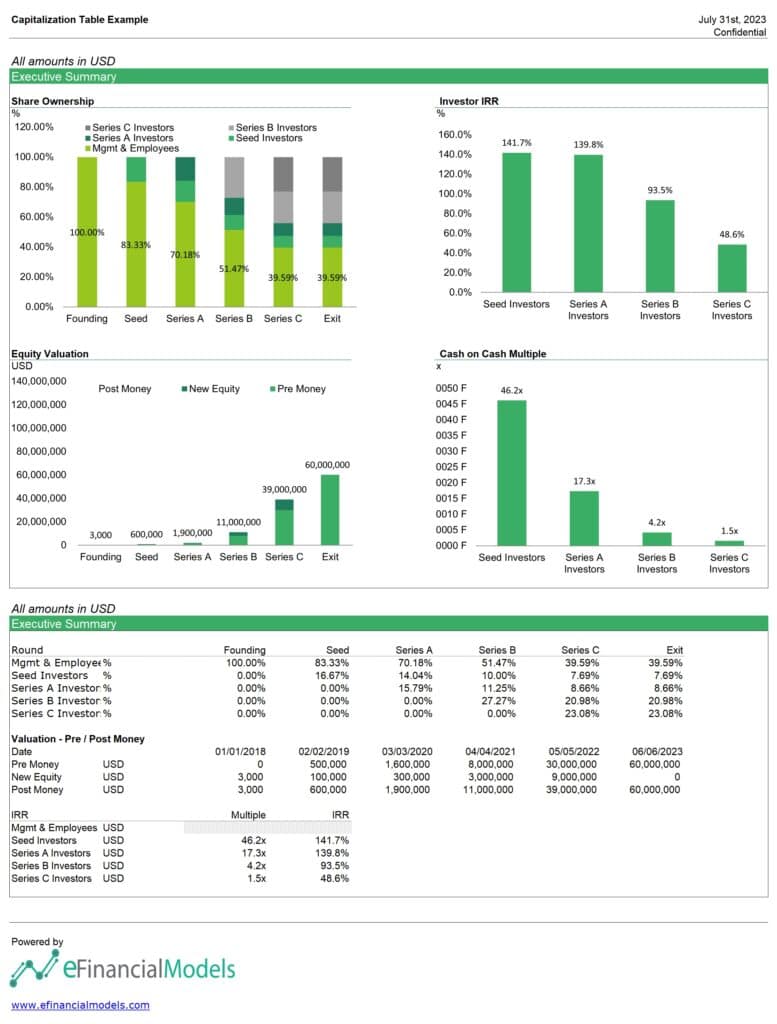
Our capitalization table example clearly shows who owns what in the company, how much each party invested, and how ownership percentages evolve as new investment rounds occur. The table also effectively illustrates how ownership dilution occurs through successive funding rounds and the financial outcomes for each group of investors at the exit stage. This information is crucial for understanding the company’s financial structure, planning future investments, and preparing for exit strategies like mergers, acquisitions, or public offerings.
Free Download: Simple Cap Table Template
Building a capitalization table is critical for any startup or business seeking to manage its equity structure effectively. It details ownership stakes, equity types, and share distribution among founders, investors, and employees. A well-constructed cap table provides transparency, helps make informed financial decisions, and is essential for understanding the impact of future fundraising and equity dilution. By maintaining an accurate and up-to-date cap table, businesses can better navigate the complexities of ownership, facilitate investor relations, and ensure a clear understanding of the company’s financial health.
Access to a simple cap table template can significantly streamline managing your company’s equity distribution. This free download offers a user-friendly solution for tracking ownership stakes, understanding dilution effects, and planning future fundraising rounds. By utilizing this tool, startups and businesses can ensure accuracy and transparency in their equity management, which is crucial for maintaining investor confidence and making informed strategic decisions. Download the template today to simplify your cap table management and stay on top of your company’s financial landscape.
You might also like:
- 10 Main Elements of a Business Plan
- How to Build a Capitalization Table
- How to Make a Startup Financial Plan for Fundraising?
- 10 Tips to Develop a First Class Business Valuation Report
- Finding the Balance in Your Optimal Capital Structure
- How to Secure Seed Financing?
- How to Use Inflation Projection to Your Advantage
- Top-Down vs. Bottom-Up Financial Planning: What’s the Difference?
- Definition, Uses, Contents and Templates
- Financial Ratios Analysis and Its Importance
- Finding Fair Market Value: A Quick Guide to Real Estate Valuation
- Pros and Cons of Equity Financing
- How to Calculate Net Present Value (NPV)?
- Business Valuation Service
- Financial Modeling for Startups and Small Businesses
- Cash Flow Analysis in Excel
- How to Calculate Annual Recurring (ARR) Revenue for Sustainable Growth
- Cost per Click (CPC)
- Why Do You Need a Financial Model?
Tags: funding sources