
0 ITEMS

Comprehensive Financial Model for Startups – Dynamic Financial Projections for up to 8 Years
Highly Dynamic and Easy-to-Navigate Excel Financial Projections Model that allows for up to 8 Years Rolling Projections. Ideal for any Startup operating in most industries.


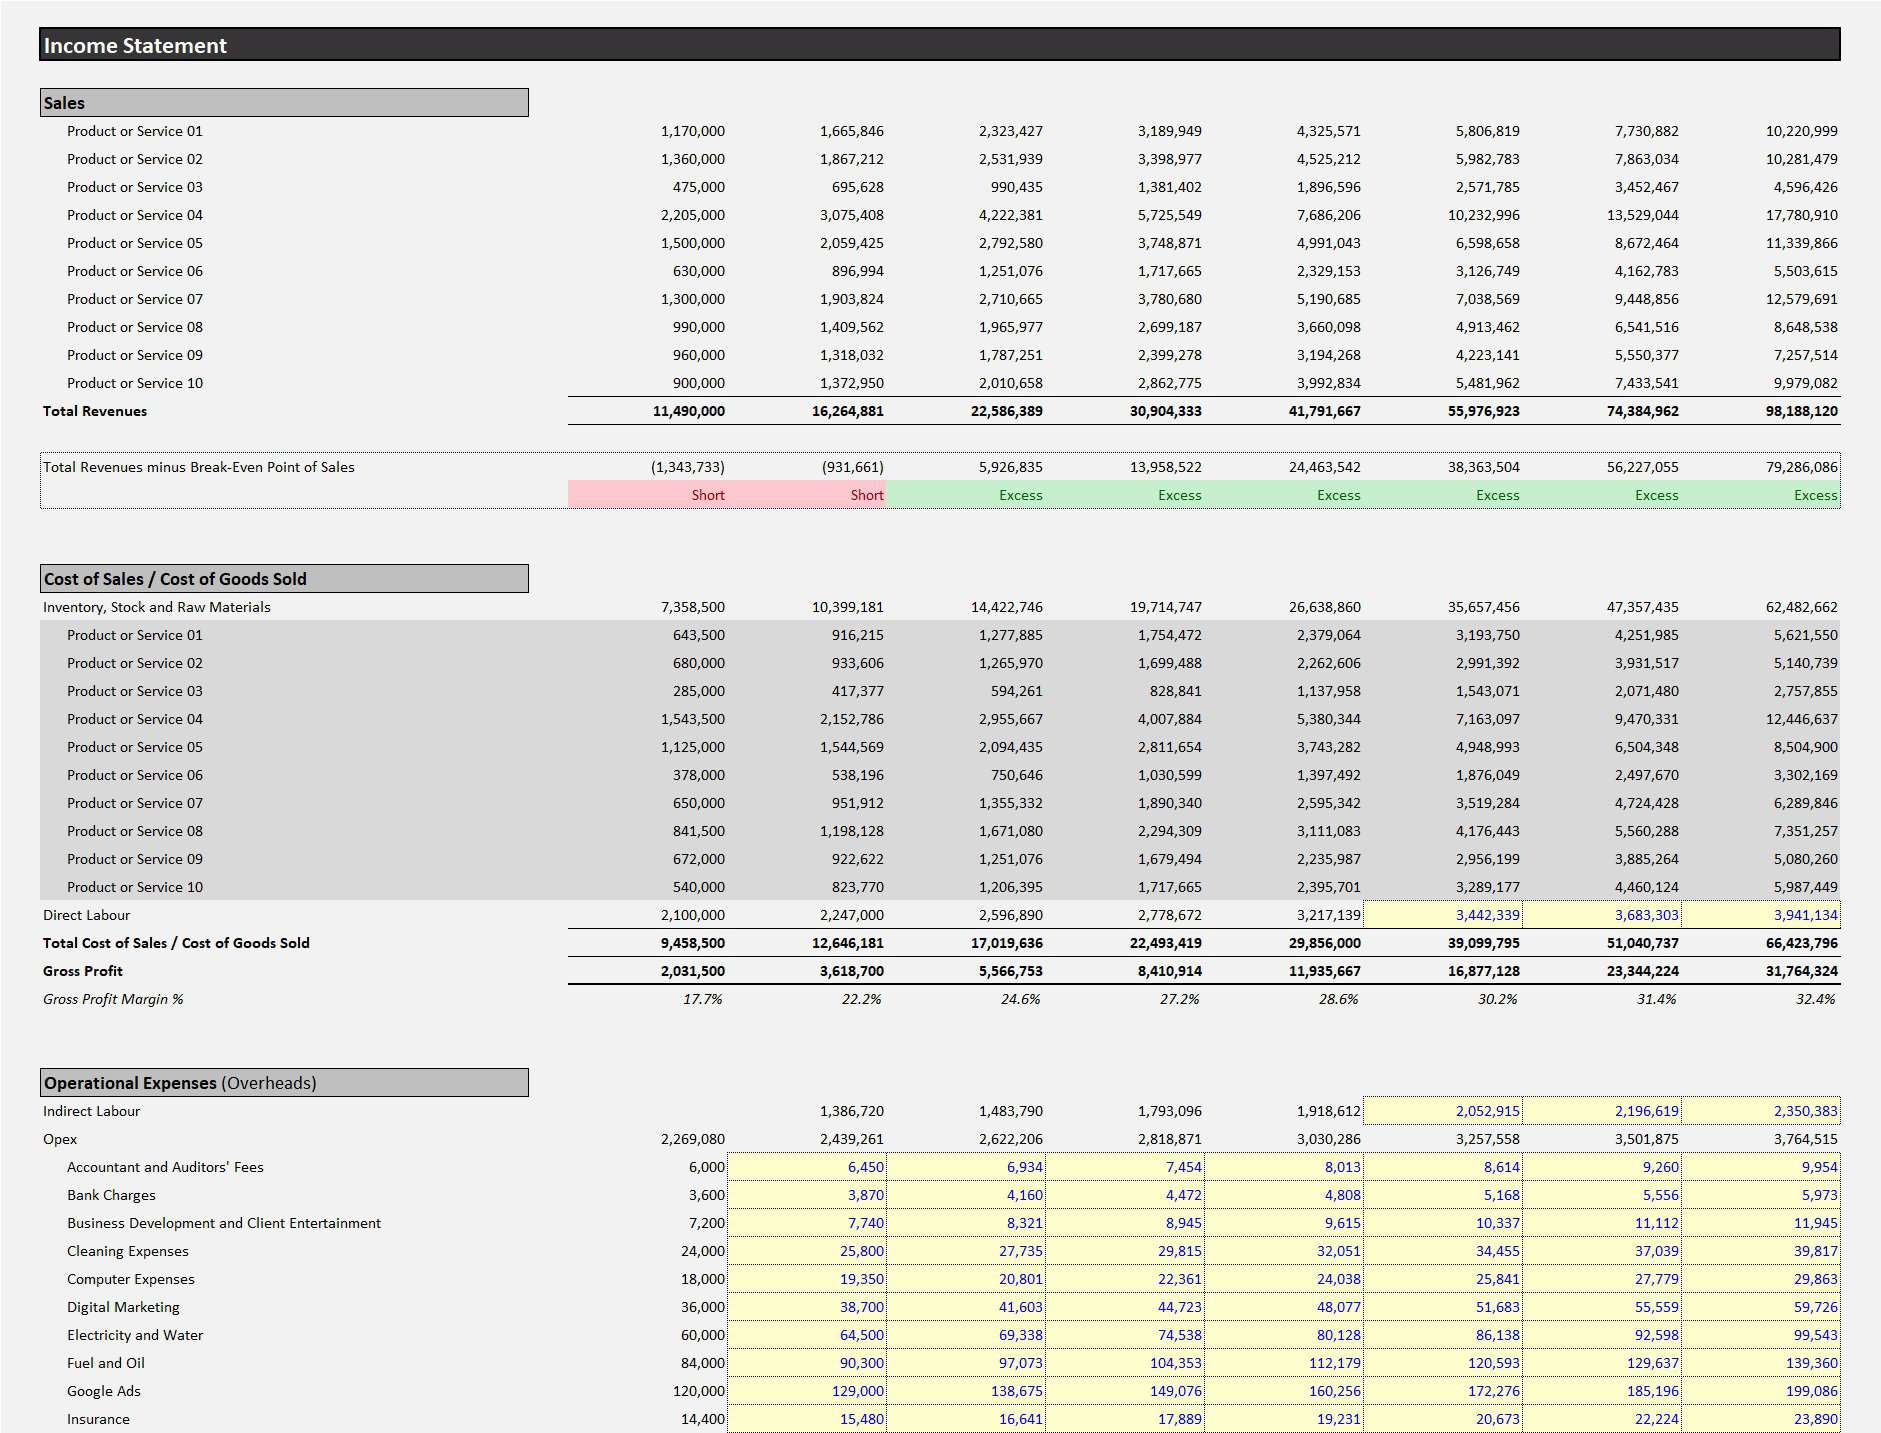
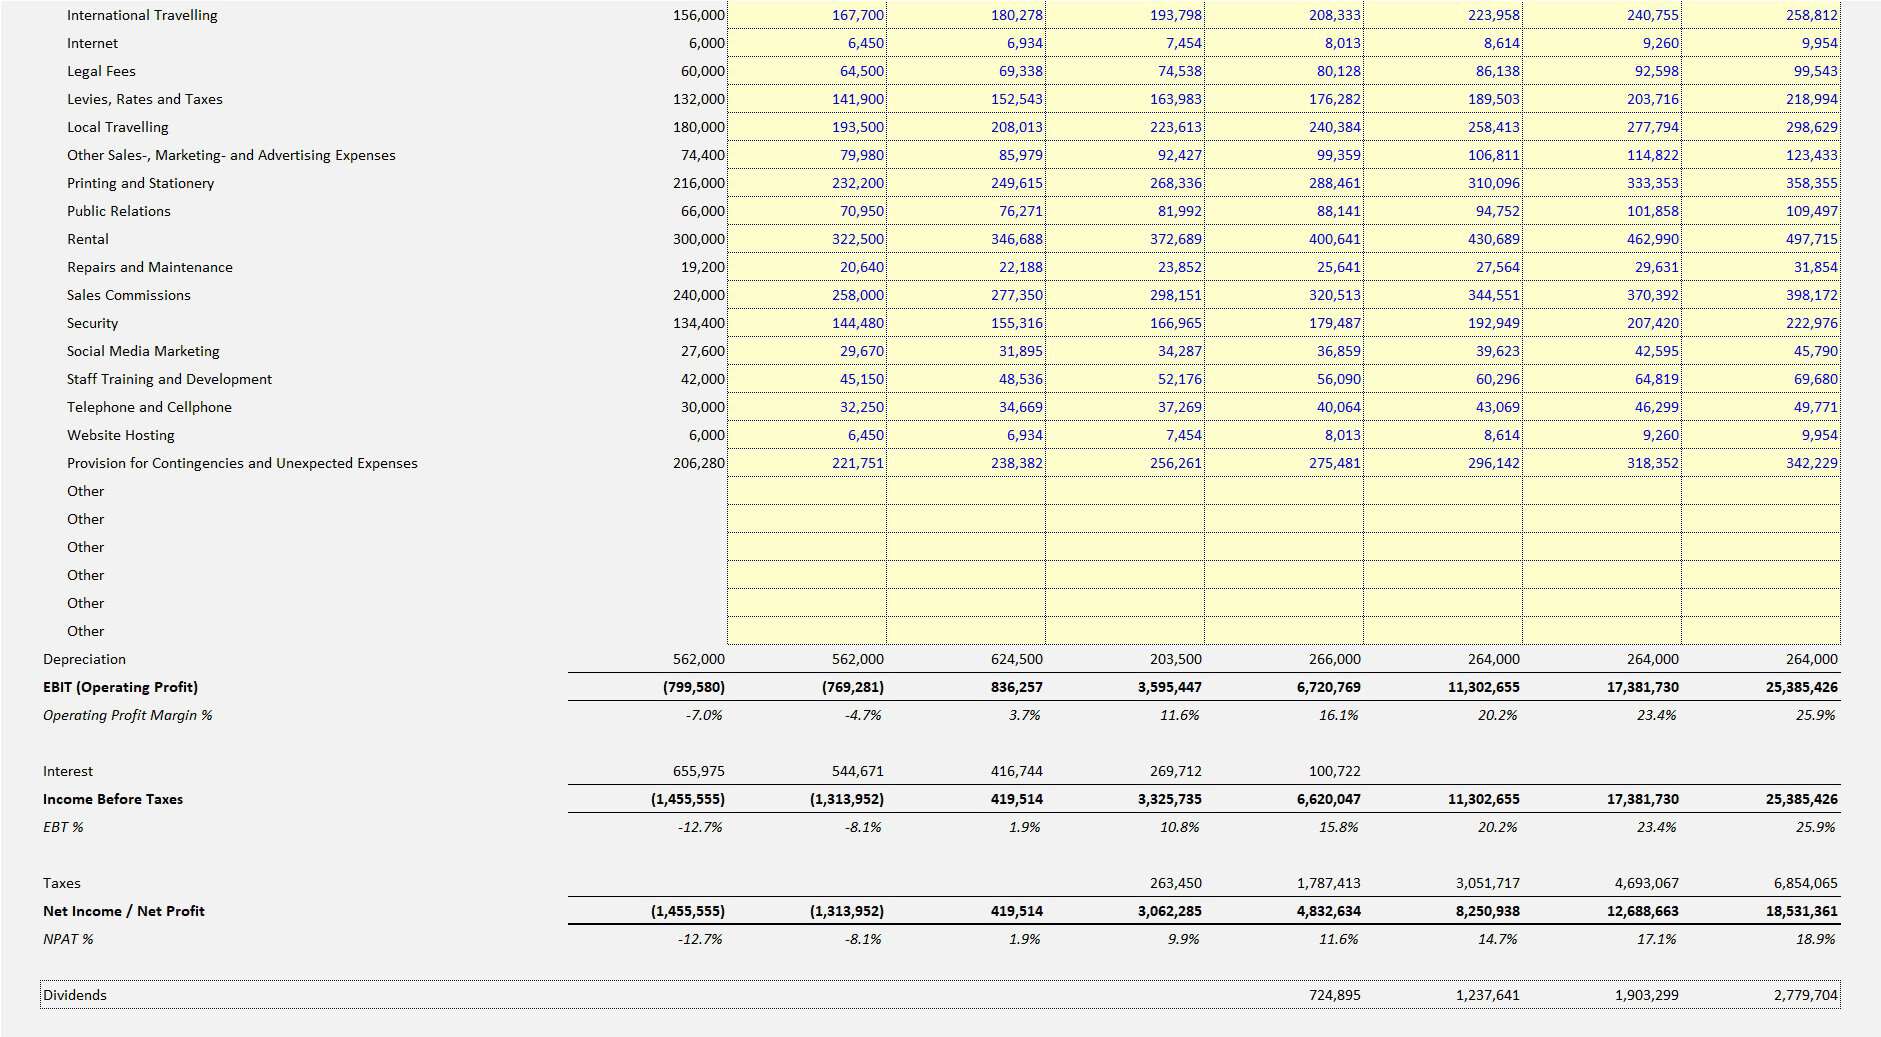


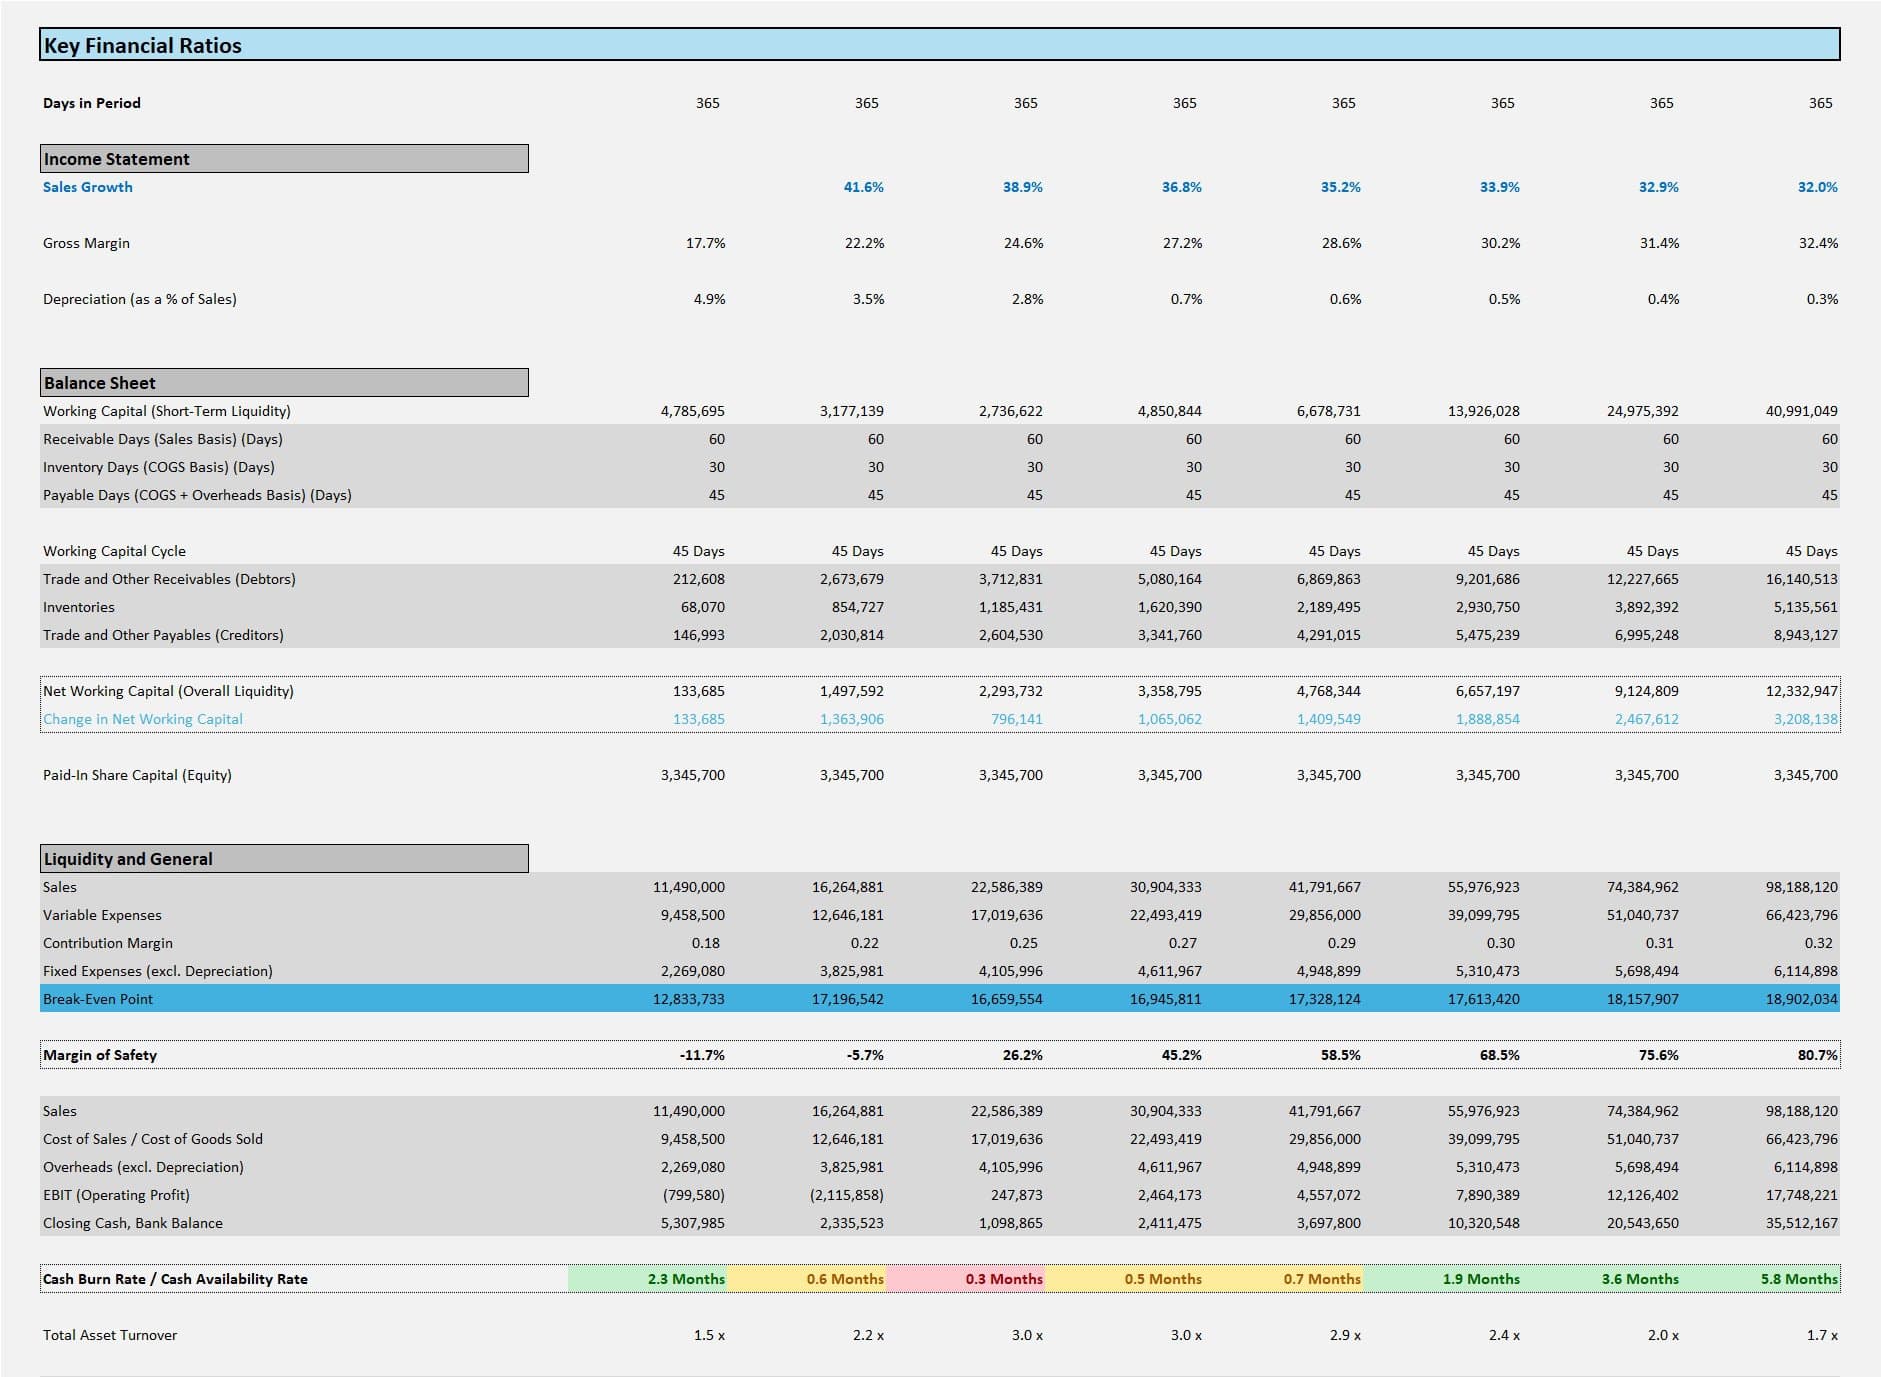


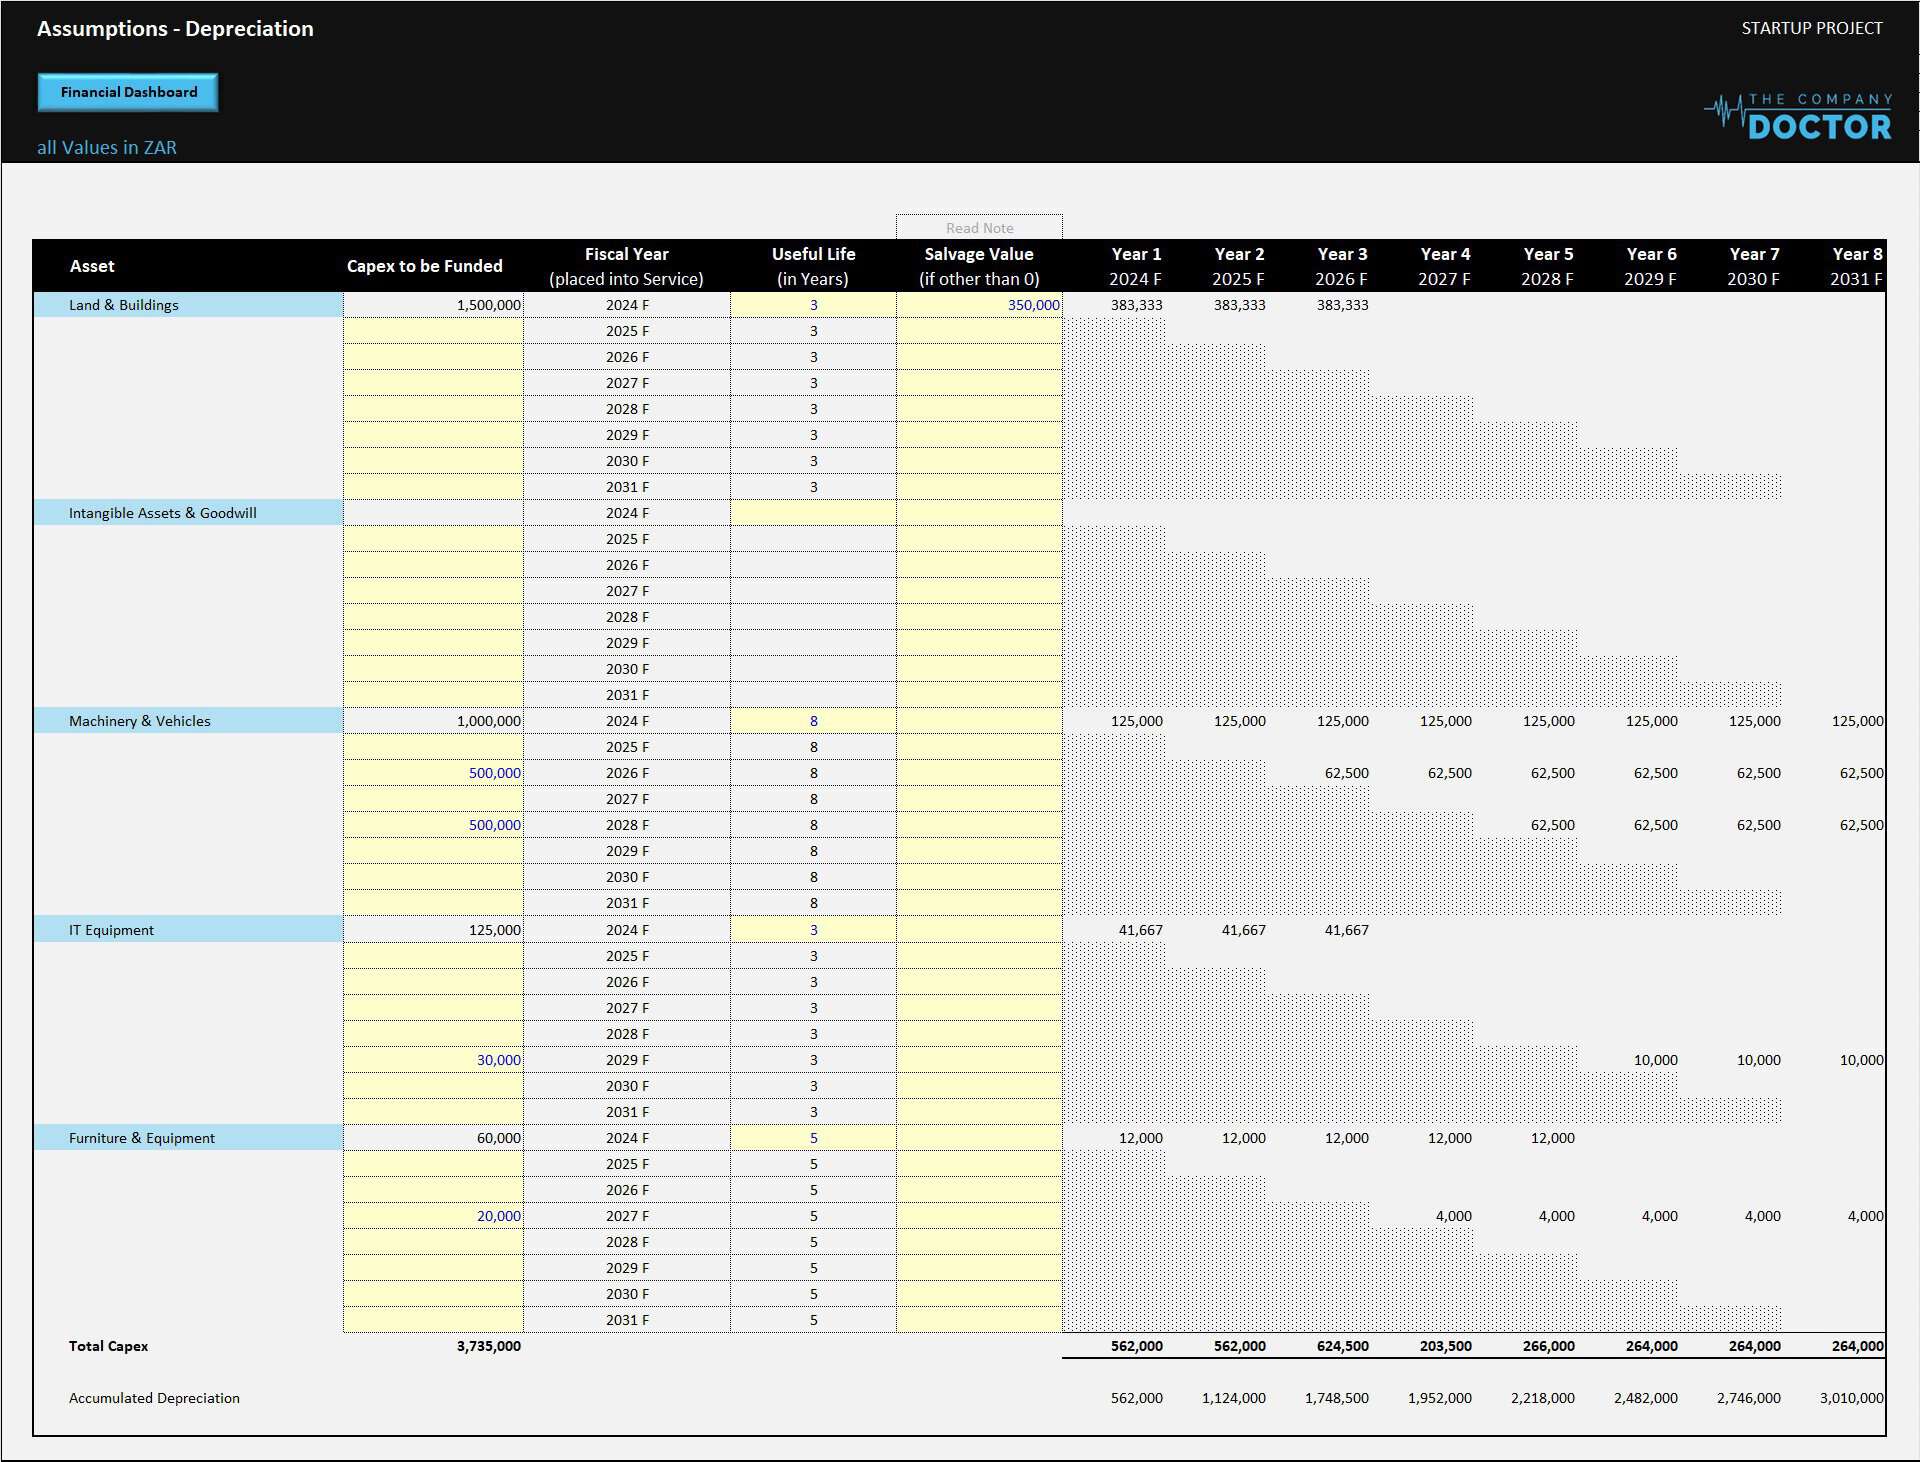


Overview of our Startup Financial Projections Model
Thank you for considering our Startup Financial Projections Model for your startup company. This comprehensive tool has been meticulously designed to provide a clear and dynamic overview of your company’s financial future, empowering you to make informed decisions and drive sustainable growth.
Our highly versatile and user-friendly Excel model allows for preparing up to 8-year rolling 3-statement (Income Statement, Balance Sheet and Cash flow Statement) financial projection. The user can easily select (“Toggle”) between 3 to 8 Years of forecasts, with all returns, ratios, etc., automatically updated easily.
Any Startup Business or Project can use this model across most industries.
Sheet 1 ― Dashboard and Annual Financial Projections
The Dashboard serves as the central hub of the Financial Projections Model, offering an immediate snapshot of crucial financial information and projections. It provides a user-friendly interface with intuitive toggles and input fields, allowing seamless navigation and customization.
- Projection Period: One of the key features of the Dashboard is the flexibility to toggle between different projection periods, ranging from 3 to 8 years. This empowers users to tailor the projections according to their unique business needs and strategic objectives.
- General Assumptions: The Dashboard begins by capturing essential general assumptions, including the model’s starting year and month, the company or project name, and the primary currency. Moreover, inflation rates for both the local context and global headline inflation are incorporated to ensure accuracy in forecasting.
- Funding Assumptions: Understanding the critical role of funding in startup ventures, the Dashboard facilitates inputting key funding assumptions. This includes detailing the equity and debt portions of the capital structure and factors such as current lending rates, expected interest rates, and the cost of capital.
- Operational Assumptions: The Dashboard, tailored to accommodate diverse business models, allows users to input operational assumptions such as business type, products/services, and production/manufacturing details. Whether your business operates with scalable production volumes or fixed capacities, the model adapts to reflect the nuances of your operations accurately.
- Financial Calculations: The Dashboard automates the complex financial calculations for the 3 Primary Financial Statements, i.e., the income statement, balance sheet, and cash flow statement. Integrating inputs and formulas ensures accuracy and efficiency in projecting financial performance over the selected period.
- Financial Ratios: In addition to generating financial statements, the Dashboard computes key financial ratios automatically. These include liquidity, profitability, and efficiency ratios, providing users with valuable insights into the business’s financial health and performance.
- Graphical Representation: To enhance data visualization and interpretation, the Dashboard includes dynamic graphs visually representing various financial metrics. These graphs offer an intuitive way to track trends, identify patterns, and communicate financial insights effectively.
The Dashboard and Annual Financial Projections sheet is the cornerstone of the Financial Projections Model, providing users with a comprehensive overview of their business’s financial outlook and performance. Its user-friendly interface, robust calculations, and graphical representation equip entrepreneurs and stakeholders with the tools to make informed decisions and drive sustainable growth. In conclusion, our Financial Projections Model offers a comprehensive suite of features designed to support strategic decision-making and drive business success. Whether you’re seeking funding, planning for growth, or evaluating performance, this tool equips you with the insights and clarity needed to navigate the dynamic landscape of entrepreneurship. We are confident this model will be an invaluable asset to your business journey.
Continuing our exploration of the Financial Projections Model, let’s delve into the details of Sheets 2 and 3, which play pivotal roles in providing detailed financial statements for the first year, accounting for seasonality, and calculating alternate rates of return, respectively.
Sheet 2 ― Financial Statements with Seasonality Adjustment
Sheet 2 of the model is dedicated to providing comprehensive financial statements for the first year, broken down into 12 monthly periods. Its dynamic nature sets this sheet apart, allowing users to adjust for seasonality factors that may influence revenue, expenses, and other financial metrics.
Key Features:
- Monthly Breakdown: Each financial statement—income statement, balance sheet, and cash flow statement—is presented monthly, providing granular insights into the business’s financial performance throughout the year.
- Seasonality Adjustment: The model recognizes that many businesses experience fluctuations in revenue and expenses due to seasonal variations. It enables users to input seasonality factors, which ensures that the financial projections accurately reflect the anticipated peaks and troughs in business activity.
- Dynamic Formulas: The calculations in Sheet 2 are driven by dynamic formulas that automatically update based on user inputs and adjustments. This ensures accuracy and efficiency in generating financial statements tailored to the business’s needs.
- Integrated Data: Sheet 2 seamlessly integrates with other sheets in the model, ensuring consistency and coherence across all financial projections. Changes made in one sheet automatically propagate to others, providing a holistic view of the business’s financial position.
Sheet 3 ― Internal Rate of Return Calculation
Sheet 3 of the model is dedicated to computing the internal rate of return, providing valuable insights into the financial viability and attractiveness of the investment opportunity. It calculates critical metrics such as Free Cash Flow Forecast, Unlevered Free Cash Flows to the Firm (FCFF), Levered Free Cash Flows to Equity (FCFE), and Internal Rate of Return (IRR).
Key Features:
- Free Cash Flow Forecast: The model generates a comprehensive forecast of free cash flows, considering various revenue streams, operating expenses, and capital expenditures. This forecast serves as the basis for further calculations.
- Unlevered FCFF: Unlevered Free Cash Flows to the Firm (FCFF) represent the cash flows available to all capital providers, including debt and equity holders, before accounting for the effects of leverage.
- Levered FCFE: Levered Free Cash Flows to Equity (FCFE) reflects the cash flows available to equity holders after accounting for the effects of debt financing, including interest payments and principal repayments.
- IRR Calculation: The model computes the Internal Rate of Return (IRR), a key metric used to evaluate the profitability of an investment. IRR represents the discount rate at which the net present value of cash flows equals zero, indicating the rate of return generated by the investment.
In summary, Sheets 2 and 3 of the Financial Projections Model provide detailed financial statements for the first year, accounting for seasonality and calculating alternate rates of return, respectively. These sheets empower users to make informed decisions by offering granular insights into their business venture’s financial performance and viability.
Continuing our exploration of the Financial Projections Model, let’s delve into the details of Sheets 4 through 8, which serve as crucial Master Input sheets. These sheets capture essential financial and operational information, enabling comprehensive analysis and projection of the business’s financial performance.
Sheet 4 ― Funding Breakdown
Sheet 4, the Funding Breakdown sheet, provides a detailed breakdown of funding sources across various asset types, working capital requirements, and expenses. It allows users to allocate funding to different categories, ensuring transparency and accuracy in financial planning.
Sheets 5 & 6 ― Depreciation and Labour
Sheet 5, the Depreciation sheet, and Sheet 6, the Labour sheet, allow users to input detailed information regarding depreciation schedules and labour expenses. They accommodate more than 30 job categories, enabling granular analysis of labour costs and workforce planning.
Sheet 7 ― Monthly Operational Expenses
Sheet 7, the Monthly Operational Expenses sheet, provides a platform for capturing detailed monthly operational expenses. With the ability to input more than 30 rows of expenses, users can accurately track and forecast monthly expenditures across various categories.
In summary, Sheets 4 through 7 of the Financial Projections Model serve as essential Master Input sheets, capturing crucial details related to funding breakdown, depreciation, labour, and monthly operational expenses. These sheets provide users the tools and flexibility to conduct detailed financial analysis and projection, empowering informed decision-making and strategic planning.
In the final stretch of our exploration of the Financial Projections Model, let’s uncover the details of Sheets 8 and 9, which provide essential information regarding new loans/debt repayment schedules. These sheets offer insights into debt financing scenarios, including repayment schedules with or without a moratorium period, ensuring comprehensive financial planning and analysis.
Sheet 8 ― New Loans/Debt Repayment Schedule (Without Moratorium)
Sheet 8, the New Loans/Debt Repayment Schedule without Moratorium, offers a detailed breakdown of principal and interest payments for new loans or debt financing arrangements. It allows users to visualize and understand the financial implications of debt financing without any repayment holiday.
Sheet 9 ― New Loans/Debt Repayment Schedule (With Moratorium)
Sheet 9, the New Loans/Debt Repayment Schedule with Moratorium, extends the functionality of Sheet 8 by incorporating the option for a moratorium period of up to 5 years. This feature allows users to explore debt financing scenarios with a repayment holiday, providing additional flexibility in financial planning.
In summary, Sheets 8 and 9 of the Financial Projections Model provide valuable insights into debt financing arrangements, including repayment schedules with or without a moratorium period. These sheets empower users to make informed decisions regarding debt financing options, ensuring robust financial planning and analysis for the company’s future growth and sustainability.
Similar ProductsOther customers were also interested in...



 eFinancialModels
Electric Vehicle (EV) Charging Station Financial M...
With this comprehensive 5- or 10-year monthly tool, investors can assess the viability of setting up... Read more

Financial Model for Mobile App | Mobile App Busine...
The Mobile App Financial Plan Template in Excel allows you to develop financial projections when lau... Read more

 HenrySheykin
Food Truck Financial Model Excel Template
The Food Truck Financial Model helps entrepreneurs, founders, business owners, consultants, and anal... Read more

Green Hydrogen Production from Wind Energy Financi...
The Green Hydrogen from Wind Financial Model aims to comprehensively forecast a horizon of 40 years ... Read more

Simple Mutual Non-Disclosure Agreement Template
Protect your business secrets with ease using our Simple Mutual Non-Disclosure Agreement Template. S... Read more

Solar Energy Financial Model
The Solar Energy Financial Model Spreadsheet Template in Excel assists you in preparing a sophistica... Read more

 Peter Graf
The Customer-Centric Financial Model for Restauran...
Starting a restaurant without a financial plan is like driving a car blindfolded. You wouldn´t do i... Read more
You must log in to submit a review.