
0 ITEMS

Event Planner Financial Model Excel Template
The Event Planner Financial Model helps users turn an event planning business idea into a structured, editable financial forecast. Instead of relying on a generic spreadsheet, this model is built around the numbers that matter for event planners, including bookings, client deposits, planning fees, vendor costs, staffing needs, revenue assumptions, startup costs, operating expenses, cash flow, and profitability. It gives entrepreneurs and business owners a practical way to estimate how the business may perform before launching, expanding, hiring, or presenting the concept to lenders and investors. This financial model template is designed for event planning startups, wedding planners, corporate event planners, private event coordinators, consultants, analysts, founders, and anyone preparing a business plan or funding document. Users can adjust assumptions for service mix, hourly rates, event volume, average project size, marketing spend, commissions, payroll, vendor-related costs, and other operating drivers. The model helps connect day-to-day business assumptions with financial outcomes, making it easier to understand whether pricing, staffing, and sales targets are realistic. The template supports financial planning by organizing the key outputs decision-makers need, including revenue forecasts, expense projections, profit and loss summaries, cash flow forecasting, return metrics, and break-even analysis. It also includes scenario planning so users can compare low, base, and high cases and see how changes in bookings, pricing, costs, or customer acquisition affect margins and cash runway. This is especially useful for event planners because revenue can vary by project type, seasonality, client mix, and the level of service provided. With a professional structure and editable assumptions, the Event Planner Financial Model saves time while giving users control over their forecast. It can be used to plan startup funding requirements, review operating budgets, test growth strategies, prepare investor-ready outputs, and make better decisions before committing resources. Whether the goal is to launch a boutique wedding planning company, grow a corporate event planning agency, or evaluate a new service line, this financial model template provides a clear framework for turning assumptions into actionable financial insight.


Financial Model Overview
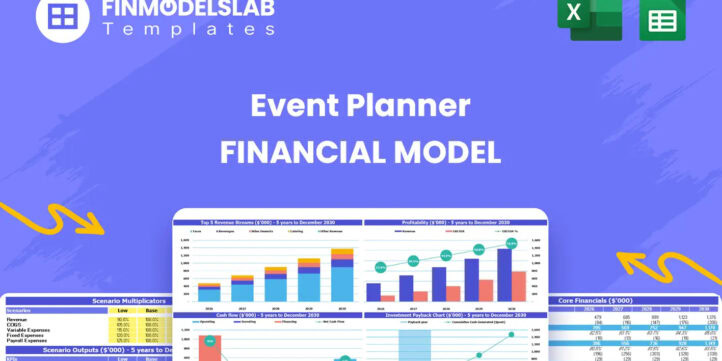
The Event Planner Financial Model is a ready-to-use financial model template designed specifically for event planning businesses, including wedding planning, private event coordination, corporate event planning, and a la carte consulting services. It helps users organize the financial logic behind an event planning company by connecting bookings, billable hours, planning fees, client deposits, vendor costs, staffing, marketing, startup investment, operating expenses, cash flow, and profitability in one structured workbook. Instead of starting from a blank spreadsheet, entrepreneurs, founders, consultants, analysts, and business owners can work from a professional model that is already tailored to the way an event planning business earns revenue and manages costs. The template is useful for launch planning, funding preparation, internal budgeting, business plan development, lender discussions, investor presentations, and ongoing decision-making because it turns assumptions into clear financial outputs that can be reviewed, adjusted, and shared.
All-in-one Dashboard
The all-in-one dashboard gives users a central view of the core inputs and core outputs of the Event Planner Financial Model. This section is designed to bring the most important planning assumptions and financial results into one place, making it easier to understand the overall performance of the business without moving through every worksheet. Users can review high-level assumptions such as event volume, average hourly rates, service mix, operating costs, payroll, startup investment, and growth expectations, then see how those assumptions flow into projected revenue, profitability, cash flow, margins, and key performance indicators. For an event planning business, this is especially valuable because management decisions often depend on several moving parts at once, including the number of weddings booked, corporate event contracts secured, consulting hours sold, deposits collected, and vendor or staffing costs incurred. The dashboard helps users quickly identify whether the plan is financially balanced, whether projected revenue can support expenses, and whether the business has enough cash to operate comfortably. It is also useful for presentations because it summarizes the financial model in a format that can be understood by founders, partners, lenders, advisors, or investors who need a fast but meaningful view of the business plan.
Low Base High Scenario Analysis
The low, base, and high scenario analysis section helps users compare different versions of the financial forecast by adjusting the assumptions that have the greatest impact on performance. In an event planning business, outcomes can vary widely depending on booking volume, client budgets, hourly rates, sales conversion, marketing efficiency, staff utilization, vendor cost exposure, and customer acquisition cost. This component allows users to create a conservative case, an expected case, and an upside case so they can understand how the business may perform under different market conditions. For example, a low scenario may assume fewer signed contracts, lower billable hours per event, slower growth in corporate clients, or higher marketing costs, while a high scenario may assume stronger demand, better pricing power, and more efficient operations. The model then shows how these changes affect revenue, gross margin, EBITDA, net profit, cash flow, payback, and funding needs. This is useful for decision-making because it prevents the business plan from depending on only one optimistic forecast. It helps founders prepare for uncertainty, set realistic targets, evaluate risk, and demonstrate to stakeholders that they have considered multiple possible outcomes before committing capital or pursuing growth.
Professional Charts
The professional charts section converts the financial model’s calculations into visual reports that are easier to interpret, present, and discuss. Event planning financial forecasts can include many connected assumptions, such as bookings by service type, billable hours, revenue growth, staffing costs, marketing spend, operating expenses, cash balances, margins, and profit trends. Charts help simplify this information by showing patterns over time and highlighting the relationship between growth and financial performance. This component may include visualizations for revenue by year, revenue by service category, expense trends, EBITDA growth, cash flow movement, break-even timing, and profitability margins. For business planning and funding discussions, these visuals help users communicate the story behind the numbers in a more accessible way. A lender may want to see whether cash flow remains positive, while an investor may focus on growth trajectory and margin improvement. A founder may use the charts to compare strategic options, such as increasing corporate event sales, changing hourly rates, or adding consulting packages. Because the charts are connected to the assumptions in the model, updates to inputs can automatically refresh the visual outputs, making this section useful for presentations, internal planning meetings, and ongoing performance tracking.
ROE Components and DuPont Analysis
The ROE components and DuPont analysis section helps users evaluate the financial efficiency of the event planning business by breaking return on equity into the underlying drivers that create or reduce value. Instead of looking only at profit, this component examines how profitability, asset efficiency, and leverage contribute to overall returns. Inputs may include net income, revenue, total assets, equity investment, debt assumptions, operating margins, and balance sheet figures generated by the model. The output helps users understand whether returns are being driven by strong margins, efficient use of assets, or capital structure decisions. For an event planning company, this can be especially useful because the business may not require heavy physical assets compared with other industries, but it still needs careful management of startup costs, working capital, deposits, vendor payments, staffing, and marketing investment. DuPont analysis can help investors and owners determine whether the business model is generating attractive returns from its equity base and whether growth is improving or weakening financial efficiency. This section is also helpful for strategic planning because it highlights where improvement may be needed, such as increasing pricing, improving staff productivity, reducing overhead, managing receivables more effectively, or avoiding unnecessary capital spending. By breaking return metrics into components, the model gives users a deeper view of performance than a simple profit forecast alone.
Revenue Inputs
The revenue inputs section is where users build the commercial assumptions behind the Event Planner Financial Model. This component is tailored to how event planners generate income, with inputs that may include service categories, number of clients, bookings per month, average billable hours, hourly rates, planning fees, package pricing, sales mix, customer growth, and pricing increases over time. For example, a user may model wedding and private event planning, corporate event planning, and a la carte consulting as separate revenue streams, each with its own pricing, client volume, and utilization assumptions. This structure is important because not every event service contributes the same amount of revenue or margin. Corporate events may have higher hourly rates, weddings may require more planning hours, and consulting services may provide flexible income without full project management obligations. The revenue inputs section helps users test how different service mixes affect total sales and profitability. It also supports more realistic forecasting because revenue is not entered as a single flat number but built from operational drivers that can be explained and defended. This is useful for business plans, investor discussions, and internal budgeting because stakeholders can see exactly what must happen in terms of bookings, pricing, and workload for the forecast to be achieved.
Bank-Ready Reports
The bank-ready reports section provides lender-friendly financial outputs that help users present the event planning business in a clear and professional format. Banks, lenders, and financing partners usually want to understand whether a business can generate enough revenue, profit, and cash flow to support its obligations. This component organizes the financial projections into reports that may include profit and loss statements, cash flow forecasts, balance sheet summaries, debt service capacity, funding needs, operating expense breakdowns, and key financial metrics. For an event planner seeking startup funding or expansion capital, these reports help translate the business plan into the type of financial information lenders expect to review. The model can show how revenue from planning fees, consulting services, and corporate events supports fixed costs, payroll, marketing spend, vendor-related expenses, and loan payments. It can also help identify whether additional working capital is required during slower booking periods or before client deposits are collected. The bank-ready structure saves time because users do not need to manually rebuild financial statements from separate assumptions. It also improves credibility by presenting outputs in an organized format that supports funding conversations, credit applications, and stakeholder reviews.
Revenue Breakdown
The revenue breakdown section gives users a detailed view of the revenue streams inside the event planning business. Rather than showing only total sales, this component separates income by service category so users can understand which activities drive the forecast. Revenue may be broken down across wedding and private planning, corporate event planning, a la carte consulting, planning packages, hourly services, retainers, or other event-related offerings depending on how the user customizes the model. Inputs may include number of projects, average hours per project, average fee per client, rate per hour, growth rate, client mix, and seasonality assumptions. Outputs may show monthly and annual revenue by stream, each stream’s share of total sales, and how the mix changes over the forecast period. This is useful for strategic planning because event planning businesses often have different margins and workload requirements by service type. A large corporate event may generate more revenue but require more staff coordination, while consulting may be easier to deliver but smaller in total value. The revenue breakdown helps users decide where to focus marketing, how to price services, whether to prioritize higher-margin clients, and how many events must be booked to reach revenue targets. It also makes the financial forecast easier to explain in business plans and investor presentations because the revenue logic is visible and detailed.
KPI Dashboard
The KPI dashboard section tracks performance metrics and benchmarks that help users evaluate whether the event planning business is operating efficiently. Key performance indicators may include revenue growth, gross margin, EBITDA margin, net profit margin, cash balance, customer acquisition cost, average revenue per event, bookings by service type, utilization, payback period, return on equity, and break-even timing. For an event planning company, KPIs are important because financial success depends not only on total revenue but also on the quality of that revenue, the cost of acquiring clients, the efficiency of staffing, the ability to control vendor-related costs, and the timing of cash collections. This component helps users compare projected performance against targets or industry benchmarks, making it easier to see where the business is strong and where assumptions may need revision. For example, if marketing spend is rising faster than booked revenue, the user can revisit customer acquisition assumptions. If revenue grows but cash flow weakens, the user can review deposit timing, payment terms, payroll, or working capital needs. The KPI dashboard is useful for founders, managers, consultants, and analysts because it turns the financial model into an ongoing management tool, not just a one-time forecast. It also supports stakeholder communication by presenting performance indicators in a concise and decision-focused format.
Break-Even Analysis
The break-even analysis section helps users identify when the event planning business is expected to become profitable and what level of revenue is required to cover its cost structure. This component uses assumptions from the revenue forecast, cost of goods sold, payroll, marketing, commissions, fixed overhead, and other operating expenses to calculate the point at which the business moves from loss to profit. For an event planner, break-even timing is especially important because startup costs may be incurred before a full client pipeline is built, while revenue may depend on deposits, signed contracts, and the timing of event delivery. The model can help users understand how many events, billable hours, or clients are needed to cover monthly expenses and how changes in pricing, service mix, or cost control affect the break-even point. If the user increases corporate event pricing, reduces fixed overhead, improves sales conversion, or secures anchor clients before launch, the break-even date may improve. If customer acquisition costs rise or bookings are delayed, break-even may take longer. This section is useful for funding preparation because lenders and investors often want to know how quickly the business can become self-sustaining. It is also useful for founders because it provides a practical target for sales planning, budgeting, and cash reserve decisions.
Startup Cost and CAPEX Planning
The startup cost and CAPEX planning section organizes the initial investment required to launch or expand an event planning business. This component may include office setup and furnishings, branding, website development, initial IT equipment, software, legal setup, licensing, insurance deposits, pre-launch marketing, professional services, training, working capital, and other one-time costs needed before the business reaches stable operations. Users can edit each cost category to match their specific launch plan, whether they are starting as a lean home-based event planner, opening a small office, building a premium event planning brand, or expanding an established agency. The section helps calculate total funding requirements and shows when startup expenses are expected to occur, which is useful for managing cash flow and avoiding undercapitalization.
Similar ProductsOther customers were also interested in...

 HenrySheykin
Law Firm Financial Model Excel Template
The Law Firm Financial Model Template helps users turn a legal practice concept into a structured fi... Read more
Business Brokerage Financial Model Excel Template
The Business Brokerage Financial Model helps entrepreneurs, brokerage owners, consultants, analysts,... Read more
Architecture Firm Financial Model Excel Template
The Architectural Firm Financial Model Template helps founders, architecture practice owners, consul... Read more
Financial Advisors Agency Financial Model Excel Te...
The Financial Advisor Financial Model is a ready-to-use financial model template built for planning,... Read more
Notary Financial Model Excel Template
The Notary Service Financial Model helps entrepreneurs, business owners, consultants, analysts, and ... Read more
Legal Services Financial Model Excel Template
The Legal Services Financial Model Financial Model Template helps entrepreneurs, law firm founders, ... Read more
Corporate Trainer Financial Model Excel Template
The Corporate Training Financial Model helps users turn a professional development or corporate lear... Read more
Attorney Employment Agency Financial Model Excel T...
The Recruiting Agency Financial Model helps founders, agency owners, consultants, and analysts build... Read more

Wedding Planner Agency Financial Model Excel Templ...
The Wedding Planning Agency Financial Model helps users turn a wedding planning business idea into a... Read more
Travel Agency Financial Model Excel Template
The Travel Agency Financial Model helps entrepreneurs, founders, consultants, analysts, and business... Read more
You must log in to submit a review.