
0 ITEMS

Accounting Software Financial Model Excel Template
The Accounting Software Financial Model helps founders, entrepreneurs, consultants, analysts, and business planners evaluate the commercial and financial potential of an accounting software business before launch, fundraising, or expansion. Built around the economics of a software business, it gives users a structured way to forecast subscription revenue, setup fees, usage-based income, startup costs, operating expenses, payroll, cash flow, profitability, and funding requirements over a multi-year planning period. Instead of starting with a blank spreadsheet, users can work from a ready-to-use financial model template designed around the main assumptions investors and stakeholders expect to review. This template is especially useful for SaaS founders, accounting technology startups, business owners, finance teams, and consultants preparing business plans, pitch decks, loan applications, internal budgets, or investor materials. It allows users to enter and adjust assumptions such as pricing tiers, customer growth, conversion rates, churn, customer acquisition costs, transaction volume, cloud hosting costs, staffing plans, and general operating expenses. As those inputs change, the model helps translate business strategy into projected revenue, cost structure, profit margins, cash movement, and long-term financial performance. The Accounting Software Financial Model also supports better decision-making by helping users understand how the business may perform under different operating conditions. It can be used to evaluate whether the planned pricing model is strong enough, whether the business has enough cash runway, how quickly recurring revenue can cover fixed costs, and what level of customer growth may be required to reach break-even. With editable assumptions, scenario planning, dashboard outputs, charts, profitability analysis, and investor-oriented financial summaries, it helps users move beyond rough estimates and build a more credible planning document. For buyers preparing funding documents or strategic plans, the template provides a practical framework for communicating the financial logic of the business. It brings together revenue assumptions, startup investment, operating expenses, payroll planning, cash flow forecasting, profitability tracking, break-even analysis, and performance metrics in one organized model. The result is a flexible planning tool that can be customized for a new accounting software startup, an established software company launching a new product, or a consultant building a financial forecast for a client.
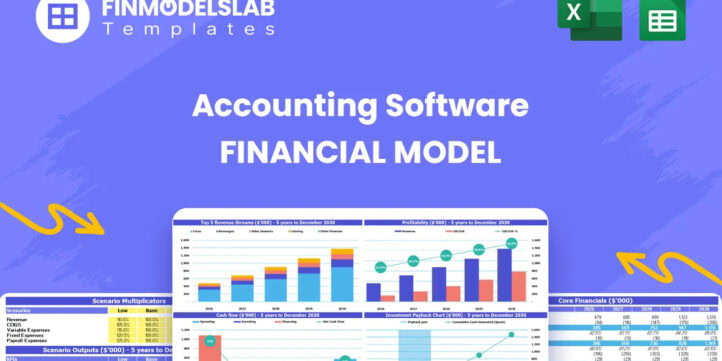


Financial Model Overview
The Accounting Software Financial Model is a ready-to-use financial model template designed to help users plan, forecast, and evaluate an accounting software business with a clear and structured approach. It is built for a business model driven by recurring subscriptions, customer acquisition, pricing tiers, setup fees, transaction-based revenue, software hosting costs, product development, support teams, marketing spend, and scalable operating expenses. For founders, business owners, consultants, analysts, and finance teams, the template provides a practical way to connect commercial assumptions with financial outcomes, so the business can be reviewed before launch, fundraising, lending discussions, or expansion. Users can customize the assumptions to reflect their own pricing strategy, customer mix, growth plan, payroll structure, startup costs, and cost base, while the model turns those inputs into usable forecasts, reports, dashboards, and decision-making outputs. It is useful for preparing investor materials, business plans, internal budgets, and funding documents because it organizes the financial logic of an accounting software company in a professional, editable, and presentation-ready format.
All-in-one Dashboard
The all-in-one dashboard brings the most important inputs and outputs of the Accounting Software Financial Model into one central view, helping users quickly understand the overall financial position of the business without searching through multiple worksheets. This component typically summarizes core assumptions such as pricing tiers, customer growth, revenue streams, cost drivers, payroll, startup investment, and funding inputs, then connects them to key outputs such as revenue, gross profit, EBITDA, cash balance, net income, and return metrics. For an accounting software company, this dashboard is especially useful because many planning decisions depend on the relationship between recurring revenue, acquisition costs, hosting expenses, support costs, and development investment. A founder can use it to see whether the model is producing a credible path from early customer acquisition to scalable profitability, while a consultant or analyst can use it to review whether the plan is balanced before presenting it to stakeholders. The dashboard helps simplify financial planning by turning detailed assumptions into an executive-level summary that supports faster decision-making.
Low, Base, and High Scenario Analysis
The Low, Base, and High scenario analysis component helps users test how the accounting software business may perform under different market and operating conditions. Instead of relying on one fixed forecast, users can compare a conservative case, a realistic base case, and an upside case by adjusting assumptions such as trial-to-paid conversion rates, customer acquisition costs, churn, subscription pricing, customer growth, plan mix, transaction volume, and expense timing. In a lower case, the model may show the effect of slower market adoption, higher customer acquisition costs, or weaker conversion rates on revenue, cash runway, and profitability. In a stronger case, it may show the impact of faster customer growth, improved pricing, or a greater share of higher-tier plans. This component is valuable for business planning and fundraising because investors and lenders often want to know how resilient the business is if performance is weaker than expected. It also helps founders make smarter strategic decisions by identifying which assumptions have the greatest impact on cash flow, funding needs, and the timing of profitability.
Professional Charts
The professional charts component converts the financial forecast into clear visual reports that are useful for presentations, pitch decks, management meetings, and stakeholder updates. Accounting software businesses often have multiple moving parts, including monthly recurring revenue, customer growth, churn, acquisition spend, operating costs, gross margin, EBITDA, and cash balances, so charts make it easier to communicate trends that may be harder to interpret in a table of numbers. This section may include visual summaries of revenue growth, expense trends, profit margins, cash flow movement, customer mix, and funding needs over time. For users preparing investor-ready documents, charts help tell the financial story of the business in a more accessible way, showing how early investment supports customer acquisition, how recurring revenue compounds, and how margins may improve as the software platform scales. The visual outputs can also support internal decision-making by helping users identify peaks, gaps, risks, and inflection points in the forecast. Because the model is editable, the charts update as assumptions change, making them useful for scenario review and ongoing planning.
ROE Components and DuPont Analysis
The ROE components and DuPont analysis section helps users understand the drivers behind return on equity rather than only looking at a single final return figure. For an accounting software business, this is useful because equity returns are influenced by profitability, asset efficiency, capital structure, and the ability to scale revenue without adding costs at the same pace. The DuPont framework can break return on equity into related components such as profit margin, asset turnover, and financial leverage, helping users see whether returns are being driven by operating performance, efficient use of invested capital, or the financing structure of the company. This section may use inputs from the income statement, balance sheet, and investment assumptions to generate return metrics that are easier to interpret. For founders and investors, the value of this component is that it explains why returns improve or weaken over time. If ROE is lower than expected, users can review whether the issue comes from low margins, high startup investment, slow revenue growth, or an inefficient cost structure, then adjust the business plan accordingly.
Revenue Inputs
The revenue inputs section is one of the most important components of the Accounting Software Financial Model because it defines the assumptions that drive sales performance. For an accounting software company, revenue may come from tiered monthly subscriptions, one-time setup fees for larger customers, and transaction-based usage fees tied to payment processing, invoicing, payroll activity, or other platform usage. This section allows users to input pricing for different plans, expected customer counts, conversion rates, plan mix, upgrades, customer acquisition trends, churn assumptions, and usage-based activity. It may also include researched starting assumptions that can be edited to reflect the user’s own go-to-market strategy. The outputs generated from these inputs help calculate monthly recurring revenue, annual recurring revenue, setup revenue, usage revenue, total sales, and growth rates. This component is useful because revenue assumptions are often the foundation of the entire forecast. By making the revenue logic transparent, the model helps users test whether pricing is realistic, whether the customer acquisition plan can support the forecast, and whether the business can generate enough recurring income to cover operating expenses and reach profitability.
Bank-Ready Reports
The bank-ready reports component organizes the financial forecast into lender-friendly outputs that can support loan applications, credit discussions, and formal business planning. While investors may focus heavily on growth potential and equity returns, banks and lenders usually want to see whether the business can generate enough cash flow to cover obligations, maintain liquidity, and operate with a reasonable cost structure. This section may include projected profit and loss statements, cash flow summaries, balance sheet outputs, debt service indicators, funding requirements, and clear financial summaries formatted for review. For an accounting software business, these reports can show how subscription revenue builds over time, how operating costs behave as the customer base grows, and whether the company can maintain positive cash balances after payroll, hosting costs, marketing spend, and product development expenses. The value of this component is that it turns the forecast into a more formal financial package. Users can share the reports with lenders, advisors, partners, or internal stakeholders to support funding conversations and demonstrate that the financial plan has been reviewed in a structured and credible way.
Revenue Breakdown
The revenue breakdown section gives users a detailed view of how total revenue is built across different income streams, customer groups, and pricing levels. In an accounting software business, total revenue is rarely generated from one simple source. A company may have entry-level plans for freelancers or small businesses, mid-tier plans for growing companies, enterprise plans for larger organizations, setup or onboarding fees, and usage-based charges connected to transaction volume. This component separates those streams so users can see which products, tiers, or customer segments are driving the most value. Inputs may include plan pricing, customer counts by tier, monthly growth rates, customer mix changes, setup fee frequency, transaction assumptions, and churn. Outputs may include revenue by stream, percentage contribution by tier, recurring versus non-recurring revenue, and growth trends across categories. This section is useful for strategic planning because it helps users understand whether the business is overly dependent on low-priced plans, whether higher-value tiers are growing as expected, and how changes in customer mix affect margins, cash flow, and investor appeal.
KPI Dashboard
The KPI dashboard tracks the operating and financial metrics that matter most for an accounting software business, giving users a performance benchmark beyond traditional revenue and profit totals. This component may include metrics such as monthly recurring revenue, annual recurring revenue, customer acquisition cost, customer lifetime value, churn rate, conversion rate, average revenue per user, gross margin, EBITDA margin, payback period, cash runway, and customer growth. These KPIs help users understand whether the business model is healthy, scalable, and financially sustainable. For example, a business may be growing revenue but still have a weak outlook if customer acquisition costs are too high, churn is excessive, or payback periods are too long. The KPI dashboard helps identify those issues early by summarizing performance indicators in one place. It is valuable for founders preparing investor updates, consultants validating a business plan, and management teams making operational decisions. By comparing KPI outputs against internal targets or industry benchmarks, users can refine pricing, marketing spend, staffing, and product strategy with a clearer understanding of financial impact.
Startup Costs and Operating Expense Planner
The startup costs and operating expense planner helps users estimate the investment required to launch and run the accounting software business before and after revenue begins to scale. Startup costs may include software development setup, workstations, initial product infrastructure, legal formation, accounting setup, website development, office equipment, licenses, security tools, initial branding, and pre-launch marketing. Operating expenses may include cloud hosting, software subscriptions, customer support, sales and marketing, payroll, contractor costs, insurance, professional services, product development, compliance, and general administration. By separating initial capital needs from recurring monthly expenses, this section helps users understand how much funding is needed to reach launch and how much cash the business may consume during early growth. The outputs can feed into cash flow forecasts, profit and loss projections, and funding requirement calculations. This component is useful for budgeting because software businesses often underestimate the combined cost of product development, customer acquisition, support, and technical infrastructure. A detailed planner helps users avoid unrealistic assumptions and build a more reliable financial plan.
Break-Even and Cash Flow Forecast
The break-even and cash flow forecast component helps users determine when the accounting software business may become self-sustaining and how much liquidity is needed before that point. Break-even analysis compares projected revenue against fixed and variable costs to estimate when the business can cover its ongoing expenses from operations. For an accounting software company, the break-even point may be influenced by subscription pricing, customer growth, churn, support costs, hosting expenses, payroll, marketing efficiency, and gross margin. The cash flow forecast then shows how money moves through the business month by month, including startup investment, revenue receipts, operating expenses, payroll, capital expenditures, financing, and ending cash balances. This is especially important for a recurring revenue business because profitability and cash flow may not move at the same pace, particularly when upfront customer acquisition spending is high. This section helps users identify funding gaps, cash runway, low-balance months, and the point at which recurring revenue begins to support the cost structure. It is useful for founders, lenders, and investors because it clarifies both the timing of profitability and the practical cash required to survive the early stages of growth.
File types:
Excel – Single-User: .xlsx
Excel – Multi-User: .xlsx
Similar ProductsOther customers were also interested in...

 HenrySheykin
CRM Software Financial Model Excel Template
The CRM Software Financial Model is a ready-to-use financial model template designed to help founder... Read more
E-Commerce Software Financial Model Excel Template
The E-Commerce Platform Financial Model Financial Model Template helps founders, entrepreneurs, cons... Read more
Data Analytics Software Financial Model Excel Temp...
The Data Analytics Software Financial Model helps users build a structured financial forecast for a ... Read more
Customer Service Software Financial Model Excel Te...
The Customer Service Software Financial Model helps founders, operators, consultants, and analysts t... Read more
Equipment Rental Subscription Financial Model Exce...
The Equipment Rental Subscription Financial Model helps users turn an equipment-as-a-service busines... Read more
Fresh Flowers Subscription Financial Model Excel T...
The Subscription Box Financial Model Template helps entrepreneurs, founders, analysts, consultants, ... Read more
Procurement Software Financial Model Excel Templat...
The Procurement Software Financial Model helps founders, entrepreneurs, consultants, analysts, and b... Read more
Human Resource Software Financial Model Excel Temp...
The HR Software Financial Model Financial Model Template helps founders, business owners, consultant... Read more

Software Development Financial Model Excel Templat...
The Software Development Financial Model Template helps founders, entrepreneurs, consultants, analys... Read more
SaaS Actuals Opt-In Financial Model Excel Template
The SaaS Business Financial Model helps founders, entrepreneurs, consultants, analysts, and business... Read more
You must log in to submit a review.