
0 ITEMS

Equipment Rental Subscription Financial Model Excel Template
The Equipment Rental Subscription Financial Model helps users turn an equipment-as-a-service business idea into a structured, editable financial forecast. It is designed for entrepreneurs, founders, business owners, consultants, analysts, and planning teams that need to evaluate the economics of a recurring rental model before launching, raising capital, or expanding operations. Instead of starting from a blank spreadsheet, users can work from a ready-to-use framework built around subscription revenue, equipment utilization, startup costs, operating expenses, payroll, cash flow, profitability, and investment planning. This financial model template is especially useful for businesses that rent tools, machinery, contractor equipment, DIY equipment, or specialized assets through monthly plans, setup fees, usage charges, or tiered membership packages. It helps users document the key revenue assumptions behind the model, such as subscriber growth, pricing tiers, churn, customer mix, usage fees, and recurring monthly revenue. It also supports practical budgeting decisions by connecting expected demand with the cost of equipment, delivery, maintenance, staffing, marketing, software, and overhead. The template provides a five-year planning view, giving users a way to understand how the business may perform as subscribers grow and equipment assets become more efficiently used. It can support business plan development, loan applications, investor discussions, internal budgeting, and strategic decision-making by showing how assumptions flow into profit and loss, cash flow, balance sheet, break-even analysis, and profitability outputs. This is valuable for identifying funding needs, reviewing early cash pressure, testing different growth cases, and understanding when the business may become financially sustainable. Built for practical use in Excel and Google Sheets, the model is customizable and structured so users can adapt assumptions to their own market, pricing strategy, rental fleet, operating model, and growth plan. It helps organize financial planning into a clear workflow: enter assumptions, review outputs, compare scenarios, analyze cash flow, and present results in a professional format. For anyone preparing an equipment rental subscription business plan, funding package, or expansion forecast, this template offers a time-saving and decision-focused way to evaluate revenue potential, cost structure, break-even timing, and long-term profitability.
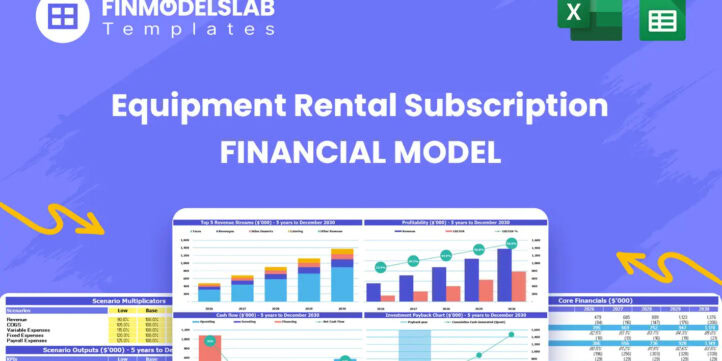


Equipment Rental Subscription Financial Model Overview
The Equipment Rental Subscription Financial Model is a ready-to-use financial model template built for planning, launching, funding, and managing an equipment rental business based on recurring subscriptions. It helps users forecast how a rental fleet, subscription tiers, setup fees, usage charges, operating costs, payroll, financing needs, and profitability may evolve over a five-year period. This type of business can be capital intensive because equipment purchases, delivery assets, warehouse setup, maintenance, staffing, marketing, and software infrastructure often require meaningful investment before recurring revenue reaches scale. The template gives entrepreneurs, founders, business owners, consultants, analysts, and finance teams a structured way to test assumptions, understand cash requirements, evaluate growth scenarios, and prepare professional financial outputs for investors, lenders, partners, or internal decision-makers. By connecting revenue assumptions with expenses, cash flow, balance sheet movement, break-even timing, and visual reporting, the model helps replace guesswork with a practical planning framework tailored to the equipment rental subscription concept.
All-in-One Dashboard
The all-in-one dashboard brings the most important inputs and outputs into a single planning view so users can quickly understand the financial position of the equipment rental subscription business. It is designed to summarize the core drivers of the model, such as pricing assumptions, subscriber growth, subscription mix, revenue streams, major cost categories, startup investment, cash balance, profitability, and financing needs. For a subscription rental business, this type of dashboard is useful because decision-makers need to see both operating performance and capital intensity at the same time. The dashboard can help users review monthly recurring revenue, revenue growth, gross profit, EBITDA, net income, cash flow, and key balance sheet indicators without searching across multiple tabs. It also supports faster decision-making by showing how changes in assumptions affect outputs across the forecast. For example, adjusting subscriber acquisition assumptions, maintenance costs, fleet investment, churn, or pricing can flow through the model and update the dashboard results. This makes the template practical for business planning meetings, investor discussions, internal reviews, and ongoing performance tracking as the business moves from launch to scale.
Low, Base, and High Scenario Analysis
The low, base, and high scenario analysis component helps users compare different versions of the equipment rental subscription forecast under changing market and operating assumptions. A rental subscription business may perform very differently depending on customer acquisition speed, subscription churn, average plan mix, equipment utilization, marketing efficiency, maintenance frequency, delivery costs, and pricing strategy. This section allows users to stress-test the model by reviewing conservative, expected, and optimistic cases in one structured framework. The low scenario can show what happens if growth is slower, customer acquisition costs are higher, churn increases, or asset utilization is weaker than expected. The base scenario can represent the most realistic operating plan, while the high scenario can show the upside if demand is strong, conversion rates improve, and recurring revenue compounds faster. The outputs may include revenue, EBITDA, net profit, cash flow, funding gaps, payback period, and other financial indicators for each case. This is particularly valuable for funding preparation because investors and lenders often want to understand downside risk as well as upside potential. By comparing scenarios, users can make better decisions about launch timing, capital reserves, fleet purchasing, staffing, marketing budgets, and expansion plans.
Professional Charts
The professional charts component converts the financial forecast into visual reports that are easier to review, explain, and present. Equipment rental subscription businesses often involve many moving parts, including recurring revenue, one-time setup fees, usage-based charges, equipment acquisition, depreciation, maintenance, delivery costs, payroll, marketing spend, and cash flow movement. Charts help simplify these details by showing trends and relationships over time. This section may include visualizations for revenue growth, cash balance, profitability, cost structure, EBITDA, net income, break-even progress, subscriber growth, and other key metrics. For business planning and stakeholder communication, these charts are useful because they allow users to quickly show whether the company is moving toward profitability, how revenue grows over the forecast period, and where the largest costs or cash pressures occur. They can also make investor presentations, lender packages, board updates, or internal strategy sessions more effective by translating spreadsheet calculations into clear financial visuals. Instead of relying only on rows of numbers, users can use the chart outputs to tell a more organized financial story about how the subscription rental model scales, where investment is needed, and how profitability improves as the customer base and equipment utilization increase.
ROE Components and DuPont Analysis
The ROE components and DuPont analysis section helps users understand the drivers behind return on equity rather than looking at a single profitability ratio in isolation. For an equipment rental subscription business, return on equity can be affected by several interconnected factors, including net profit margin, asset turnover, leverage, fleet investment, utilization, pricing strategy, maintenance costs, and financing structure. DuPont analysis breaks the return profile into more meaningful pieces so users can identify whether financial performance is driven by margins, efficient use of assets, or balance sheet leverage. This is useful because equipment rental businesses often require significant asset investment, and strong revenue growth alone does not always mean capital is being used efficiently. The model can help users analyze how recurring revenue, operating costs, depreciation, debt, equity funding, and asset base assumptions contribute to overall returns. For investors and owners, this component supports a more complete view of financial quality. It can show whether improving margins, increasing utilization, lowering operating costs, or changing the funding mix may improve returns. This makes the section valuable for business valuation discussions, investor reporting, strategic planning, and evaluating whether the company’s growth plan creates attractive long-term value.
Revenue Inputs
The revenue inputs section is where users define the commercial assumptions that drive the equipment rental subscription forecast. It is structured around the recurring revenue nature of the business and may include subscription tiers, monthly pricing, subscriber growth, customer mix, churn, setup fees, usage-based transaction fees, plan upgrades, and other revenue-related drivers. For example, an equipment rental subscription concept may offer lower-priced DIY plans, mid-tier professional plans, and higher-value contractor plans, each with different pricing, customer behavior, and revenue contribution. This section helps users translate their go-to-market strategy into measurable financial assumptions. It is useful because small changes in subscription pricing, conversion rates, churn, or plan mix can materially affect monthly recurring revenue and long-term profitability. The revenue input area may also help users separate recurring revenue from one-time or variable fees, making the forecast more transparent and easier to explain. Entrepreneurs can use it to test pricing strategies, consultants can adapt it for client-specific business plans, and analysts can evaluate how customer acquisition assumptions flow into revenue, cash flow, and profit. By making revenue assumptions editable and organized, this component provides the foundation for a credible equipment rental subscription financial plan.
Bank-Ready Reports
The bank-ready reports component organizes the model’s financial outputs into a lender-friendly structure that can support loan applications, funding conversations, and formal business planning. Equipment rental subscription businesses may require external financing to purchase equipment, acquire delivery vehicles, lease warehouse space, build a software platform, hire staff, and cover early operating losses before revenue reaches scale. Lenders typically need clear financial statements, cash flow projections, repayment capacity, profitability expectations, capital requirements, and supporting assumptions. This section helps users present those outputs in a professional format, often including forecasted profit and loss, cash flow, balance sheet, and summary metrics. It can help show how much funding is required, how the funds may be used, when the business is expected to become cash-flow positive, and whether the projected cash flow can support debt service or working capital needs. The bank-ready format is useful because it reduces the time required to convert an internal forecast into a polished financial package. It also helps users communicate the business model more clearly to banks, alternative lenders, grant providers, investors, or strategic partners who need to assess financial feasibility and risk.
Revenue Breakdown
The revenue breakdown section provides a more detailed view of how total revenue is generated across the different income streams in the equipment rental subscription model. Rather than showing only one top-line revenue number, this component separates the sources that may contribute to sales, such as monthly subscription tiers, one-time onboarding or setup fees, per-transaction usage charges, premium plan upgrades, add-on services, delivery fees, or other monetization options. This is important because a subscription rental business can have a blended revenue model where recurring income provides stability while one-time and usage-based fees increase average revenue per customer. The section helps users understand which revenue streams drive growth, which plans produce the most value, and how changes in customer mix affect the forecast. It may also help identify whether the business is too dependent on one customer segment or whether higher-margin plans are contributing enough to offset costs. For planning and decision-making, this breakdown supports better pricing strategy, marketing focus, fleet planning, and sales channel prioritization. It can also strengthen investor and lender communication by showing that revenue assumptions are not arbitrary but are built from specific drivers that can be reviewed, adjusted, and monitored over time.
KPI Dashboard
The KPI dashboard component tracks performance metrics that are especially relevant to an equipment rental subscription business. While financial statements show the overall results, key performance indicators help explain why those results are happening. This section may include metrics such as monthly recurring revenue, subscriber count, churn, average revenue per user, customer acquisition cost, payback period, equipment utilization, gross margin, EBITDA margin, maintenance cost ratio, cash runway, and revenue per asset. These metrics are useful because recurring rental models depend on both customer economics and asset productivity. A company may add subscribers quickly but still struggle if churn is high, equipment maintenance costs exceed expectations, delivery costs are inefficient, or utilization is too low. The KPI dashboard gives users a structured way to monitor these operating signals and connect them to financial outcomes. It can also support benchmarking by comparing projected metrics with industry standards or internal targets. For founders, this helps guide operational priorities. For consultants and analysts, it provides a clearer basis for reviewing business performance. For investors and lenders, it shows whether the model is tracking the drivers that matter most for sustainable recurring revenue, profitability, and capital efficiency.
Break-Even Analysis
The break-even analysis component helps users estimate when the equipment rental subscription business may reach the point where revenue covers its fixed and variable costs. This is a critical planning area because subscription businesses can experience early losses while they invest in equipment, customer acquisition, staffing, warehouse operations, delivery capacity, maintenance processes, and technology. The break-even section may use inputs such as subscription pricing, subscriber growth, plan mix, setup fees, usage charges, gross margin, payroll, rent, insurance, marketing, maintenance, software expenses, and other operating costs. The outputs can show the break-even month, break-even revenue level, break-even subscriber base, and the amount of funding needed before the business becomes self-sustaining. This is useful for entrepreneurs evaluating whether the model is financially viable, as well as for investors and lenders who want to understand how long the business may require support before it can operate profitably. It also helps users make practical decisions about pricing, cost control, sales targets, and fleet expansion. If break-even occurs too late, users can adjust assumptions to test whether higher plan adoption, lower churn, reduced marketing costs, equipment leasing, or more efficient delivery operations can improve the path to profitability.
Startup Costs and Funding Requirements
The startup costs and funding requirements component helps users estimate the initial investment needed to launch and support the equipment rental subscription business until it generates sufficient cash flow. This section is especially important because the business model may require significant upfront capital for the initial equipment fleet, delivery vehicles, warehouse setup, platform development, licenses, insurance, deposits, branding, launch marketing, working capital, and early payroll. The model can organize these costs into clear categories so users understand not only the total amount required but also how funds are allocated. It may also connect startup spending to financing assumptions, such as owner equity, investor capital, bank loans, equipment financing, or other funding sources. The outputs can help identify initial capital requirements, early cash shortages, funding gaps, and the cash runway available before the business reaches break-even. For business planning, this component helps users avoid underestimating launch costs and working capital needs.
File types:
Excel – Single-User: .xlsx
Excel – Multi-User: .xlsx
Similar ProductsOther customers were also interested in...


 HenrySheykin
Fresh Flowers Subscription Financial Model Excel T...
The Subscription Box Financial Model Template helps entrepreneurs, founders, analysts, consultants, ... Read more
Customer Service Software Financial Model Excel Te...
The Customer Service Software Financial Model helps founders, operators, consultants, and analysts t... Read more
Human Resource Software Financial Model Excel Temp...
The HR Software Financial Model Financial Model Template helps founders, business owners, consultant... Read more
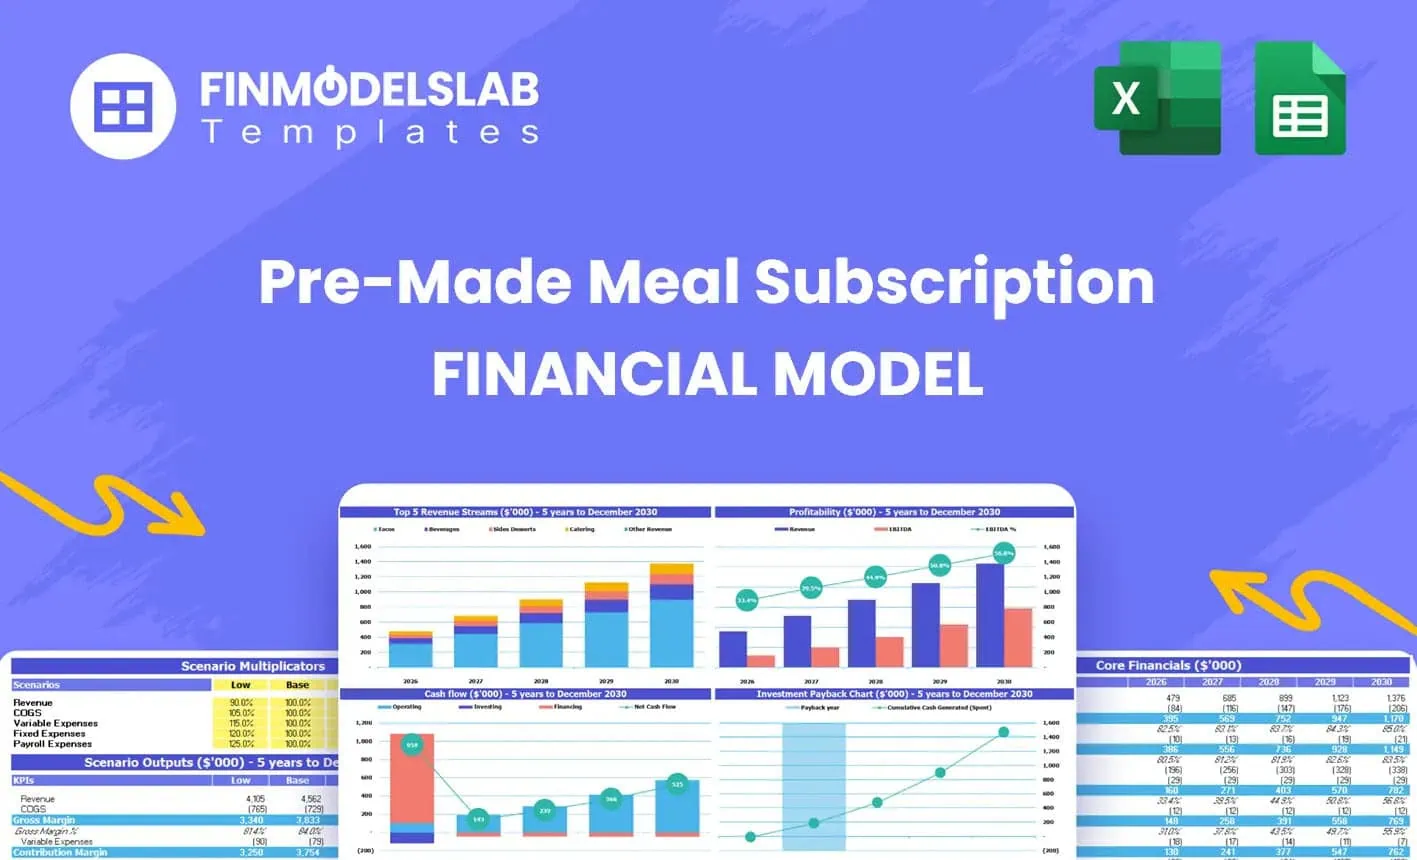
Pre-Made Meal Subscription Box Financial Model Exc...
The Pre-Made Meal Subscription Financial Model Template helps entrepreneurs and planners turn a meal... Read more

 Jason Varner
Product + Subscription Financial Model
Build a strategy for adding recurring revenues services to your product. Includes financial statemen... Read more
Product-as-a-Service (PaaS) Financial Model
This is a true PaaS model with flexible build-out assumptions, capacity sanity checks, and direct sa... Read more

 JILL LIU
Subscription Meal Kit Financial & DCF Valuatio...
We are glad to present our new integrated, dynamic and ready-to-use Subscription Meal Kit Financial ... Read more

Data-as-a-Service Financial Feasibility Study
This model is built for data-as-a-service startups. If you have valuable data to monetize, this temp... Read more

 Giorgos
Subscription Business – 10 Year Financial Model
Financial Model providing a 10-year financial plan for a startup or operating Subscription Business.... Read more
“Netflix for Gadgets” – Consumer-Tech Subscr...
An integrated, dynamic and ready-to-use financial model for Consumer-Tech Subscription/Rental Busine... Read more
You must log in to submit a review.