
0 ITEMS

Customer Service Software Financial Model Excel Template
The Customer Service Software Financial Model helps founders, operators, consultants, and analysts turn a SaaS business concept into a structured financial forecast. Built for a customer support software company, the template gives users a practical way to estimate subscription revenue, setup fees, usage-based income, startup costs, operating expenses, payroll, cash flow, profitability, and long-term growth potential. Instead of building formulas, assumptions, and investor-ready outputs from scratch, users can begin with a ready-made model designed around the economics of a recurring revenue software business. This financial model template is useful for entrepreneurs preparing to launch a customer service software platform, business owners planning expansion, consultants supporting client projects, and teams preparing business plans, pitch decks, loan applications, or investor documents. It helps connect the key commercial assumptions behind the business, including pricing tiers, customer acquisition, conversion rates, plan mix, churn, hosting costs, staffing needs, marketing spend, and capital requirements. By organizing these assumptions in one editable model, the template helps users understand how decisions about pricing, sales strategy, product investment, and cost control may affect financial performance. The model supports financial planning over a multi-year period and is designed to make forecasting easier for both finance and non-finance users. Users can review revenue assumptions, startup cost needs, operating expenses, payroll requirements, cash flow timing, profitability trends, break-even analysis, and investor return metrics. This makes it easier to test whether the business can move from early losses to sustainable profitability, identify funding gaps, and evaluate the financial impact of different growth scenarios before committing resources. With editable inputs, built-in formulas, professional formatting, and outputs suitable for stakeholder review, the Customer Service Software Financial Model is a time-saving planning tool for decision-making. It can be used in Microsoft Excel or Google Sheets, adapted to different business models, and reused as assumptions change. Whether the goal is to validate a startup idea, prepare a financial section for a business plan, support fundraising, or manage internal budgeting, the template provides a clear framework for building a credible customer service software financial forecast.
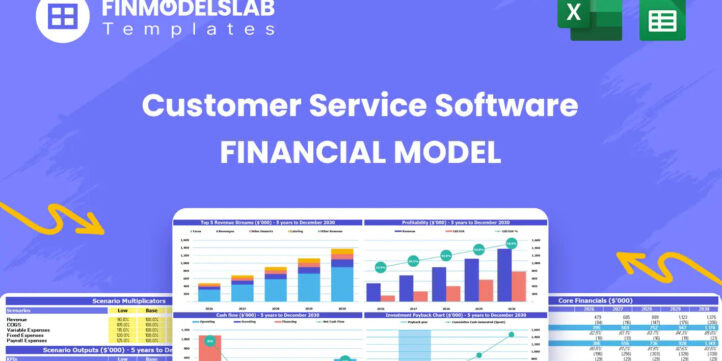


Financial Model Overview
The Customer Service Software Financial Model is a ready-to-use financial model template designed for founders, entrepreneurs, analysts, consultants, and business owners planning a SaaS platform for customer support, help desk automation, ticket management, live chat, customer engagement, or related service operations. The model gives users a structured way to forecast revenue, costs, cash flow, profitability, funding needs, and performance metrics over a multi-year period. It is especially useful because customer service software businesses often depend on recurring subscription revenue, customer acquisition efficiency, product development investment, hosting costs, support capacity, and retention performance. Instead of relying on rough estimates, users can work from a professionally organized framework with editable assumptions, automated calculations, and presentation-ready outputs. The template helps users evaluate whether the business can generate enough monthly recurring revenue to cover operating expenses, scale efficiently, reach break-even, and support investor or lender discussions with clear financial projections.
All-in-One Dashboard
The all-in-one dashboard provides a central view of the most important inputs and outputs in the Customer Service Software Financial Model. This section is designed to help users quickly understand the model without moving through every worksheet one by one. It may summarize key assumptions such as launch timing, pricing tiers, customer growth, conversion rates, churn, customer acquisition cost, payroll levels, operating expenses, capital expenditures, and funding requirements. It can also display core outputs such as revenue, gross profit, EBITDA, net income, cash balance, burn rate, runway, and profitability milestones. For a customer service software company, this is valuable because management needs a clear view of both commercial traction and financial health. The dashboard helps users see how changes in assumptions affect the forecast, making it easier to prepare for investor meetings, internal planning sessions, or funding discussions. It also acts as a control center for decision-making by giving founders and stakeholders a concise view of whether the business model is financially viable, scalable, and aligned with growth targets.
Low, Base, and High Scenario Analysis
The low, base, and high scenario analysis component helps users compare how the customer service software business may perform under different market and operating conditions. A low case may reflect slower customer acquisition, lower trial-to-paid conversion, higher churn, reduced pricing power, or greater marketing inefficiency. A base case can represent the most realistic plan, using assumptions the founder or analyst expects to achieve. A high case may reflect stronger demand, better sales conversion, higher enterprise adoption, improved retention, or more efficient operating leverage. This section typically uses flexible inputs that allow users to test changes in customer volume, pricing, plan mix, usage fees, marketing spend, payroll timing, cost of goods sold, and overhead. The outputs help compare revenue, margins, cash runway, profitability, and funding needs across each scenario. For planning and fundraising, scenario analysis is important because investors and lenders often want to understand both upside potential and downside risk. It helps users avoid relying on a single forecast and instead prepare a more resilient financial plan.
Professional Charts and Visual Reports
The professional charts and visual reports component converts financial data into clean, presentation-ready visuals that make the Customer Service Software Financial Model easier to understand and communicate. This section may include charts for revenue growth, monthly recurring revenue, customer count, gross margin, EBITDA, net income, cash balance, expense mix, burn rate, and other key SaaS trends. For a customer service software startup, visual reporting is helpful because the business story often depends on explaining growth dynamics over time, including the movement from early investment and negative cash flow toward recurring revenue scale and operating profitability. Charts make it easier for stakeholders to identify trends, compare periods, and understand the impact of assumptions without reviewing every line of the model. These visuals can support pitch decks, business plans, board updates, loan applications, and internal management reviews. They also help non-financial audiences follow the forecast more easily, which is useful when presenting to cofounders, advisors, investors, or partners who need a clear summary of the company’s financial trajectory.
ROE Components and DuPont Analysis
The ROE components and DuPont analysis section helps users evaluate return on equity by breaking it into the underlying drivers that influence profitability and capital efficiency. Rather than showing a single return metric in isolation, DuPont analysis can separate performance into factors such as profit margin, asset turnover, and financial leverage. For a customer service software company, this is useful because a SaaS business may improve returns through different pathways, including stronger subscription margins, better cost control, more efficient use of capital, improved customer lifetime value, or optimized financing structure. Inputs may include net income, revenue, assets, equity, debt, and other balance sheet and income statement figures generated by the model. Outputs can show how operating performance and capital structure contribute to overall return on equity. This component is particularly valuable for investors, lenders, and analysts who want to understand whether the company’s projected returns are supported by healthy operating economics or simply by leverage. It supports strategic decision-making by showing which drivers have the greatest effect on shareholder returns.
Revenue Inputs
The revenue inputs section is where users define the core assumptions that drive the income forecast for the customer service software business. Because this type of company typically relies on recurring SaaS revenue, the section may include pricing for multiple subscription tiers, customer acquisition volume, trial signups, trial-to-paid conversion rates, churn, upgrades, downgrades, plan mix, setup fees, transaction-based fees, and enterprise adoption assumptions. For example, the model can be adjusted to reflect starter, professional, and enterprise plans, each with different price points, customer counts, and revenue behavior. This section is critical because revenue is not just a top-line estimate; it is built from the commercial mechanics of the business. By editing revenue assumptions, users can test how pricing changes, improved conversion rates, higher retention, or stronger enterprise sales affect monthly recurring revenue and long-term profitability. The output feeds into the income statement, cash flow forecast, dashboards, charts, and KPI analysis. For business planning and fundraising, credible revenue inputs help users create a forecast that is both flexible and defensible.
Bank-Ready Financial Reports
The bank-ready financial reports component organizes the main financial outputs into a format suitable for lenders, investors, advisors, and business plan reviewers. This section may include projected income statements, cash flow statements, balance sheets, summaries of debt or funding needs, profitability metrics, and annual or monthly views of financial performance. For a customer service software company seeking financing, this is important because stakeholders need to see more than revenue potential. They also need to understand whether the company can manage payroll, technology costs, marketing spend, capital expenditures, and working capital while maintaining sufficient cash. The reports are designed to connect assumptions with formal financial statements, making it easier to review revenue, cost of goods sold, gross profit, operating expenses, EBITDA, net income, cash balances, assets, liabilities, and equity. This component helps users prepare lender-friendly and investor-ready documentation without having to manually format financial outputs. It supports funding preparation by showing how the business is expected to perform, when it may need capital, and how financial results may evolve over time.
Revenue Breakdown
The revenue breakdown section gives users a detailed view of how total revenue is generated across different customer service software revenue streams. Instead of presenting one combined sales number, this component separates revenue by source, such as monthly recurring revenue from subscription tiers, one-time setup fees, usage-based transaction fees, enterprise contracts, onboarding services, or other monetization lines relevant to the business. It may show revenue by plan type, customer segment, month, year, or percentage contribution to total revenue. This is useful because SaaS businesses can look strong at the top level while depending too heavily on one revenue stream, customer group, or pricing tier. A detailed breakdown helps users understand which plans are driving growth, whether enterprise customers are becoming more important over time, how much revenue comes from recurring versus non-recurring sources, and whether usage-based fees materially improve margins. The outputs can support pricing strategy, sales planning, investor communication, and operational budgeting. For decision-making, this section helps users identify the most valuable revenue drivers and focus resources on the areas with the strongest financial impact.
KPI Dashboard
The KPI dashboard tracks the performance metrics that matter most for a customer service software business and connects them to the broader financial forecast. This section may include SaaS and operating metrics such as monthly recurring revenue, annual recurring revenue, customer acquisition cost, customer lifetime value, churn rate, retention rate, gross margin, average revenue per account, trial-to-paid conversion, payback period, burn rate, runway, EBITDA margin, and revenue growth. These KPIs help users evaluate whether the business is improving operationally, not just whether the accounting statements show growth. For example, increasing revenue may be less attractive if customer acquisition cost is rising too quickly or churn is reducing lifetime value. The KPI dashboard helps founders, analysts, and investors monitor the health of the model and compare assumptions against industry benchmarks where applicable. It is also useful for ongoing management because it allows users to update assumptions and track whether the business is moving toward sustainable growth. By consolidating key metrics in one place, this component supports faster decision-making and clearer stakeholder reporting.
Break-Even Analysis
The break-even analysis section helps users estimate when the customer service software business may generate enough revenue to cover its total costs. This component typically considers recurring subscription revenue, setup fees, usage-based revenue, cost of goods sold, hosting expenses, payroll, marketing spend, software tools, administrative costs, and other fixed and variable expenses. It may show break-even by month, year, revenue level, customer count, or profitability measure such as EBITDA or net income. For a SaaS company, break-even analysis is especially important because early periods often involve upfront investment in product development, customer acquisition, brand building, and team hiring before recurring revenue reaches scale. The section helps users understand how many paying customers may be needed, how pricing affects the timeline, and how cost control or improved conversion can accelerate profitability. It is useful for funding discussions because it gives investors and lenders a clear view of the milestone where the company becomes less dependent on external capital. It also supports internal decision-making by showing which levers have the biggest effect on the path to profitability.
Startup Costs and Operating Expense Planning
The startup costs and operating expense planning section helps users estimate the investment needed to launch and run the customer service software business. Startup costs may include development workstations, initial server or network hardware, office setup, legal formation, branding, website development, early software tools, product design, security setup, licenses, initial marketing, and working capital reserves. Operating expenses may include payroll for developers, sales staff, customer success, support, product management, and administration, along with cloud hosting, data storage, customer communication tools, advertising, commissions, insurance, rent, professional fees, and general overhead. This section helps users distinguish between one-time launch costs, recurring fixed costs, and variable costs that scale with customers or usage. The outputs feed into funding requirements, cash flow projections, profitability forecasts, and break-even analysis. For entrepreneurs and consultants preparing a business plan, this component is valuable because it reduces the risk of underestimating the capital required before revenue becomes dependable. It also helps management create a realistic budget, phase hiring decisions, prioritize spending, and protect cash runway during the early growth stage.
File types:
Excel – Single-User: .xlsx
Excel – Multi-User: .xlsx
Similar ProductsOther customers were also interested in...


 HenrySheykin
Equipment Rental Subscription Financial Model Exce...
The Equipment Rental Subscription Financial Model helps users turn an equipment-as-a-service busines... Read more
Fresh Flowers Subscription Financial Model Excel T...
The Subscription Box Financial Model Template helps entrepreneurs, founders, analysts, consultants, ... Read more
Human Resource Software Financial Model Excel Temp...
The HR Software Financial Model Financial Model Template helps founders, business owners, consultant... Read more
Pre-Made Meal Subscription Box Financial Model Exc...
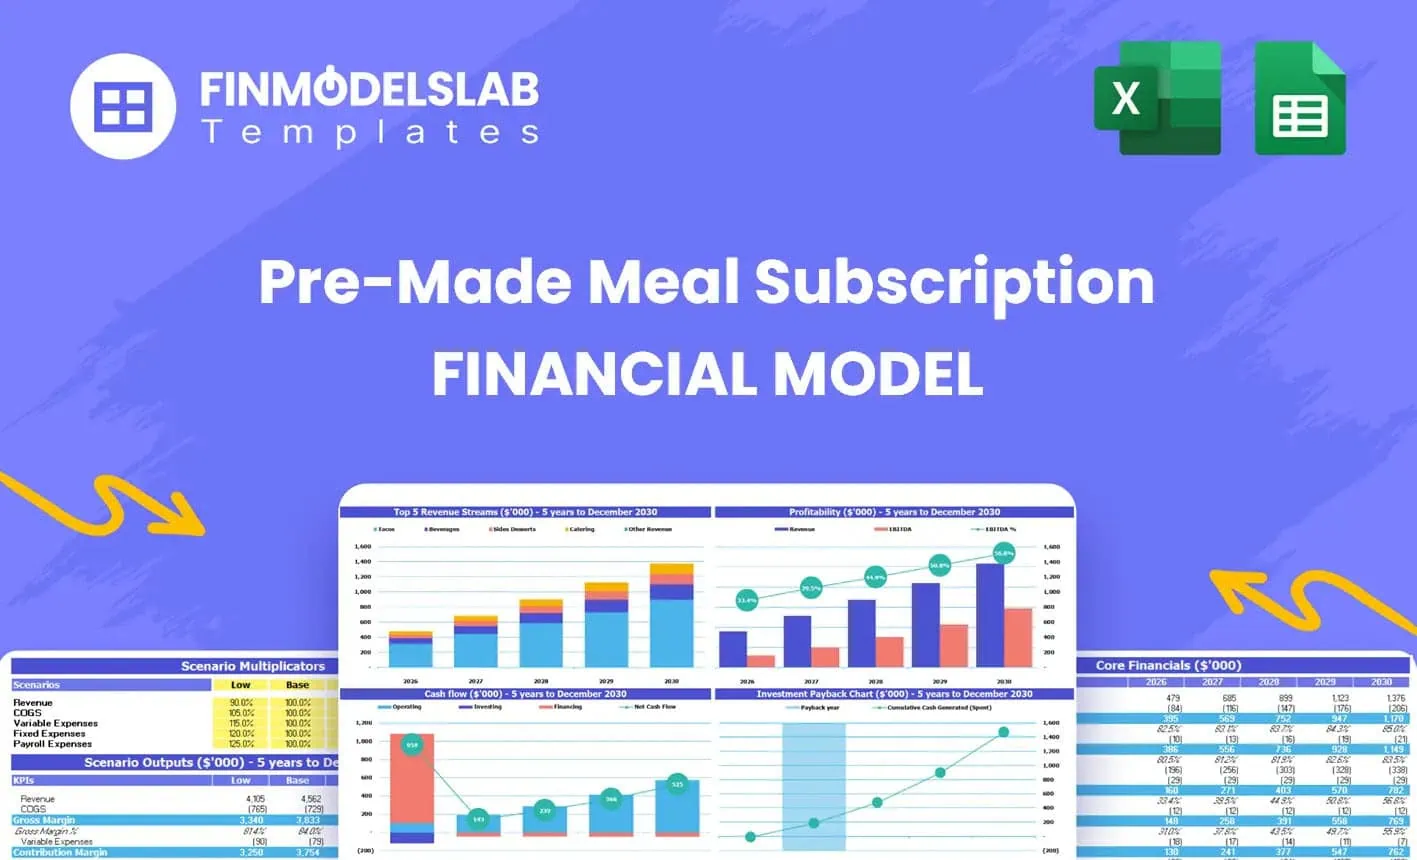
The Pre-Made Meal Subscription Financial Model Template helps entrepreneurs and planners turn a meal... Read more

 Jason Varner
Product + Subscription Financial Model
Build a strategy for adding recurring revenues services to your product. Includes financial statemen... Read more

Product-as-a-Service (PaaS) Financial Model
This is a true PaaS model with flexible build-out assumptions, capacity sanity checks, and direct sa... Read more

 JILL LIU
Subscription Meal Kit Financial & DCF Valuatio...
We are glad to present our new integrated, dynamic and ready-to-use Subscription Meal Kit Financial ... Read more

Data-as-a-Service Financial Feasibility Study
This model is built for data-as-a-service startups. If you have valuable data to monetize, this temp... Read more

 Giorgos
Subscription Business – 10 Year Financial Model
Financial Model providing a 10-year financial plan for a startup or operating Subscription Business.... Read more
“Netflix for Gadgets” – Consumer-Tech Subscr...
An integrated, dynamic and ready-to-use financial model for Consumer-Tech Subscription/Rental Busine... Read more
You must log in to submit a review.