
0 ITEMS

Procurement Software Financial Model Excel Template
The Procurement Software Financial Model helps founders, entrepreneurs, consultants, analysts, and business owners build a structured financial forecast for a B2B SaaS procurement platform. Instead of starting from a blank spreadsheet, users get a ready-to-use financial model template designed around the economics of subscription software, usage-based transaction fees, implementation revenue, customer acquisition, cloud hosting costs, payroll, and scalable operating expenses. It gives you a practical way to estimate how a procurement software business may perform across revenue, cost, cash flow, profitability, and funding requirements over a multi-year planning period. This template is especially useful for people preparing business plans, investor presentations, lender documents, internal budgets, or strategic growth plans. It allows users to document key revenue assumptions, test subscription pricing tiers, estimate customer growth, plan startup costs, and evaluate the operating expense structure needed to support product development, sales, marketing, customer success, administration, and technology infrastructure. The model helps connect commercial strategy with financial outcomes, so you can see how pricing, volume, conversion rates, staffing, and cost controls affect profit and cash flow. The Procurement Software Financial Model is built to support practical financial planning and decision-making. It includes editable assumptions, scenario analysis, revenue breakdowns, dashboards, professional charts, profitability metrics, and lender-ready outputs that help translate your business strategy into clear financial projections. Users can review the effect of different growth paths, compare low, base, and high cases, understand when the business may reach break-even, and assess whether cash reserves or outside funding are sufficient to support the plan. For startup founders, the template helps estimate launch requirements and early operating pressure. For established software companies, it can support expansion planning, new product line evaluation, or fundraising preparation. For consultants and analysts, it provides a structured framework that can be adapted for client work. By organizing revenue, startup costs, operating expenses, payroll, cash flow, profitability, break-even analysis, and key performance indicators in one editable model, this template helps users make more informed decisions and present their numbers with greater clarity.
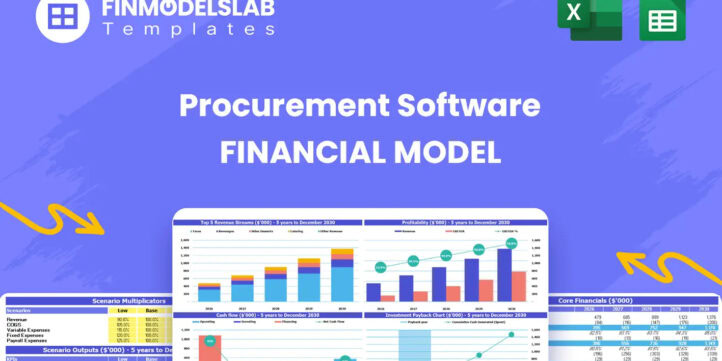


Financial Model Overview
The Procurement Software Financial Model is a ready-to-use financial model template built for planning, evaluating, and presenting the economics of a procurement software business. It is designed for a B2B SaaS platform where revenue may come from monthly subscription plans, usage-based transaction fees, one-time setup fees, enterprise implementation charges, and recurring customer relationships. The model helps entrepreneurs, founders, business owners, analysts, consultants, and finance teams organize their assumptions into a clear forecast that can support business planning, funding discussions, internal budgeting, and strategic decision-making. Instead of building a complex SaaS forecast from scratch, users can work from a structured model with editable inputs, pre-built formulas, financial statements, dashboards, charts, and outputs that show how the business may perform over time. For a procurement software company, this is especially useful because growth depends on multiple moving parts, including customer acquisition, subscription pricing, transaction volume, onboarding costs, cloud infrastructure, product development, payroll, sales efficiency, churn, and customer expansion. The template brings these assumptions together so users can understand how the business may scale, where cash constraints may appear, when profitability may be reached, and what financial story can be presented to lenders, investors, partners, or internal stakeholders.
All-in-One Dashboard
The all-in-one dashboard gives users a centralized view of the most important inputs and outputs in the Procurement Software Financial Model. This section is useful because SaaS planning often involves many assumptions spread across revenue, expenses, headcount, capital needs, financing, margins, and cash flow, and a dashboard helps bring those moving parts into one clear view. Users can review high-level assumptions such as pricing tiers, subscription volumes, customer growth, churn, transaction activity, operating cost levels, and staffing expectations while also seeing the resulting outputs such as revenue, EBITDA, net income, ending cash, margins, and funding needs. For a procurement software business, this helps founders and analysts quickly understand whether the plan is commercially and financially realistic. The dashboard can be used during planning meetings, investor conversations, lender reviews, or internal performance reviews because it summarizes the model without requiring users to search through multiple worksheets. It also supports faster decision-making by showing how changes to key assumptions affect headline financial results. If customer acquisition costs increase, if enterprise adoption is slower, or if cloud hosting costs rise, the dashboard can help users immediately see the effect on profitability and liquidity. This makes it a practical control center for managing the overall financial forecast.
Low, Base, and High Scenario Analysis
The low, base, and high scenario analysis section helps users test how the procurement software business may perform under different market, sales, and operating conditions. A base case can represent the expected plan, while the low case can show a more conservative outcome with slower customer acquisition, lower conversion rates, higher churn, weaker upsell performance, or increased operating costs. The high case can show what may happen if demand is stronger, enterprise plans scale faster, transaction volume grows more quickly, and sales efficiency improves. This type of scenario planning is important for a procurement software company because SaaS results are highly sensitive to customer volume, pricing mix, customer retention, product adoption, and sales productivity. By comparing multiple outcomes, users can better understand the range of possible revenue, gross margin, EBITDA, cash flow, and ending cash balances. The section supports funding preparation by helping founders estimate how much capital may be required in a downside case and how quickly the business may become profitable in an upside case. It also supports internal planning by helping leadership set realistic targets, identify key risk areas, and prepare contingency plans. Instead of relying on a single forecast, the model gives users a more flexible planning framework that can adapt to changing assumptions.
Professional Charts
The professional charts section translates the financial forecast into visual outputs that are easier to review, present, and discuss with stakeholders. Charts can show trends such as revenue growth, recurring revenue development, profitability improvement, gross margin, cash flow movement, customer growth, cost structure, or EBITDA progression. For a procurement software business, visual reporting is especially helpful because the financial story often depends on showing how early investment in product, marketing, and sales converts into recurring revenue and scalable profitability over time. Investors, lenders, advisors, and internal decision-makers may not want to review every line of a spreadsheet, so charts help communicate the most important conclusions quickly. This section uses the model’s inputs and calculated outputs to create presentation-ready views that support pitch decks, business plans, board updates, and lender packages. Users can use these visuals to explain when revenue accelerates, when fixed costs become more efficient, when cash requirements peak, and when the business reaches stronger profitability. Professional charts also make it easier to compare scenarios, track progress against targets, and communicate the financial impact of strategic decisions. By turning detailed spreadsheet logic into clear visuals, this component improves both analysis and communication.
ROE Components and DuPont Analysis
The ROE components and DuPont analysis section helps users understand the drivers behind return on equity rather than looking only at a single profitability metric. DuPont analysis typically breaks return on equity into underlying components such as profit margin, asset turnover, and financial leverage, allowing users to see whether shareholder returns are being driven by operational profitability, efficient use of assets, or the company’s financing structure. For a procurement software business, this is useful because returns can improve as recurring revenue scales, margins expand, and the company becomes more efficient with its capital base. This section may use net income, revenue, assets, equity, and balance sheet outputs to calculate return on equity and the factors influencing it. Founders and finance teams can use the analysis to assess whether the business is generating attractive returns from invested capital and whether growth is being supported by healthy economics. Investors may also use the section to understand how efficiently the company converts revenue growth into equity value. Because software businesses often require upfront investment in product development, customer acquisition, and infrastructure, DuPont analysis can help show whether those investments are producing stronger financial performance over time. This component adds depth to the model by moving beyond revenue and profit into capital efficiency and shareholder return analysis.
Revenue Inputs
The revenue inputs section is where users define the commercial assumptions that drive the procurement software forecast. For a SaaS procurement platform, revenue may be based on tiered monthly subscription plans, enterprise pricing, customer counts, usage-based transaction fees, one-time setup fees, implementation revenue, onboarding charges, or other revenue streams tied to customer adoption. Users can adjust assumptions such as plan pricing, number of new customers, customer retention, subscription mix, transaction volume, average transaction fees, annual contracts, upsell rates, and conversion rates. These inputs are essential because revenue is the foundation of the entire financial model. Changes in pricing, customer growth, or plan mix can significantly affect gross revenue, recurring revenue, margins, cash flow, profitability, and valuation potential. The section is designed to help users build a forecast that reflects how procurement software is actually sold and monetized. A startup may use it to test whether a lower-cost entry plan can support enough volume, while an enterprise-focused company may use it to evaluate the impact of larger contracts and implementation fees. By making revenue assumptions explicit and editable, this component helps users avoid vague projections and build a more defensible forecast for business planning, fundraising, or strategic review.
Bank-Ready Reports
The bank-ready reports section organizes the model’s financial outputs into a format that can support discussions with lenders, financing partners, and other stakeholders who need clear financial statements. This section may include forecasted profit and loss statements, cash flow statements, balance sheet summaries, debt-related outputs, funding needs, and key financial metrics. For a procurement software business seeking a loan, line of credit, or other financing, lenders will want to understand the company’s revenue model, cost structure, cash position, ability to service obligations, and path to profitability. Bank-ready reports help present this information in a structured way that is easier to review and compare against lender expectations. The reports can show whether the business generates enough cash to cover operating expenses, payroll, hosting costs, customer acquisition, product development, and potential financing payments. They also help users identify periods where cash may be tight and where external capital may be required. For founders and finance teams, this section saves time by turning detailed assumptions into organized financial statements and lender-friendly summaries. It also improves credibility because it demonstrates that the business has been modeled with attention to revenue drivers, expense planning, cash flow, and financial sustainability.
Revenue Breakdown
The revenue breakdown section provides a detailed view of how total revenue is built from individual streams, plans, customer types, or usage categories. For a procurement software platform, this may include monthly recurring revenue from subscription tiers, one-time setup or implementation fees, usage-based transaction revenue, enterprise contracts, premium support, integrations, or other monetization streams. This section helps users understand not only how much revenue the business may generate, but where that revenue comes from and which drivers matter most. It can show the relative contribution of starter, growth, and enterprise plans, the impact of moving customers into higher-priced tiers, and the effect of transaction volume on total income. This is important because a procurement software business may have different margins, retention patterns, and sales cycles across customer segments. Enterprise customers may generate larger contract values but require more implementation and customer success support, while smaller customers may scale faster but contribute lower average revenue per account. By separating revenue streams, users can assess which segments are most attractive, where to focus sales resources, and how pricing changes may affect overall performance. The revenue breakdown also supports investor discussions by making the growth model more transparent and showing whether the company relies on diversified and recurring income sources.
KPI Dashboard
The KPI dashboard section focuses on the performance metrics that help users evaluate the health of a procurement software business beyond the financial statements. SaaS companies are often judged by metrics such as monthly recurring revenue, annual recurring revenue, customer acquisition cost, customer lifetime value, churn rate, gross margin, average revenue per customer, LTV to CAC ratio, CAC payback period, transaction volume, EBITDA margin, and revenue growth. This section helps users track those metrics in one place and compare performance against targets or industry benchmarks where relevant. For founders and analysts, KPI tracking is essential because strong financial statements usually depend on strong underlying operating metrics. A procurement software company may appear to be growing revenue, but if customer acquisition cost is too high, churn is increasing, or CAC payback is too long, the business may require more funding than expected. The KPI dashboard helps identify these issues earlier and supports more informed decision-making. It can also be used in investor updates, management reviews, and strategic planning sessions to explain what is driving results. By combining financial and operational indicators, this component gives users a more complete picture of business performance and helps connect day-to-day execution with long-term financial outcomes.
Break-Even Analysis
The break-even analysis section helps users estimate when the procurement software business may generate enough revenue to cover its fixed and variable costs. This component can use assumptions such as subscription revenue, transaction revenue, gross margin, payroll, marketing spend, cloud hosting costs, administrative expenses, customer support costs, software development costs, and other operating expenses to calculate the point where the business moves from loss-making to profitable. For a SaaS procurement platform, break-even timing is a critical planning metric because early-stage companies often invest heavily in product development, sales, marketing, and customer success before recurring revenue reaches sufficient scale. Understanding the break-even point helps founders determine whether their pricing, customer acquisition plan, and cost structure are sustainable. It also supports funding conversations because investors and lenders often want to know how long the company will need external capital before it can support itself through operations. Users can test how break-even changes if customer growth accelerates, if enterprise plan adoption improves, if churn declines, or if operating expenses are reduced. This makes the section valuable for both strategic planning and cost control. It helps users identify the revenue level, customer base, and margin structure required to reach financial sustainability.
Startup Cost and Capital Planning
The startup cost and capital planning section helps users estimate the initial investment required to launch or expand a procurement software business before meaningful revenue is generated.
File types:
Excel – Single-User: .xlsx
Excel – Multi-User: .xlsx
Similar ProductsOther customers were also interested in...

 HenrySheykin
E-Commerce Software Financial Model Excel Template
The E-Commerce Platform Financial Model Financial Model Template helps founders, entrepreneurs, cons... Read more
Data Analytics Software Financial Model Excel Temp...
The Data Analytics Software Financial Model helps users build a structured financial forecast for a ... Read more
Customer Service Software Financial Model Excel Te...
The Customer Service Software Financial Model helps founders, operators, consultants, and analysts t... Read more
Equipment Rental Subscription Financial Model Exce...
The Equipment Rental Subscription Financial Model helps users turn an equipment-as-a-service busines... Read more
CRM Software Financial Model Excel Template
The CRM Software Financial Model is a ready-to-use financial model template designed to help founder... Read more
Fresh Flowers Subscription Financial Model Excel T...
The Subscription Box Financial Model Template helps entrepreneurs, founders, analysts, consultants, ... Read more

Software Development Financial Model Excel Templat...
The Software Development Financial Model Template helps founders, entrepreneurs, consultants, analys... Read more
Accounting Software Financial Model Excel Template
The Accounting Software Financial Model helps founders, entrepreneurs, consultants, analysts, and bu... Read more
Human Resource Software Financial Model Excel Temp...
The HR Software Financial Model Financial Model Template helps founders, business owners, consultant... Read more
SaaS Actuals Opt-In Financial Model Excel Template
The SaaS Business Financial Model helps founders, entrepreneurs, consultants, analysts, and business... Read more
You must log in to submit a review.