
0 ITEMS

Etsy & Ebay Store Financial Model Excel Template
The Etsy and eBay Store Financial Model helps marketplace sellers, founders, consultants, and business planners turn an online store idea into a structured financial forecast. Instead of estimating sales, fees, inventory costs, marketing spend, and cash needs separately, this financial model template brings the main planning assumptions into one editable file. It is designed for users who want to understand whether an Etsy, eBay, or multi-platform marketplace store can generate enough revenue, margin, and cash flow to support launch, growth, or funding discussions. This template is useful for new entrepreneurs preparing to open a store, existing sellers planning expansion, advisors building forecasts for clients, and analysts preparing business plans or funding documents. It supports financial planning by connecting revenue assumptions, customer acquisition, repeat purchases, product categories, cost of goods sold, operating expenses, payroll, platform fees, and startup costs. Users can update the model with their own pricing, product mix, marketing budget, staffing plan, supplier costs, shipping assumptions, and marketplace strategy, then review the impact on profitability and cash flow over a multi-year forecast period. The Etsy and eBay Store Financial Model is built to help buyers evaluate the business before committing capital or making major operational decisions. It can be used to estimate initial investment needs, forecast monthly and annual performance, compare low, base, and high scenarios, and identify the timing of break-even. The model also helps users see how changes in customer acquisition cost, repeat order rate, average order value, inventory spending, and fixed expenses affect long-term results. This makes it practical for decision-making, budgeting, investor conversations, lender reviews, and internal planning. Because the template is fully editable and ready to use, it saves time compared with building a financial model from scratch. It includes professional outputs, visual dashboards, revenue breakdowns, KPI tracking, and bank-ready financial reports that can support presentations and planning documents. Whether you are validating a handmade goods store, a vintage resale shop, a niche eBay store, or a multi-category marketplace business, this financial model template gives you a clear framework for forecasting revenue, managing expenses, monitoring cash flow, assessing profitability, and planning for sustainable growth.


![Excel dashboard titled 'Returns on Invested Capital' for ABC Company Inc., showing a chart of ROIC and cash metrics up to 2030 with bars and line series.] (informative chart)](https://www.efinancialmodels.com/wp-content/uploads/edd/2026/04/etsy-ebay-store-financial-model-roic-financialmodelslab_2b3627b5-ee94-45fa-bd13-5f2116716148-scaled.jpg "etsy-ebay-store-financial-model-roic-financialmodelslab_2b3627b5-ee94-45fa-bd13-5f2116716148 | eFinancialModels")


Financial Model Overview
The Etsy and eBay Store Financial Model is a ready-to-use financial model template built for marketplace sellers who need a practical way to forecast revenue, expenses, cash flow, and profitability. It is designed for entrepreneurs launching a new Etsy or eBay store, existing sellers expanding into more product categories, consultants preparing client forecasts, and founders building business plans or funding documents.
The model helps translate the realities of online marketplace selling into a structured financial plan, including customer acquisition, repeat purchases, product category performance, platform fees, cost of goods sold, operating expenses, payroll, startup investment, and cash requirements. Instead of relying on rough estimates or disconnected spreadsheets, users can work from a professional planning framework that connects assumptions to outputs across a multi-year forecast.
The template is editable, compatible with Excel and Google Sheets, and structured to support planning, budgeting, investor discussions, lender review, and ongoing decision-making for an Etsy, eBay, or combined marketplace store.
All-in-One Dashboard
The all-in-one dashboard gives users a central view of the most important inputs and outputs in the Etsy and eBay Store Financial Model. This section is useful because marketplace businesses often rely on many moving parts, including product pricing, sales volume, marketing spend, customer acquisition cost, repeat order behavior, platform fees, inventory cost, shipping costs, and fixed operating expenses.
The dashboard brings key assumptions and financial results together so users can quickly understand how the store is expected to perform. Inputs may include launch timing, forecast period, store growth assumptions, product category mix, cost structure, staffing plan, and funding needs. Outputs may include revenue, gross profit, EBITDA, net profit, cash balance, payback period, and other headline financial metrics.
For business planning, the dashboard acts as the model’s command center, helping users check whether the forecast is realistic, identify the main drivers of profitability, and explain the financial story to stakeholders without forcing them to dig through every detailed worksheet.
Low, Base, and High Scenario Analysis
The low, base, and high scenario analysis component helps users compare how the business might perform under different market conditions and operating assumptions. An Etsy or eBay store may perform differently depending on customer demand, advertising effectiveness, marketplace competition, average order value, product margins, supplier costs, shipping rates, and repeat purchase behavior. This section allows users to test a conservative case, a most likely case, and an upside case in one model.
Inputs may include different revenue growth rates, customer acquisition costs, conversion expectations, repeat customer rates, gross margins, marketing budgets, payroll levels, and operating cost assumptions. Outputs may show how each scenario affects revenue, EBITDA, cash flow, profitability, funding needs, and return metrics.
This is especially valuable for decision-making because it helps users avoid planning around only one fixed outcome. Founders can use the scenarios to understand downside risk, identify cash shortfalls before they happen, and evaluate how much upside may be available if marketing, retention, or product mix performs better than expected.
Professional Charts
The professional charts component turns the financial forecast into clear visual outputs that are easier to review, present, and explain. Marketplace sellers and business planners often need to communicate financial projections to investors, lenders, partners, or internal teams, and charts make it easier to understand trends that may be difficult to interpret from rows of numbers alone. This section may visualize revenue growth, gross margin, EBITDA, net income, cash balance, expense categories, revenue mix, customer acquisition performance, and profitability trends over time.
The inputs are drawn from the model’s underlying assumptions and financial statements, while the outputs provide presentation-ready visuals that summarize business performance. These charts are useful for funding documents because they help stakeholders quickly see whether the business can scale, when it may become profitable, and how cash flow evolves during the early stages. They also support internal planning by allowing users to spot trends, compare performance periods, and communicate the financial plan in a more polished and accessible format.
ROE Components and DuPont Analysis
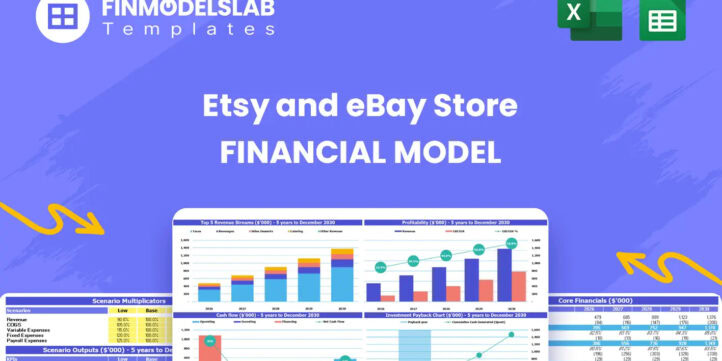
The ROE components section uses DuPont analysis to help users understand what is driving return on equity within the Etsy and eBay Store Financial Model. Rather than looking at return on equity as a single number, this component breaks performance into underlying drivers such as profitability, asset efficiency, and financial leverage.
For an online marketplace store, this can help users see whether returns are being shaped more by product margins, operating expenses, inventory efficiency, capital requirements, or financing structure. Inputs may include net income, revenue, total assets, equity, debt assumptions, retained earnings, and balance sheet outputs generated by the model. The resulting analysis can help explain how business decisions affect investor returns and owner value over time.
This section is useful for investors, lenders, and founders because it connects operational performance with capital efficiency. It also helps users evaluate whether growth is producing attractive returns or simply increasing sales without improving the underlying financial quality of the business.
Revenue Inputs
The revenue inputs component is where users define the assumptions that drive sales in the Etsy and eBay store forecast. For marketplace businesses, revenue is often influenced by product categories, average selling prices, order volume, new customer acquisition, repeat customer behavior, advertising spend, marketplace search visibility, conversion rates, and seasonal demand.
This section gives users a structured way to enter and adjust those assumptions without building formulas from scratch. Inputs may include the number of new customers acquired, customer acquisition cost, marketing budget, repeat purchase rate, average order value, product category pricing, unit sales, and expected growth across Etsy, eBay, or both platforms. Outputs flow into the revenue forecast, profitability calculations, cash flow projections, and financial statements.
This component is valuable because revenue assumptions are usually the foundation of the entire business plan. By making the sales drivers transparent and editable, the template helps users test whether their marketing budget can realistically support customer growth, whether repeat purchases are strong enough to improve lifetime value, and whether the sales plan can support the expense structure of the business.
Bank-Ready Reports
The bank-ready reports component provides lender-friendly financial outputs that can support loan applications, funding discussions, and professional business planning. Banks and financing partners typically need organized financial statements, clear assumptions, cash flow visibility, and evidence that the business can manage debt or working capital needs.
This section translates the underlying forecast into structured reports that are easier for external reviewers to assess. Inputs come from the model’s revenue forecast, expense planning, payroll assumptions, startup costs, capital expenditures, financing assumptions, and cash flow calculations. Outputs may include profit and loss statements, cash flow statements, balance sheet summaries, funding requirements, debt repayment visibility, profitability metrics, and key operating assumptions.
This component is useful because it helps users present their Etsy or eBay store plan in a professional format rather than sending informal estimates. It can also help users understand what lenders may focus on, including cash coverage, operating margins, liquidity, and the timing of positive cash flow. For founders and consultants, the reports can save significant preparation time and improve the credibility of the financial plan.
Revenue Breakdown
The revenue breakdown component gives users a more detailed view of how sales are generated across the store’s revenue streams. An Etsy and eBay business may sell handmade decor, unique gifts, artisan supplies, vintage items, collectibles, craft products, custom orders, resale inventory, or other categories with different prices, margins, demand patterns, and platform performance.
This section helps users separate those revenue streams so the model does not rely on one blended sales estimate. Inputs may include product categories, units sold, average selling price, marketplace channel, sales mix, product margin, repeat order behavior, and growth assumptions for each line. Outputs may include revenue by category, revenue by platform, total sales, gross profit contribution, and the relative importance of each product stream over time.
This is useful for decision-making because it shows which products are expected to carry the business and which categories may need pricing changes, cost reductions, or stronger marketing support. It also helps users test strategic decisions, such as expanding into a new category, shifting emphasis from Etsy to eBay, increasing average order value, or reducing reliance on low-margin products.
KPI Dashboard
The KPI dashboard component tracks the performance metrics that matter most for an Etsy and eBay store. Online marketplace businesses need more than basic revenue totals to understand performance, because growth depends on the relationship between traffic, conversion, customer acquisition, repeat purchases, order value, margins, fulfillment costs, platform fees, and cash flow. This section may monitor key metrics such as revenue growth, gross margin, EBITDA margin, net profit margin, cash balance, customer acquisition cost, repeat customer rate, average order value, payback period, return on equity, and other financial or operating indicators.
Inputs are connected to the model’s assumptions and forecast calculations, while outputs are displayed in a way that helps users identify strengths, weaknesses, and performance trends. The KPI dashboard is useful for founders, analysts, and business owners because it provides a quick way to evaluate whether the business is improving over time. It also supports benchmarking and stakeholder communication by turning the financial plan into measurable performance indicators that can be reviewed during planning meetings, funding discussions, or periodic business updates.
Break-Even Analysis
The break-even analysis component helps users identify when the Etsy or eBay store is expected to cover its total costs and begin generating profit. This is especially important for new marketplace sellers because early months may include startup spending, inventory purchases, photography equipment, website or brand asset development, marketing tests, platform setup, and operating expenses before sales reach full scale. Inputs may include fixed operating costs, variable costs, product margins, platform fees, shipping costs, payroll, marketing spend, average order value, and forecasted sales volume. Outputs may include the break-even month, break-even revenue level, required sales volume, cumulative profit position, and the gap between current performance and profitability.
This section is useful for business planning because it gives users a concrete milestone to manage toward. It can also help sellers identify ways to shorten the path to break-even, such as increasing average order value, improving repeat purchase rates, reducing customer acquisition cost, negotiating supplier costs, optimizing shipping expenses, or focusing on higher-margin product categories. For funding and investor conversations, break-even analysis helps explain how long the business may require support before it can sustain itself from operating cash flow.
Startup Costs and Funding Requirements
The startup costs and funding requirements component helps users estimate how much capital may be needed before the Etsy or eBay store can launch and operate effectively. A marketplace business may appear inexpensive to start, but a realistic plan often includes initial inventory, packaging supplies, photography equipment, computer equipment, design assets, website or brand setup, product samples, legal or registration costs, marketplace setup costs, initial marketing, software subscriptions, and working capital. This section organizes those one-time and pre-opening costs so users can see the full investment requirement rather than focusing only on listing products online.
Inputs may include category-level startup expenses, capital expenditures, initial inventory purchases, launch marketing budget, deposits, tools, equipment, and the amount of cash reserve needed to cover early operating losses. Outputs may include total startup investment, funding gap, initial cash balance, capital allocation, and the relationship between upfront spending and future cash flow.
This component is valuable for entrepreneurs preparing to self-fund, seek a small business loan, approach investors, or compare launch strategies. It helps users answer a practical question before committing resources: how much money is needed to start, survive the early months, and reach a more stable operating position.
Why This Template Supports Better Marketplace Planning
The Etsy and eBay Store Financial Model is built to support practical decisions across the full planning cycle, from early concept validation to launch preparation, funding, growth management, and performance review. By combining dashboards, scenarios, charts, return analysis, revenue inputs, bank-ready reports, revenue breakdowns, KPI tracking, break-even analysis, and startup funding planning, the model gives users a structured view of how the business may perform under realistic assumptions.
It is particularly useful for marketplace sellers because it reflects the financial drivers that affect online store performance, including marketing efficiency, repeat customers, product mix, platform costs, inventory investment, operating expenses, and cash flow timing. Users can edit the assumptions to match their own store strategy, whether they plan to sell handmade products, curated gifts, supplies, vintage items, resale products, or multiple categories across Etsy and eBay. The result is a more organized, investor-ready, and decision-focused financial planning tool that can help users save time, reduce guesswork, and build a clearer path toward sustainable profitability.
File types:
Excel – Single-User: .xlsx
Excel – Multi-User
Similar ProductsOther customers were also interested in...


 HenrySheykin
Collectibles And Antiques Marketplace Financial Mo...
The Antique Store Financial Model helps entrepreneurs, business owners, consultants, founders, and a... Read more
Online Clothing Store Financial Model Excel Templa...
The Online Clothing Store Financial Model helps founders, entrepreneurs, business owners, consultant... Read more
Fashion Marketplace Financial Model Excel Template
The Fashion Retail Financial Model helps entrepreneurs, founders, business owners, consultants, and ... Read more

Toys Marketplace Financial Model Excel Template
The Toy Marketplace Financial Model Template helps founders, entrepreneurs, consultants, analysts, a... Read more

Electronics Marketplace Financial Model Excel Temp...
The Online Marketplace Financial Model Template helps entrepreneurs, founders, consultants, analysts... Read more

Arts, Crafts And Gifts Marketplace Financial Model...
The Handmade Goods Marketplace Financial Model helps founders, entrepreneurs, consultants, and analy... Read more
 Jason Varner
Subscription Box Financial Model – Up to 72 ...
Test many variables in this financial model for a subscription box company. Includes up to six prici... Read more

 Giorgos
Online Clothing Wholesaler – 5 Year Financia...
Advanced Financial Model presenting a 5 Year Business Plan for an Online Clothing Wholesale company.... Read more

Industry Based Financial Models (Variety Bundle)
There are currently 52 unique financial models included in this bundle. Nearly all of that include a... Read more

 Pushkar
Online Car Rental – 3 Statement Financial Mo...
Online Car Rental Platform Business Plan Model is a perfect tool for a feasibility study on launchin... Read more
You must log in to submit a review.